8 Data Quality Control Examples for Reliable Data
|
6
min read

Reliable data doesn't come from one validation rule. It comes from several controls working together, because a record can be structurally valid yet stale, complete yet anomalous, or technically clean while still producing an implausible business result. The financial exposure is substantial. Gartner research is commonly cited as estimating an average annual cost of $12.9 million per organization from poor data quality, while related summaries identify inaccuracy as the most frequently cited driver, affecting 68% of respondents (data quality cost and driver summary).
The operational evidence points in the same direction. In 2023, data teams reported 67 monthly data incidents, up from 59 in 2022. 68% said incident detection took four hours or more, and average resolution time rose by 166% to 15 hours per incident (2023 data quality survey). These data quality control examples treat each failure mode separately, then show how deterministic validation, statistical monitoring, timeliness controls, schema tracking, analytics, and in-database execution reinforce one another.
The practical question is where each control belongs, how teams should implement it, and what operational signal proves it's working. digna combines these capabilities while data remains in the customer's environment, making the approach relevant to regulated healthcare and finance datasets as well as high-volume telecom and public-sector pipelines.
Table of Contents
3. Timeliness Monitoring with Expected Delivery Time Estimation
6. Data Platform Observability and Operational Metrics Monitoring
8. Historical Trend Analysis and Statistical Pattern Recognition
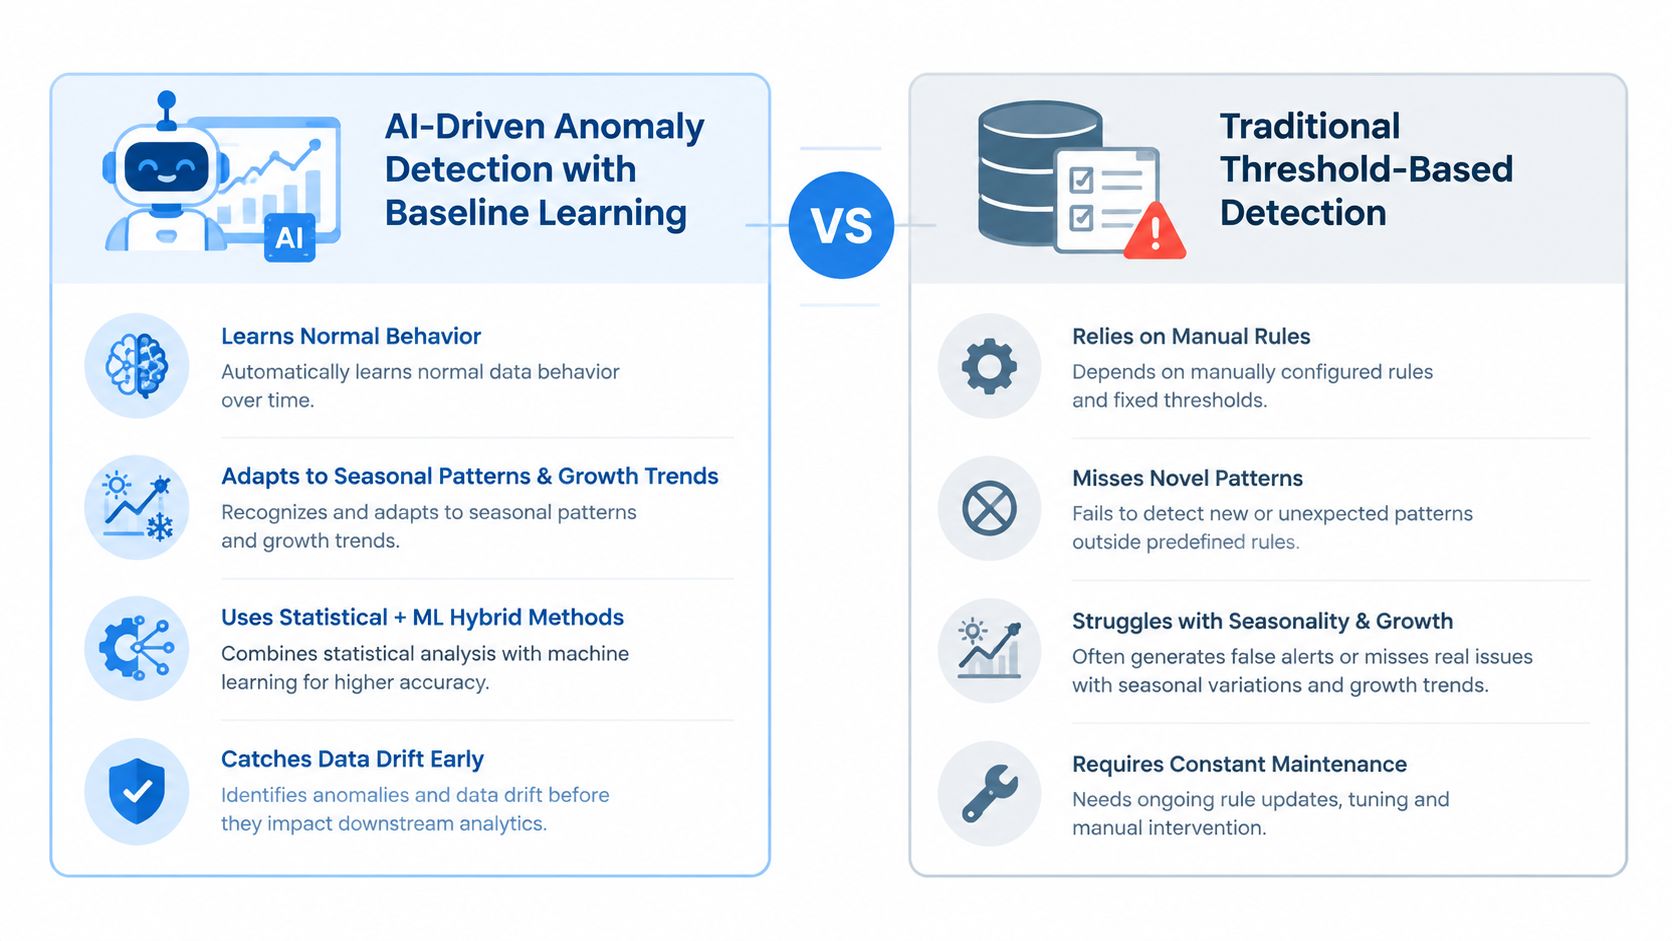
1. AI-Driven Anomaly Detection with Baseline Learning
A fixed threshold can flag a transaction count above an arbitrary limit, but it may also create noise during seasonal demand, planned campaigns, or normal growth. Baseline learning addresses that weakness by modeling the usual behavior of each dataset and comparing new observations with the pattern established over time.
The failure signal is deviation, not necessarily a rule violation. A financial services team might notice an unusual transaction-volume pattern that points to a processing error or possible fraud. A healthcare organization could investigate an unexpected shift in patient admissions or lab-result distributions. An e-commerce team might catch an order-volume decline before analysts notice that a dashboard is incomplete.
From unusual rows to unusual behavior
The implementation should account for both point anomalies, where one observation is abnormal, and collective anomalies, where several individually plausible metrics become concerning together. Sensitivity also needs tuning. A volatile payments stream may need a different alert posture from a stable regulatory dataset.
Teams should allow the baseline to learn before treating every alert as actionable. They can then pair anomaly detection with arrival monitoring, because an unusual volume may indicate a genuine business change, while a missing delivery can indicate a pipeline failure.
Practical rule: Use learned behavior to discover what fixed rules can't describe, then use deterministic checks to confirm whether the deviation violates a known business condition.
digna's AI anomaly detection for time-series data fits this role by monitoring changing data behavior without requiring every expected pattern to be written manually. The measurable consequence is earlier visibility into abnormal movement, with fewer alerts tied only to simplistic static limits.
2. Record-Level Data Validation Against Business Rules
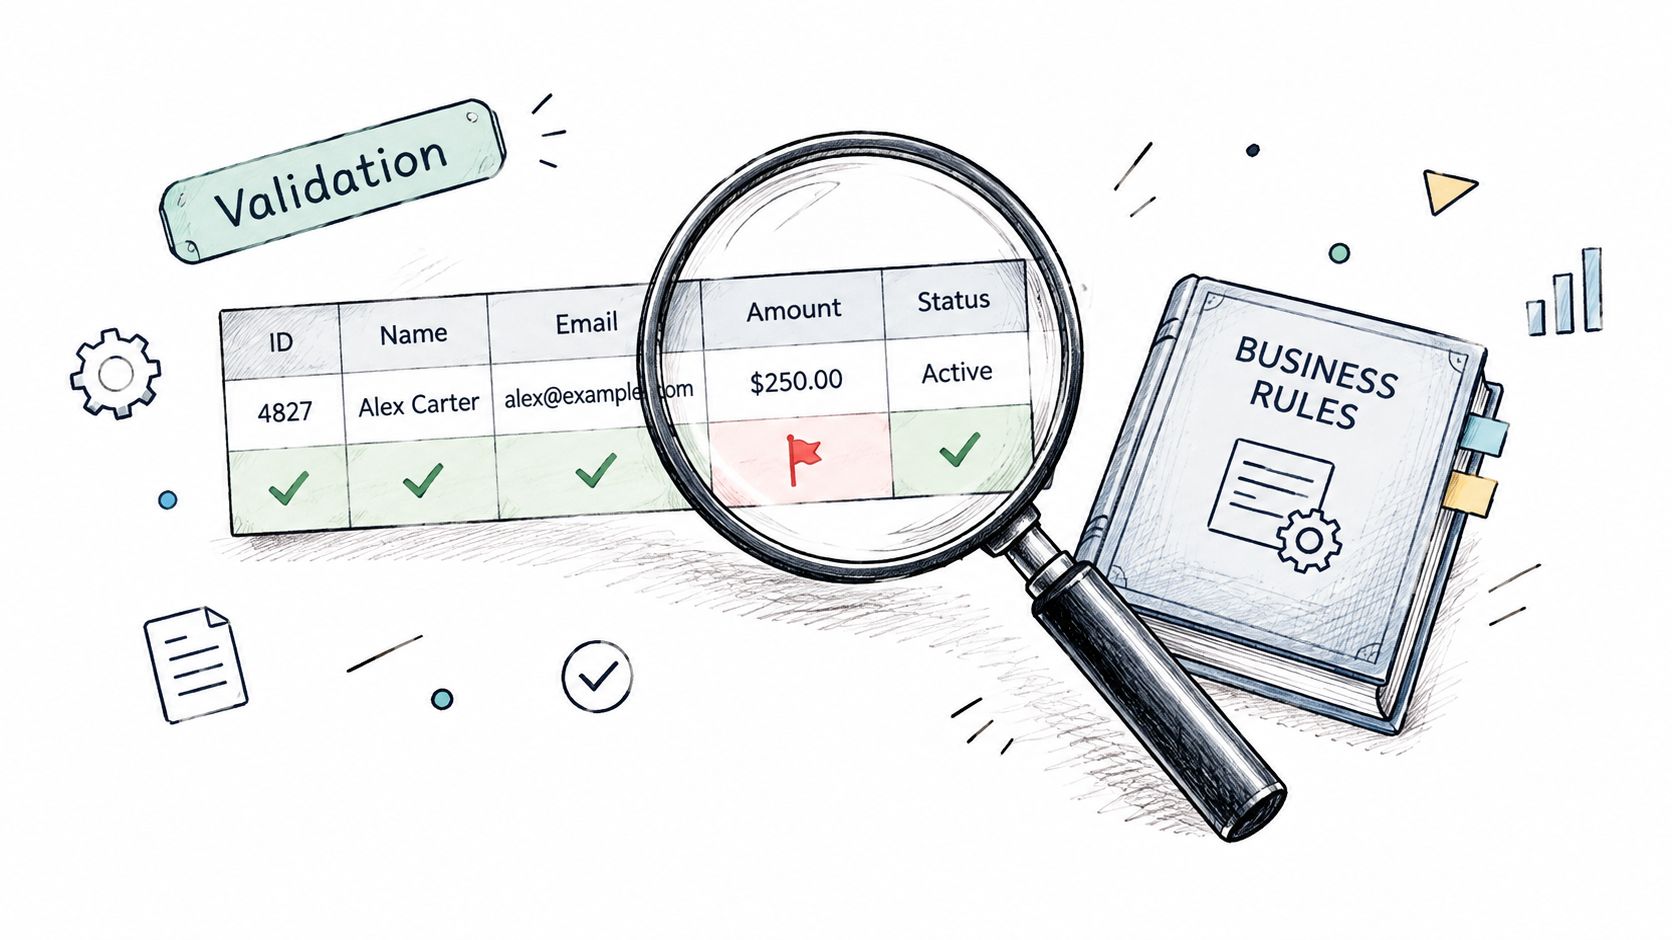
Some failures need no statistical model. If a field must contain a numeric value with a two-digit decimal format, the check is explicit. If a car type can only be Compact, Standard, Full size, SUV, or Other, an approved-value rule can reject or isolate anything else. IBM also documents cross-field logic such as Air Fare + Taxes = Total Cost (business validation rules).
That makes record-level validation especially useful where auditability matters. A financial institution can validate transactions against customer credit limits. A healthcare system can verify that patient identifiers match across clinical tables. A telecommunications provider can check that billing records have corresponding service-usage entries.
Make each rule explainable
Start with rules attached to the most consequential datasets, then involve business owners before expanding the rule library. A technical team may know how to test a field, but a finance or clinical stakeholder knows whether the field's business meaning has been represented correctly.
Useful controls include:
Format validation: Confirm that values follow the required type and pattern.
Approved-list validation: Restrict categorical fields to governed values.
Cross-field validation: Check that related columns satisfy a defined equation or dependency.
Referential validation: Confirm that identifiers connect to the records they're meant to reference.
Versioned rules: Preserve the rule definition and its effective date for audit history.
Deterministic checks don't replace anomaly detection. They provide the audit-ready explanation for a known requirement, while anomaly monitoring detects behavior nobody thought to encode. digna's data validation rules and continuous quality controls can be used as the explicit layer in that combination.
A reliable control doesn't just say that a row failed. It identifies the business condition, the affected record, the rule version, and the owner responsible for remediation.
3. Timeliness Monitoring with Expected Delivery Time Estimation
A dataset can pass every content check and still be unusable if yesterday's records arrive after today's reporting deadline. Timeliness monitoring treats arrival behavior as a quality dimension, not as a separate infrastructure concern.
A practical freshness calculation uses the latest event timestamp in a table. Freshness can be expressed as current system time minus the maximum event timestamp, including the SQL form TIMESTAMPDIFF(MINUTE, MAX(event_timestamp), CURRENT_TIMESTAMP()) (freshness and latency monitoring).
The failure signal might be a missing overnight load before morning dashboards open. A compliance team may need to know whether reporting data arrived by a required deadline. A warehouse team may spot an ETL process that's becoming progressively slower even though it still completes.
Turn schedules into operational contracts
Monitor the finest useful schedule for the dataset, whether that's hourly, daily, or weekly. Expected delivery should reflect business impact, not only historical variation. Planned maintenance windows also need documentation, otherwise the control will create alerts that engineers already know are harmless.
One practical rule classifies records older than 12 months as likely stale. If more than 30% of a database falls into that category, the source identifies a timeliness problem, while also noting that a 90-day refresh rate is often needed to maintain timeliness (data timeliness guidance).
digna's data timeliness monitoring adds expected delivery behavior to the quality picture. Pair it with volume anomaly detection. A load that arrives on time with an unexpectedly small volume is a different failure from a load that never arrives, and teams need both signals to triage efficiently.
4. Schema Change Detection and Tracking
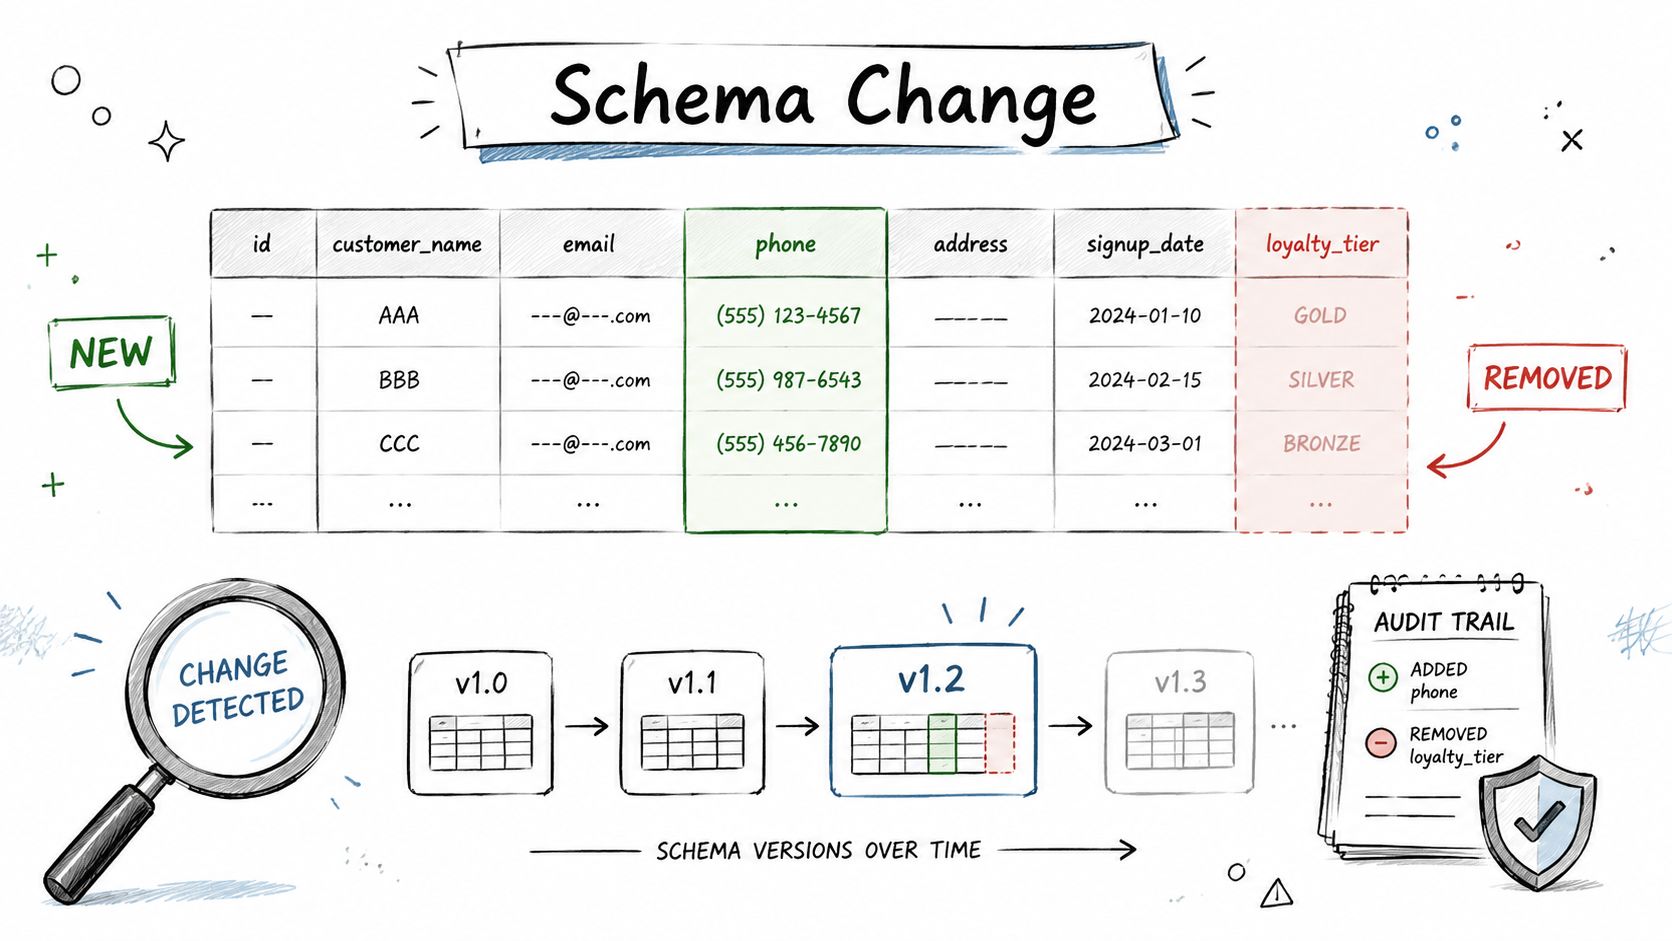
A source can remain populated and apparently healthy while a structural change breaks downstream models. An added field may be harmless, but a missing non-null column, renamed attribute, or changed type can invalidate transformations and reports.
Schema tracking detects these changes at the column level and preserves the evolution history. Azure Databricks' profiling output includes drift measures such as count_delta, avg_delta, and percent_null_delta, along with a drift_type that distinguishes baseline and consecutive-window comparisons (schema drift monitoring output).
Treat structural change as an ownership event
An analytics engineering team should know that a source system added fields before downstream models fail. A warehouse team should be able to identify an unannounced vendor change. Platform engineers can use the history to understand whether unexpected structural changes are becoming a recurring governance problem.
The response process matters as much as detection:
Capture the change: Record added, removed, renamed, and type-modified columns.
Notify the owner: Route the event to the source and downstream maintainers.
Update the catalog: Document the approved meaning and expected consumers.
Connect content checks: Run validation after structural changes to catch newly invalid values.
Review the incident: Distinguish an approved evolution from an uncontrolled break.
digna's schema drift monitoring supplies the structural layer. It shouldn't operate alone. Schema tracking tells teams what changed, while validation tells them whether the new structure still satisfies business requirements.
5. Business KPI Monitoring and Behavioral Analysis
Technical checks can report that rows arrived, columns exist, and values match their formats. They can't, by themselves, answer whether the business is behaving plausibly. KPI monitoring closes that gap by applying behavioral analysis to metrics such as revenue, customer acquisition, order volume, approval rates, and treatment outcomes.
An e-commerce team might identify an unexpected shift in average order value before it affects revenue reporting. A financial services firm could investigate an unusual change in transaction approval rates. A healthcare organization might compare admission patterns or treatment outcomes against established behavior.
Start with the KPIs most closely tied to decisions and financial or operational outcomes. Business stakeholders should help define the baseline and interpret alerts, because a campaign, product launch, policy change, or seasonal event can explain a movement that looks anomalous to an automated monitor.
A KPI alert is most useful when it starts a joint investigation. The business team explains the event, and the data team tests whether the underlying records support it.
The operational consequence is better separation between data failure and real business change. A falling order count might reflect demand, a broken ingestion job, or a filter introduced in a transformation. Correlating KPI movement with timeliness, volume, and schema signals gives responders a narrower path to root cause.
Document each resolved anomaly. Over time, that record improves alert interpretation and demonstrates data quality's connection to business outcomes rather than leaving quality metrics isolated in an engineering dashboard.
6. Data Platform Observability and Operational Metrics Monitoring
Valid rows do not guarantee a reliable data platform. Observability examines whether the environment can keep delivering data by tracking workload behavior, resource consumption, query performance, availability, execution duration, and usage trends.
A warehouse team may find that query performance has declined gradually. Cloud users may detect unexpected storage growth, while analytics engineers may identify one inefficient query consuming a disproportionate share of resources. These conditions can delay downstream delivery and timeliness checks even when record-level validation passes.
Platform observability connects infrastructure behavior with the quality failures it can cause.
Connect technical health to business service
Define normal operating ranges, then monitor both current values and their direction of change. An isolated slow query may be acceptable. Sustained performance degradation can delay dashboard refreshes, scheduled transformations, and data delivery.
Interpret metrics against operating calendars. Month-end finance processing, clinical reporting, and high-volume telecom events can create legitimate demand increases. Including these cycles in baselines reduces false alerts and helps teams distinguish expected load from capacity or workload problems.
Implementation should combine deterministic thresholds with statistical monitoring. A hard availability or execution-time limit can trigger immediate escalation, while trend analysis can detect gradual storage growth or worsening query latency. Correlating these signals with schema changes, delivery delays, and validation failures narrows root-cause analysis.
The result should guide action rather than produce another dashboard. Platform engineers can prioritize query optimization, partitioning, workload isolation, or resource allocation. Data leaders can show whether an incident began with platform behavior or defective source records, and then measure recovery through restored performance and delivery timing.
For a complementary operational perspective, this guide to process mining explains how event data can expose process behavior and bottlenecks. Platform observability monitors the environment running data work, while process analysis examines how activities move through an operational workflow.
7. In-Database Quality Metric Computation and Analysis
Moving production data into an external monitoring service creates a governance question before it creates a quality result. In-database execution answers that question by running validation, anomaly analysis, metric computation, and related checks inside the customer's own database environment.
That model is particularly relevant for healthcare, finance, and public-sector data. A healthcare organization can keep patient records inside controlled infrastructure. A financial services firm can align quality monitoring with its security and compliance posture. A government agency can maintain data sovereignty while still producing operational quality evidence.
Reduce movement without losing visibility
The key trade-off is resource coordination. Quality computations still consume database capacity, so teams should schedule heavier analysis during appropriate windows, monitor performance impact, and work with database administrators on allocation. Existing indexing and partitioning strategies can also support efficient checks.
A modular rollout lowers deployment risk. Teams can begin with non-intensive validation or timeliness checks, measure the effect on the database, and expand into anomaly and historical analysis as capacity and ownership mature. Results can then appear in a shared dashboard without exposing raw production records outside the controlled environment.
digna's platform is designed to run inside a customer's private cloud or on-premises environment, with checks executed where the data lives. That architecture supports a layered control plan for regulated and sensitive datasets, but it doesn't remove the need for access controls, scheduling discipline, or database performance monitoring.
The operational consequence is controlled observability. Teams gain quality signals without making data movement the default dependency, which simplifies conversations among data governance, security, engineering, and database administration stakeholders.
8. Historical Trend Analysis and Statistical Pattern Recognition
A single alert can identify a problem today. Historical analysis identifies deterioration that teams might otherwise normalize. It examines how freshness, validation failures, anomaly counts, business KPIs, and platform measures change across time, revealing gradual degradation, cyclical behavior, and shifts in volatility.
An analytics team might see freshness worsening each quarter. Data governance leaders may use trend evidence to support infrastructure investment. Platform engineers can identify a sustained rise in validation failures, while business analysts can distinguish seasonal customer-acquisition behavior from an emerging data defect.
Pair trend context with immediate detection
The control works best when teams compare current behavior with historical baselines rather than treating every fluctuation as equally important. Monthly review can surface changes before they become severe, while real-time anomaly detection handles urgent deviations.
The published data-quality framework emphasizes measurable dimensions including timeliness, punctuality, granularity, objectivity, accuracy and reliability, coherence, integrity, credibility, and security. Its central operational implication is clear: a control becomes actionable when teams tie it to a baseline, threshold, and trend over time.
digna's statistical pattern recognition can support that historical layer. Teams should document major trend changes and their root causes, then feed those findings back into thresholds, schedules, and ownership models. The result isn't a longer report. It's a way to distinguish normal variation from a control that's losing effectiveness.
8-Point Data Quality Control Comparison
Approach | Implementation complexity 🔄 | Resource requirements ⚡ | Expected outcomes ⭐📊 | Ideal use cases | Key advantages 💡 |
|---|---|---|---|---|---|
AI-Driven Anomaly Detection with Baseline Learning | Medium–High; ML training, model tuning 🔄🔄 | Historical data + moderate compute; ongoing model upkeep ⚡⚡ | High detection of novel anomalies; fewer false positives ⭐⭐⭐⭐ 📊 | Large/seasonal datasets; fraud detection; cross-metric drift | Adaptive baselines; scalable across datasets; early drift detection 💡 |
Record-Level Data Validation Against Business Rules | Low–Medium; rule authoring & maintenance 🔄🔄 | Low compute; significant human/business input for rules ⚡ | High deterministic correctness; audit trails for compliance ⭐⭐⭐⭐ 📊 | Regulated domains; critical transactional data; compliance checks | Explicit, repeatable enforcement; audit-ready evidence 💡 |
Timeliness Monitoring with Expected Delivery Time Estimation | Medium; scheduling models & integrations 🔄🔄 | Historical delivery logs + integrations; moderate compute ⚡⚡ | Reduces MTTD; predictive alerts for delayed/missing loads ⭐⭐⭐⭐ 📊 | ETL pipelines, SLA monitoring, overnight/periodic loads | Predictive delivery estimates; SLA evidence; proactive alerts 💡 |
Schema Change Detection and Tracking | Low–Medium; integrate with sources & versioning 🔄🔄 | Access to schema metadata and storage; low compute ⚡ | Immediate detection of structural changes; governance support ⭐⭐⭐ 📊 | Analytics engineering, vendor feeds, downstream models | Prevents silent failures; schema version history for audits 💡 |
Business KPI Monitoring and Behavioral Analysis | Medium; KPI definition + baseline learning 🔄🔄 | Business collaboration + historical KPI data; moderate compute ⚡⚡ | Detects business-impacting shifts; cross-team visibility ⭐⭐⭐⭐ 📊 | Revenue, AOV, churn, operational KPIs; business+tech alignment | Connects data quality to business outcomes; prioritizes incidents 💡 |
Data Platform Observability and Operational Metrics Monitoring | High; cross-system instrumentation & correlation 🔄🔄🔄 | High telemetry, storage, and analysis resources ⚡⚡⚡ | Holistic platform health view; performance & cost insights ⭐⭐⭐ 📊 | Platform engineering, capacity planning, cost optimization | Identifies performance degradation and optimization opportunities 💡 |
In-Database Quality Metric Computation and Analysis | Medium; in‑DB deployment & DBA coordination 🔄🔄 | DB compute resources, admin permissions; scheduling required ⚡⚡ | Maintains data residency; faster large-scale checks without movement ⭐⭐⭐⭐ 📊 | Sensitive/regulatory environments; very large datasets | Preserves residency and security; reduces network and infra costs 💡 |
Historical Trend Analysis and Statistical Pattern Recognition | Medium; advanced analysis & interpretation 🔄🔄 | Requires weeks–months of history and analytics compute ⚡⚡⚡ | Surfaces gradual degradation and cyclical patterns; strategic insights ⭐⭐⭐⭐ 📊 | Long-term monitoring, governance reporting, capacity planning | Detects slow-moving issues; distinguishes cycles from true anomalies 💡 |
Turn Examples Into a Layered Control Plan
The eight examples address different failure signals, so replacing them with one universal score would hide important operational distinctions. Validation handles explicit record logic, approved values, relationships, and audit requirements. Timeliness monitoring handles delivery risk, missing loads, and freshness. Anomaly detection finds unexpected behavior that nobody has fully described in advance.
Schema tracking protects downstream consumers from structural drift. KPI monitoring translates data behavior into business impact. Platform observability identifies workload, performance, availability, and consumption conditions that can interrupt reliable delivery. In-database execution controls where quality analysis runs, while historical analysis reveals gradual change that point-in-time checks miss.
The evidence supports treating these as operational controls, not decorative dashboard features. Data teams reported 67 monthly incidents in 2023, and 68% said detection took at least four hours (2023 survey evidence). That combination makes ownership and response design as important as writing the check.
A practical rollout can follow this sequence:
Prioritize critical datasets: Start with data that supports regulatory reporting, patient operations, financial decisions, customer transactions, or high-value AI and analytics workflows.
Choose the narrowest effective control: Use a business rule for a known record condition, timeliness monitoring for delivery risk, schema tracking for structural change, or anomaly detection for behavior that's difficult to specify manually.
Establish the baseline or rule: Define expected delivery, approved values, structural expectations, business KPI behavior, or historical performance.
Route alerts to owners: Send a failed validation to the steward who can correct the source, a late load to the pipeline owner, and a KPI anomaly to both business and technical stakeholders.
Document remediation: Preserve what changed, why it changed, who resolved it, and whether the control needs adjustment.
Review trends: Examine recurring failures, alert noise, resolution time, and changing data behavior so the control plan improves instead of expanding blindly.
This layered approach also addresses a modern scope problem. Organizations are exploring controls beyond structured tables, including semi-structured data and unstructured documents, so quality programs increasingly need to account for JSON, logs, text, images, and model inputs (observability trends for AI). Deterministic validation remains essential, but it works better alongside anomaly and timeliness monitoring when pipelines change continuously.
digna is a relevant modular option for combining these controls across finance, healthcare, telecommunications, and public-sector environments. Its platform can monitor behavior, validate records, track arrival patterns, detect schema changes, analyze historical metrics, and execute checks inside the customer's infrastructure. The best deployment still starts with a defined failure mode, accountable owner, and measurable operational consequence.
digna provides in-database validation, anomaly detection, timeliness monitoring, schema tracking, business monitoring, platform observability, and historical analysis in a modular platform. Visit digna to evaluate how these controls can improve reliability across your critical data pipelines without moving production data outside your environment.