AWS Data Pipeline Monitoring: A 2026 Implementation Guide
|
7
min read

The first sign is usually small. A dashboard stops refreshing before standup, a finance team asks why last night's numbers look thin, or an ops channel fills with messages about a pipeline that “finished” but didn't deliver anything useful. By the time someone starts digging through logs, the business already feels the delay.
That's the core problem with AWS Data Pipeline monitoring. The failure isn't just a failed job, it's the hidden cost of not knowing whether a job is healthy, stale, incomplete, or just wrong. Native observability has existed for AWS Data Pipeline for years, starting with the built-in monitoring and debugging features AWS introduced on August 14, 2014 through the AWS Management Console and CloudWatch, which was an early acknowledgement that pipeline visibility belongs in the service itself (AWS announcement).
Table of Contents
Why AWS Data Pipeline Monitoring Matters
The cost of not seeing a stall early
Key Telemetry Signals for Pipeline Health
Metrics, logs, traces, and freshness signals
AWS Architecture Patterns for Monitoring
Native services and what they're good at
Setting Up Alerts and Defining SLAs
Build alerts around action, not volume
Root-Cause Playbooks and Practical Examples
Common pipeline failure patterns and diagnostics
Integrating digna for Advanced Observability
Where it complements AWS instead of replacing it
Tips and Best Practices for Ongoing Monitoring
Keep the signal useful
Keep the scope lean and practical
Why AWS Data Pipeline Monitoring Matters
At 6 a.m., the reporting team opens a dashboard and sees the previous night's load is missing. The job itself shows green in the scheduler, so the first instinct is to blame the warehouse, the source system, or the dashboard layer. In practice, the problem is often simpler and more expensive, the pipeline went quiet, and nobody noticed soon enough to protect the business day.
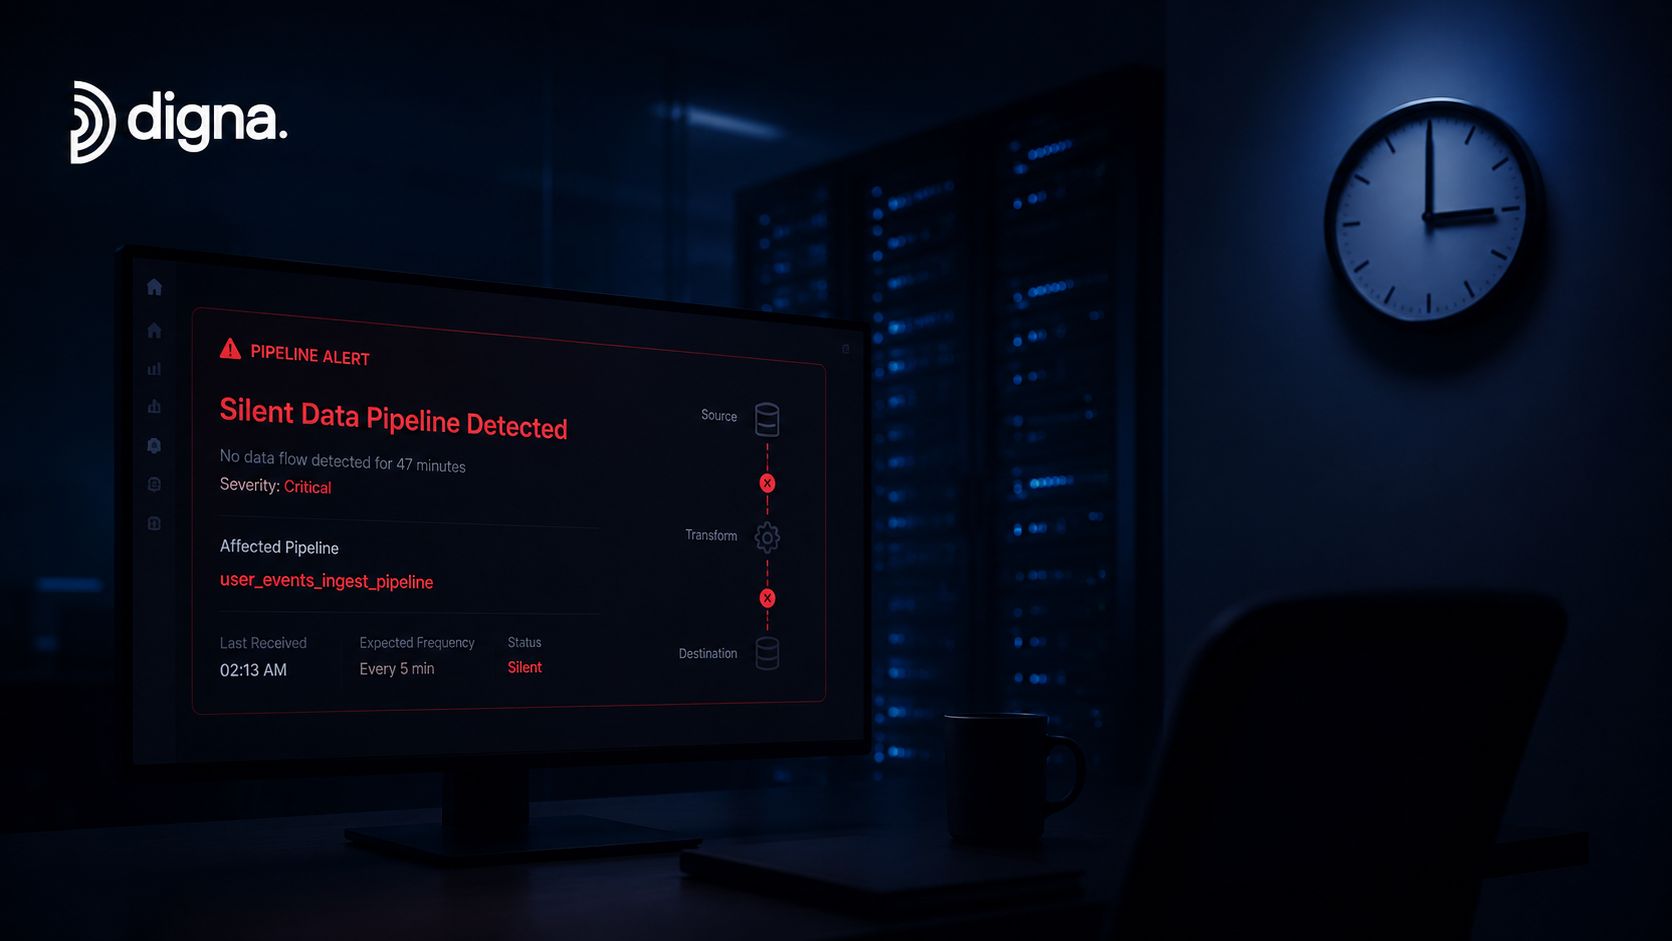
That kind of silence is exactly why AWS data pipeline monitoring matters. AWS has long treated observability as a core operational need, not a cosmetic layer. The service launched built-in monitoring and debugging features through the console and CloudWatch, giving teams a native way to inspect execution status and troubleshoot failures without building separate tooling from scratch. For a broader view of immediate visibility practices, the immediate visibility guide is a useful reference point.
The cost of not seeing a stall early
The most expensive failures are not always the obvious ones. A pipeline can fail loudly and still be easy to catch, but a stalled feed that leaves old data in place can keep producing believable dashboards, wrong decisions, and delayed incident response. That is why freshness, not just task success, has to be part of the monitoring story.
AWS's Well-Architected guidance makes this concrete by focusing on source-data availability and the elapsed time since the last successful arrival or run, then alerting when that interval exceeds the expected schedule (AWS Well-Architected guidance). That is the hidden operational cost teams learn the hard way, stale dashboards, broken downstream models, and reporting teams spending their morning reconciling data that should have arrived overnight.
Practical rule: if the business depends on the data being fresh, a green job status is not enough. You need a freshness alarm as well.
Monitoring also protects you from a different kind of waste, overreacting to false alarms while real problems slip through. Good monitoring turns “something feels off” into a specific signal, and it gives the on-call engineer a path from alert to root cause without guesswork.
For enterprises that cannot move sensitive data around just to watch it, in-database observability matters. Tools such as digna can help teams inspect what is happening closer to the data itself, which reduces movement across systems and addresses security concerns that often block broader monitoring adoption.
Key Telemetry Signals for Pipeline Health
A pipeline can look healthy while the business is already paying for a miss. The common failure mode is not a hard outage, it is a quiet gap in visibility that lets bad data, late arrivals, or partial runs slip through until analysts notice the damage in downstream reports. Strong monitoring starts with signals that show movement, failure, and freshness before users do.
For AWS Data Pipeline, CloudWatch exposes a dedicated metric set with records in/out, bytes in/out, errors, warnings, unprocessed records, and dropped records, including indicators such as PipelineRecordsIn, PipelineRecordsOut, PipelineErrors, PipelineWarnings, and PipelineRecordsDropped (CloudWatch pipeline metrics). Those measurements turn health into counts and byte volumes you can compare against the last good run, which is far more useful than relying on job status alone.
Metrics, logs, traces, and freshness signals
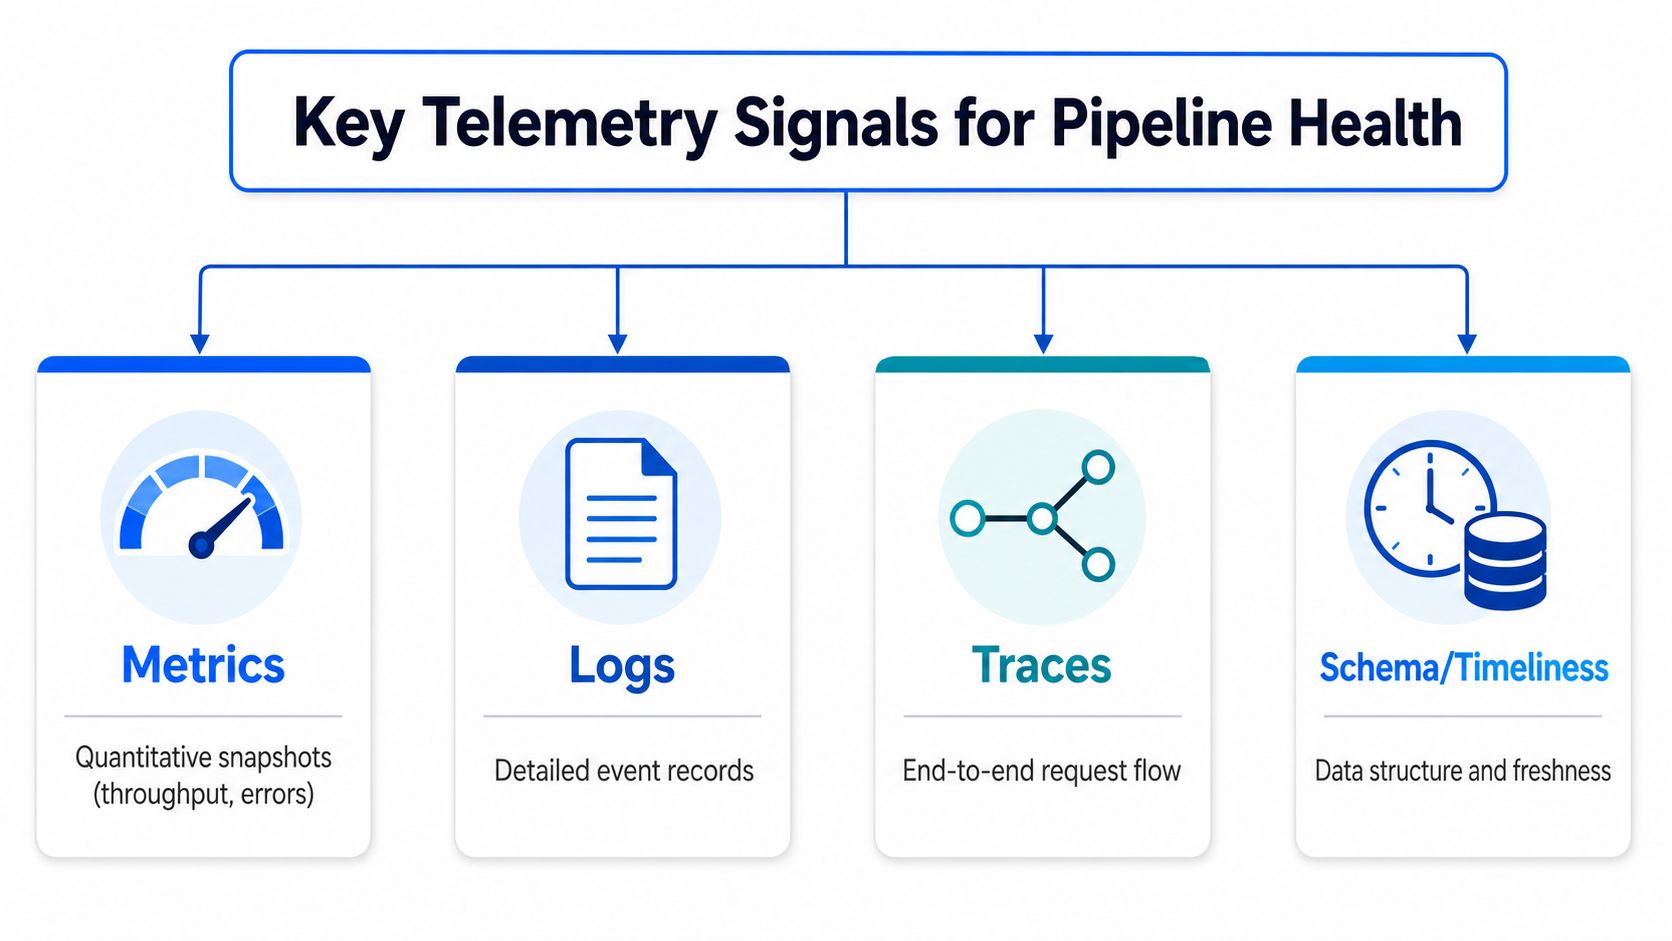
Metrics show whether the pipeline is moving data, failing, or drifting away from normal throughput. Logs show what happened at each step, which error code appeared, and which input triggered the issue. Traces matter once work crosses services or layers, because they show where latency and failures concentrate. Schema and timeliness signals catch the quieter failures, a column changes, a partition lands late, or the table stops receiving new rows when it should.
A useful baseline starts with throughput and error patterns, then adds freshness. Even without a deep stack of custom tooling, teams can use CloudWatch signals such as PipelineBytesIn, PipelineBytesOut, PipelineRecordsIn, PipelineRecordsOut, PipelineErrors, and PipelineWarnings to tell the difference between a legitimate volume spike and a real failure. That distinction matters because batch jobs often look unusual during expected peaks, and the wrong alert pattern creates noise that on-call teams stop trusting.
The right approach is to choose a small set of signals for each pipeline stage and make them comparable over time. If every dashboard tile measures something different, nobody can see what changed. If each team watches a different metric, incidents turn into debates instead of fixes.
For teams that need a practical reference on alerting and faster detection, the immediate visibility guide is useful. For architecture that keeps observability closer to the data without moving sensitive records around, digna's in-database observability architecture is a sensible pattern to review, especially in environments where security teams are cautious about broad data duplication.
Useful test: if a metric does not help answer “what failed, where, and when,” it does not belong on the primary dashboard.
AWS Architecture Patterns for Monitoring
A pipeline can be “up” and still be failing in the way that matters. Rows stop landing, a branch job stalls, or a retry loop hides the fault behind a successful status. The monitoring pattern has to show that difference quickly, without forcing engineers to piece together five consoles during an incident.
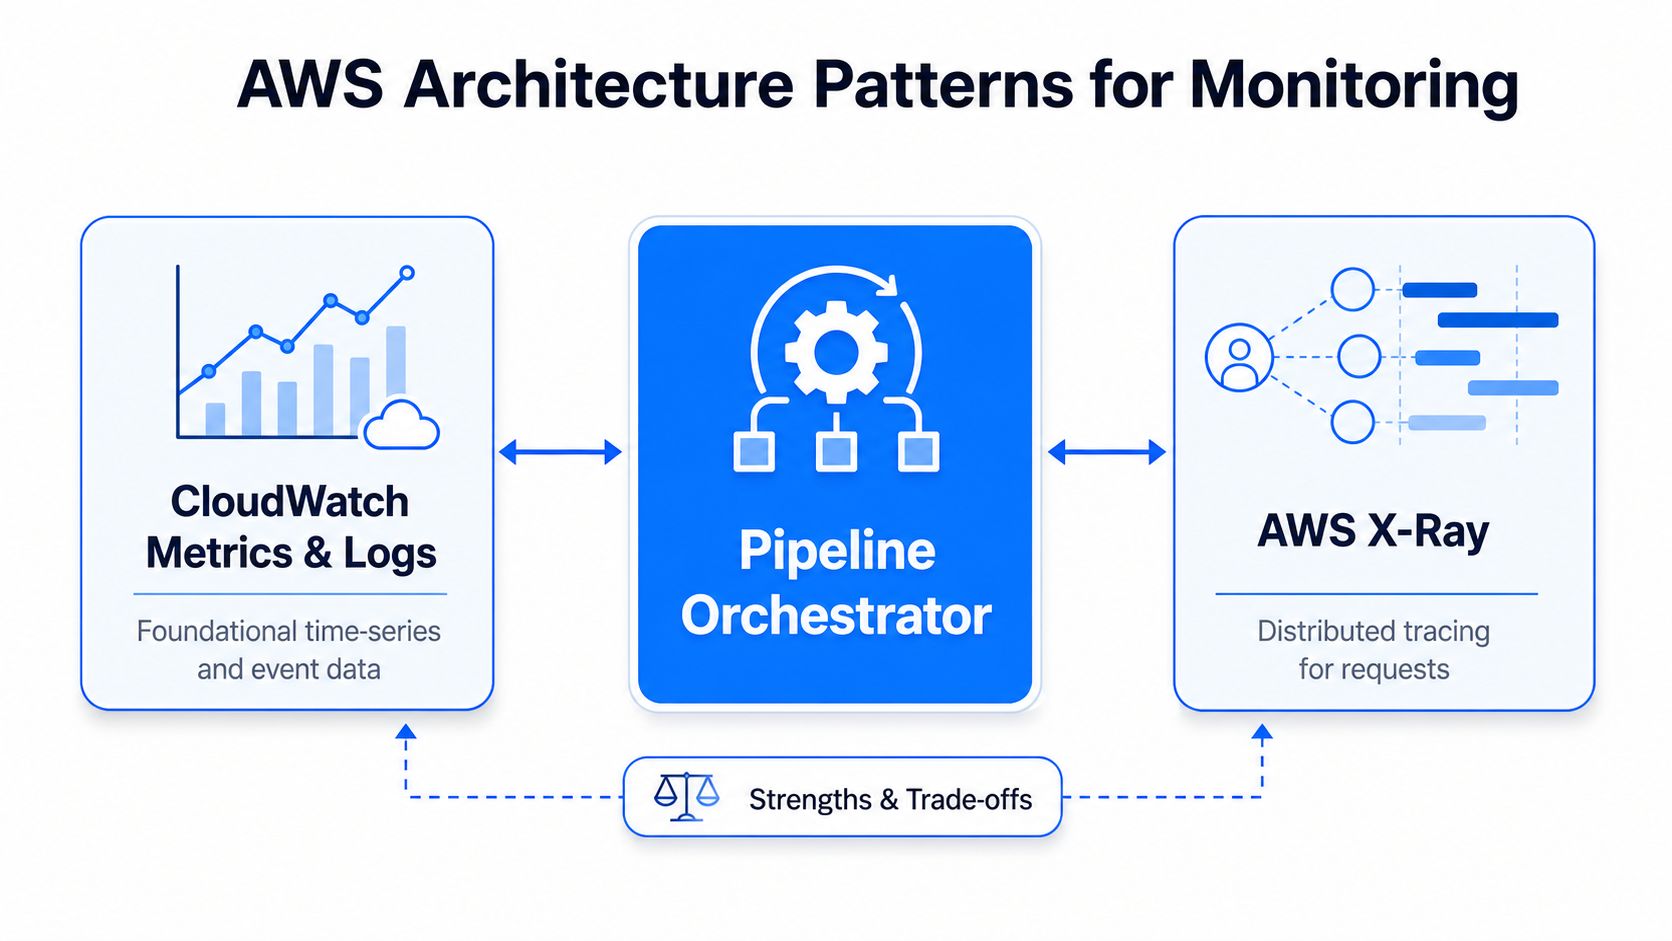
AWS monitoring works best when one service handles metrics, another handles traces, and a third handles change history. CloudWatch is the base layer for time-series metrics and logs, X-Ray fits distributed request tracing, and CloudTrail covers audit-style visibility into who changed what and when (CloudTrail logging for Data Pipeline). In practice, the question is not which tool is superior. It is which mix gives enough context to find the fault before the on-call rotation burns time on guesswork.
Native services and what they're good at
CloudWatch should be the starting point because it already exposes the signals AWS Data Pipeline publishes and lets teams query them from the console or with aws cloudwatch get-metric-statistics. That makes it useful for throughput, errors, and freshness alarms, especially when the operational question is whether data stopped moving or just slowed down. X-Ray helps when execution fans out across services and latency concentrates in one hop. CloudTrail serves a different purpose, it tracks governance, change history, and investigations rather than runtime health.
The trade-off is correlation. Native tooling is strong, but if logs, metrics, and workflow state sit in separate places, engineers still spend too much time reconstructing the incident from fragments. A central Pipeline Orchestrator view, whether that is Step Functions, Airflow, or another control plane, gives operations a single place to see what should have happened and what happened. That matters most when a pipeline looks healthy in one layer and stalled in another.
A clean monitoring stack separates execution telemetry from audit telemetry. Mixing them creates noise, splitting them too far apart creates blind spots.
For larger estates, the pattern that holds up is layered observability, infrastructure telemetry for the platform, workflow telemetry for orchestration, and structured diagnostics for the data itself. That combination makes it easier to tell whether the failure sits in compute, orchestration, or transformation logic. Stopping at job success or failure is not observability, it is a status flag with poor context.
If your team is mapping how this fits into broader pipeline design, the architecture notes in digna's data pipeline architecture overview are a useful complement to the native AWS view. They are especially relevant when security teams want in-database observability without moving sensitive records into another system.
For teams that prefer visual documentation, diagram generators by Writingmate can help turn incident paths into something the full team can review without arguing over who remembers the flow correctly.
Setting Up Alerts and Defining SLAs
Alerts should drive action, not background noise. If an on-call engineer starts treating pages as routine batch chatter, the monitoring setup is already costing the team time, attention, and trust. The practical fix is to tie alerts to service-level expectations, so the page reflects a real operational risk instead of an arbitrary threshold.
For pipeline freshness, the signal is simple. Track source-data availability, measure the time since the last successful arrival or run, and alert when that gap exceeds the expected schedule. That catches silent stalls, missing upstream feeds, and jobs that finish without producing useful output. AWS also recommends classifying failures by business impact, which keeps priority aligned with the downstream damage that a delay or missing dataset can cause.
Build alerts around action, not volume
Start with the business cadence for each pipeline stage. If a table feeds morning reporting, the alarm should care about whether yesterday's data arrived on time. If a feed supports risk or compliance, the alert should escalate faster than an internal analytics delay. Thresholds should reflect expected patterns, not a copy-pasted number across environments, because legitimate batch swings can otherwise create a flood of false positives.
A practical setup usually has three layers. Critical alerts cover missing data or jobs that run past the expected window. Warnings cover delayed starts or abnormal throughput. Informational alerts cover anomalies that deserve review but do not break downstream use right away.
Notification routing matters too. If your team does not trust the delivery path, it will not trust the alert. The same discipline that keeps pipeline alerting sane also applies to workflow notifications, and the setup notes for use Gmail relay for form submissions are a useful reference point for reliable message delivery.
For a deeper look at low-latency observability patterns, see digna's real-time data monitoring guide. That matters in enterprise settings where security teams want in-database visibility, not another copy of sensitive records moved into a separate system.
The rule I have seen hold up is simple. Every alert should tell the on-call engineer what changed, what is affected, and what to inspect first. If it does not answer those three questions, it is just another red dot on a screen.
Root-Cause Playbooks and Practical Examples
An alert lands at the same time a product manager asks why the dashboard is blank. The on-call engineer has to decide fast whether the problem sits in source ingestion, transformation logic, orchestration, or the consumer layer. Teams that recover quickly already know the failure patterns, so they can compare the symptom against a short set of known signatures instead of starting from zero.
AWS recommends watching errors across infrastructure, workflow, and application code, and using emitted metrics plus alarms to catch component failures quickly. That layered view matters because a pipeline can report success in the orchestration layer and still deliver nothing useful downstream. A useful setup records timestamps, inputs, outputs, error codes, and step names for each stage, then ties those logs to job-duration anomalies and execution history.
Common pipeline failure patterns and diagnostics
Symptom | Likely Cause | Diagnostic Steps |
|---|---|---|
Job ran, but downstream table is empty | Upstream source delivered no records, or a transformation filtered everything out | Check source-arrival time, compare |
Alert triggered for a delayed feed | Upstream system missed its schedule, or the job started late | Compare last successful arrival to the expected cadence, review workflow execution time, verify retry history |
Throughput dropped without a hard failure | Source volume changed, partitioning shifted, or a step became slower | Review |
Job marked successful but dashboard is stale | Output landed in the wrong path, or a downstream consumer failed silently | Validate outputs, review step names and timestamps, trace the handoff to the next system |
Errors increased in one stage only | Transformation logic, connector issues, or permission changes | Isolate the stage, inspect error codes, review CloudTrail for recent changes, then rerun only the affected segment |
A runbook for regulated environments needs one more question answered before anyone reruns anything, what data was processed before the failure. If the team cannot reconstruct the path, the replay is hard to defend and can create a second incident during recovery. That is where monitoring gaps become expensive, because the hidden cost is usually not the alert itself, it is the time spent proving what was safe to rerun.
The same playbook should also stop people from chasing the wrong layer. If the metrics show no new input, transformation code is not the first place to inspect. If the input arrived on time but the output collapsed, the problem is downstream or in the handoff. For teams that need in-database visibility without moving sensitive records out for inspection, digna integrations are often part of the design discussion, especially where enterprise security rules make data movement a bad trade-off.
Integrating digna for Advanced Observability
Native AWS tooling is enough for a lot of infrastructure and workflow monitoring. Enterprise teams usually need more when the core question is not whether the job ran, but whether the data inside the warehouse is healthy without moving it out for inspection. That's where digna fits, as an in-database observability layer that runs inside your own infrastructure and computes metrics where the data already lives.
digna's modules cover AI-driven anomaly detection, timeliness, data validation, and schema tracking, which maps well to the failure modes that AWS-native telemetry won't catch on its own. It also supports private cloud or on-premises deployment, and it performs metric computation and analysis in the customer's databases, which helps address security and governance concerns when data movement is restricted. That design is especially relevant in finance and healthcare, where teams often need observability without broadening the data-access surface.
Where it complements AWS instead of replacing it
CloudWatch still belongs in the stack for runtime signals, and CloudTrail still matters for auditability. digna adds another layer, it can detect schema changes, monitor arrival timing, and flag abnormal behavior in the table itself. The value is not redundancy, it's coverage. If a pipeline is healthy at the runtime layer but the data is drifting, you need a tool that sees the drift.
For teams evaluating integration points, the digna integrations page is the right place to check how it connects into existing environments. The practical appeal is that the checks happen in place, so the observability workflow doesn't have to depend on exporting data into a separate analysis system first.
Security-first observation: many enterprises don't reject observability, they reject unnecessary data movement. In-database analysis solves that concern directly.
The strongest use case is a layered model, CloudWatch for pipeline mechanics, CloudTrail for governance, and a data-observability layer like digna for schema drift, timeliness, and anomaly detection on the actual tables. That's the difference between watching a job and watching the data that job is supposed to produce.
Tips and Best Practices for Ongoing Monitoring
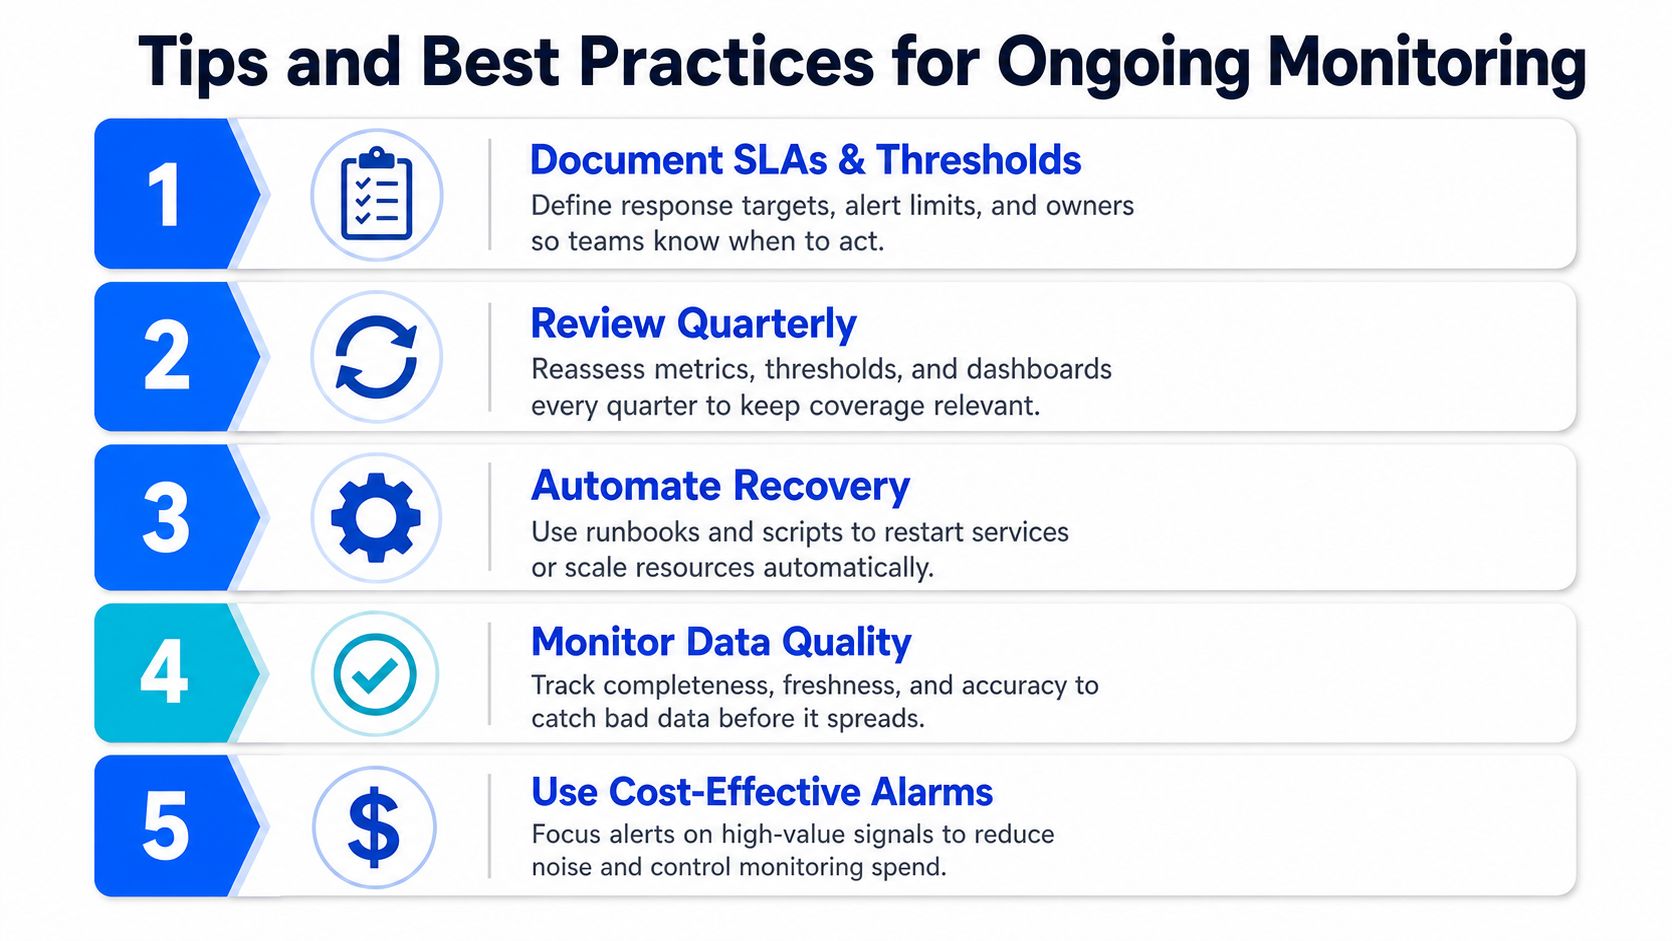
Monitoring loses value when teams treat it as a one-time setup. Pipelines change, source systems drift, SLAs evolve, and checks that made sense last quarter can become noisy or incomplete. The teams that avoid expensive surprises keep monitoring small, specific, and on a regular review cycle.
Keep the signal useful
Document every SLA and threshold in the same place as the pipeline ownership model. If an alert page reaches the wrong team, or if nobody knows why a threshold exists, the monitoring stack is already leaking value. Review thresholds regularly and adjust them when seasonal patterns or upstream changes shift the expected baseline. AWS Well-Architected guidance says thresholds should account for normal variability, because otherwise the system fills with false positives and incidents get harder to spot.
Automation keeps the configuration consistent. Infrastructure-as-code for alarms, dashboards, and notifications prevents the drift that shows up when teams hand-edit settings in different environments. Shared dashboards matter too. Data engineers, analysts, and governance stakeholders need the same operational picture, not separate versions of it. That avoids the familiar problem where one group says the numbers look fine while another is debugging the incident.
Keep the scope lean and practical
Do not monitor everything just because the tools make it possible. Focus on the metrics that show whether the pipeline is healthy, fresh, and producing the right shape of data. In practice, that usually means throughput, error counts, freshness, and a small set of schema or quality checks. The rest can stay in secondary views for debugging.
A simple rollout works better than a large design.
Document SLAs and thresholds for the one pipeline that matters most.
Automate the alarms so every environment inherits the same settings.
Add quality checks for schema, timing, and output completeness.
Review incident notes after each failure and tune the playbooks.
Expand only when the current alerts are clean, useful, and owned.
For teams that want to move from basic runtime alerts to data-aware monitoring, modular tools are useful. digna can be added for anomaly detection, schema tracking, or timeliness checks without forcing a redesign of the rest of the stack. That makes it easier to expand observability without turning the platform into a maintenance burden, and it helps address enterprise security concerns because the checks stay in database rather than requiring data movement into another system.
Monitoring data should be treated like a product. Keep the configuration versioned, keep the dashboards readable, and keep the alert volume low enough that people still trust it. The win is not more alerts, it is faster, calmer decisions when the data platform goes quiet.