Data Observability for Data Engineers: A Practical
|
7
min read

A batch pipeline can finish green while the dashboard it feeds is already wrong. The load may contain only part of the expected data, an upstream system may have added a column that changes a transformation, or the latest partition may be hours late. Infrastructure monitoring reports a successful run, while analysts and machine learning systems consume stale or corrupted outputs.
That gap is where data observability for data engineers earns its place. It examines the behavior of the data moving through warehouses, lakes, streams, and transformations, then connects anomalies to ownership, impact, and response. The practical challenge isn't collecting every possible signal. It's building enough coverage to catch meaningful failures without moving sensitive data out of your environment or burying engineers in alerts.
Table of Contents
Why Data Engineers Need Observability Beyond Pipeline Monitoring
Monitoring systems and monitoring data
The five pillars and their practical value
Instrumenting the Four Core SLIs Every Pipeline Needs
1. Job success rate
2. Freshness latency
3. Completeness and volume
4. Schema conformity
Solving the Alert Fatigue Problem That Undermines Observability
Design alerts around decisions
Measure detection quality, not notification volume
Implementing Observability in Regulated and On-Premises Environments
A deployment sequence that survives security review
Heterogeneous estates need a common contract
Choosing the Right Alerting Strategy for Your Data Stack
When simple rules win
When adaptive methods help
Integrating Observability into Your Existing Pipeline Architecture
Put checks where they answer a question
Starting Small and Scaling Your Observability Implementation
Why Data Engineers Need Observability Beyond Pipeline Monitoring
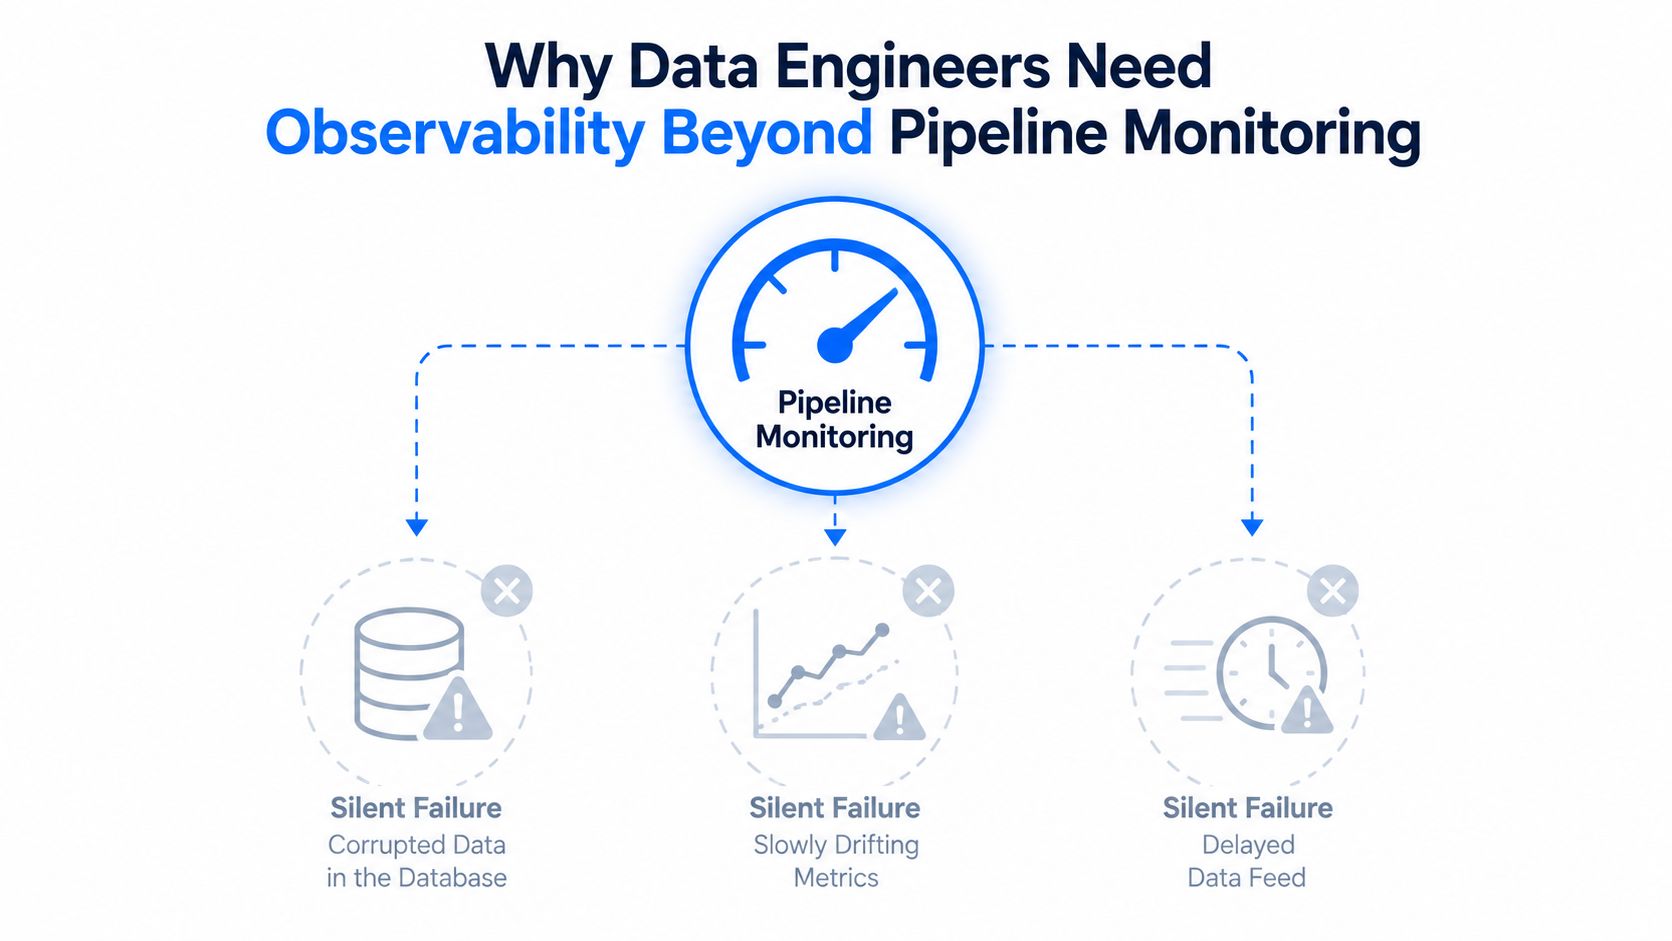
At 9:00 a.m., an orchestration dashboard shows a successful overnight job. The warehouse task completed, retries stayed at zero, and the compute cluster remained healthy. By late morning, finance notices that a revenue dashboard is missing recent transactions. A model trained on the same table has also started producing unstable results.
The pipeline didn't fail in the conventional sense. It delivered a partial partition and marked the work complete. A downstream join excluded records, and the resulting table looked structurally valid enough for dashboards to load. Traditional monitoring saw an available system. It didn't see unreliable data.
Monitoring systems and monitoring data
Pipeline monitoring still matters. Job success rate, retry behavior, task duration, executor health, and infrastructure capacity help engineers identify operational failures. But those signals answer whether a process ran, not whether the output is complete, timely, structurally consistent, or behaving normally.
Data observability adds inspection of the data itself. It combines technical signals with context such as lineage, owners, downstream dependencies, and business criticality. The distinction is similar to the difference between checking that a delivery truck left the warehouse and checking whether the package contains the right items and arrived before the customer needed it.
A useful starting point is the digna comparison of data observability and data quality, because quality rules and observability solve related but different problems. Deterministic tests enforce known expectations. Observability helps expose unexpected changes that nobody thought to encode as a test.
The five pillars and their practical value
Most data observability models use five pillars, freshness, distribution, schema, lineage, and volume, as described in Databricks' overview of data observability.
Freshness shows whether data arrived within its expected schedule. It matters most for operational dashboards, regulatory reporting, and processes that depend on current records.
Volume compares the amount of data with normal behavior. It can expose incomplete loads, duplicate ingestion, broken filters, and upstream outages.
Schema tracks columns, data types, and structural changes. It becomes critical when source systems evolve independently of warehouse consumers.
Distribution looks at value behavior, including null patterns, ranges, uniqueness, and other dataset characteristics. It can catch a semantically broken feed that still has the right columns and row count.
Lineage connects an incident to the assets and teams affected. Without it, engineers spend response time searching for owners and downstream dependencies.
A regulated warehouse may prioritize schema and lineage because an uncontrolled structural change can affect reporting evidence. A streaming platform may emphasize freshness and distribution because delayed or abnormal events can distort operational decisions quickly. The right implementation doesn't treat every pillar equally. It gives deeper coverage to data products whose failure carries greater business or compliance impact.
For broader industry context, the observability tag on ecommerce is useful for seeing how reliability concerns appear outside core platform engineering. The production lesson is straightforward: keep infrastructure monitoring, then add data-level signals where a green pipeline status can still hide a bad outcome.
Instrumenting the Four Core SLIs Every Pipeline Needs
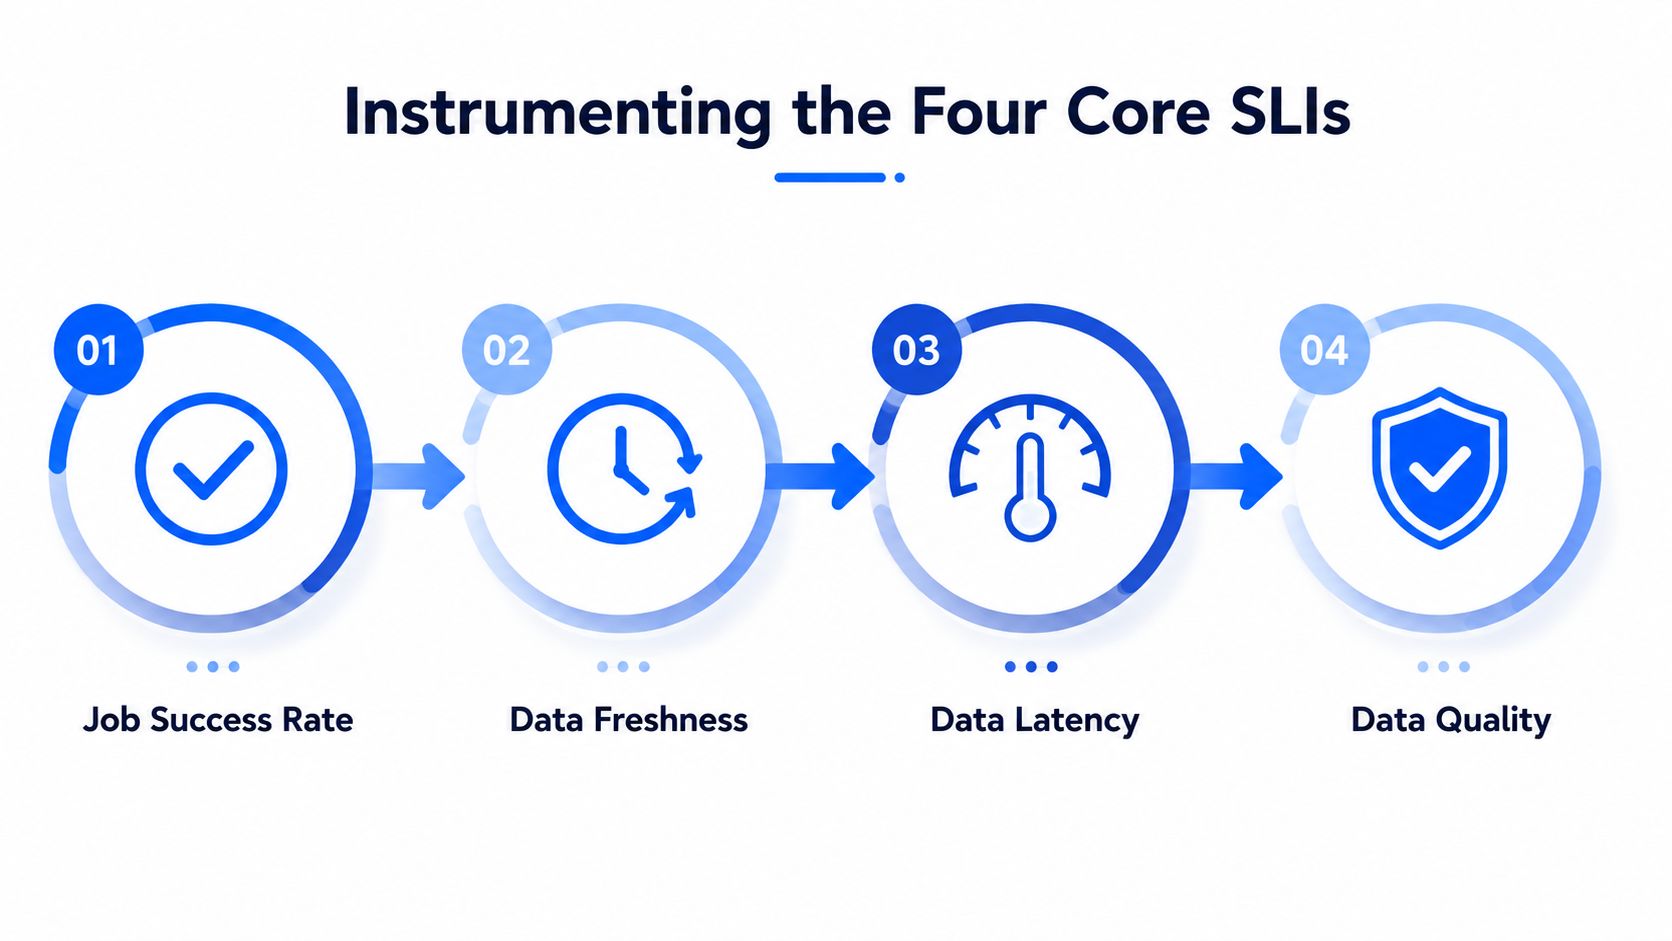
A practical observability rollout can begin with four service level indicators, or SLIs, on each critical pipeline: job success rate, freshness latency, completeness or volume, and schema conformity. These signals cover execution, timing, quantity, and structure without requiring an elaborate monitoring program on day one.
1. Job success rate
Track completed, failed, retried, skipped, and timed-out executions. A simple success ratio is useful, but don't stop at a binary status. Record the execution path, duration, dependency state, and whether the job produced its expected output.
For batch systems, emit a completion event only after the target partition has been committed and validated. For streaming systems, distinguish process liveness from useful progress. A consumer can remain connected while lag grows or malformed records accumulate.
2. Freshness latency
Freshness measures the time since the last successful update, or the delay between expected and actual delivery. For critical datasets, teams often express the metric as a p95 or p99 latency, which prevents a small number of fast records from masking a long tail of delayed arrivals. Industry guidance on freshness monitoring also frames the check against the expected ingestion cadence.
Batch pipelines should record scheduled time, arrival time, and successful availability time. Streaming systems should track event-time lag and ingestion-time lag separately, since a live consumer can still process late events.
Use historical behavior as context rather than applying one universal threshold. A practical baseline compares the same hour of day across the prior 2–4 weeks, as outlined in Streamkap's guidance for streaming observability. For a critical alert, the recommended statistical starting point is 3 standard deviations from baseline, while a warning can use 2 standard deviations. Those values belong in a policy that also considers delivery commitments and downstream consequences.
3. Completeness and volume
Compare expected with actual record counts, partitions, files, or event windows. A daily batch may need an expected partition and a minimum record range. A stream may need to maintain event throughput and avoid unexplained gaps in time windows.
Counts alone aren't enough. Pair them with duplicate checks, null-rate monitoring, and partition coverage so a duplicated load doesn't look complete. Volume anomalies often arrive before a dashboard visibly breaks, which makes them valuable early indicators rather than merely post-incident diagnostics.
4. Schema conformity
Measure the percentage of rows that pass structural validation, then track changes to column names, types, nullability, and nesting. Schema drift includes added columns, removed columns, and datatype changes, as documented in Ataccama's explanation of schema tracking.
Keep the check close to the source boundary and again before high-value consumption layers. That placement helps distinguish an upstream contract change from a transformation defect. Store the observed schema version with each run so responders can compare the first bad output with the change that preceded it.
Practical rule: Baseline first, alert second. A threshold without historical context either misses gradual drift or creates noise during normal operating cycles.
For teams defining delivery metrics precisely, this guide to data timeliness definitions and monitoring metrics provides a useful vocabulary for separating arrival, processing, and availability delays.
Solving the Alert Fatigue Problem That Undermines Observability
More checks can make reliability worse when nobody trusts the notifications. A 2025 enterprise observability report found that only 13% of telemetry data was used, which means the central problem isn't always missing visibility. It may be an excess of signals that never become operational decisions, as reported in recent enterprise observability coverage.
The mistake is treating every deviation as an incident. A small distribution change on an exploratory table shouldn't page the same team, or use the same escalation path, as stale data feeding regulatory reporting. Engineers need a way to rank signals by impact, confidence, and ownership.
Design alerts around decisions
Every alert should answer four questions:
What changed? Identify the dataset, field, partition, or pipeline.
How unusual is it? Show the baseline, observed value, and confidence.
Who owns the response? Route the notification to a named team or service owner.
What could be affected? Include lineage and the business process that depends on the asset.
A useful alert might state that a critical table arrived outside its normal delivery pattern, identify the missing partition, show the downstream reporting dependency, and point to the ingestion job responsible. “Volume anomaly detected” isn't an incident workflow. It's an invitation to begin manual investigation.
Statistical thresholds help reduce arbitrary paging. Use 3 standard deviations for critical alerts and 2 for warning alerts when historical behavior is stable, then suppress duplicate notifications while an incident remains open. For seasonal, sparse, or rapidly changing data, a learned baseline may outperform a fixed rule, but it still needs an owner and a business-aware severity policy.
Measure detection quality, not notification volume
Mean-time-to-detect is often the most revealing reliability measure because teams can only resolve an issue after they know it exists. One 2026 industry study reported that data teams averaged 67 incidents per month, with 68% needing 4+ hours to detect issues and an average of 15 hours to resolve them, according to Integrate.io's survey coverage. The operational implication is clear: reducing detection delay may create more value than adding another dashboard.
Track noisy alerts that required no action, alerts with no assigned owner, repeated alerts for one root cause, and incidents discovered by business users first. Then tune thresholds, consolidate related signals, and remove checks that don't change a decision.
A focused data quality dashboard should help responders see trends and unresolved incidents, not merely display a large inventory of checks. The strongest observability program is not the one with the most alerts. It's the one engineers believe enough to act on.
Implementing Observability in Regulated and On-Premises Environments
A SaaS-first design often assumes that metadata and samples can move freely to an external service. That assumption fails in financial services, healthcare, telecommunications, and public sector environments where data residency, auditability, access control, and security review shape every architectural decision.
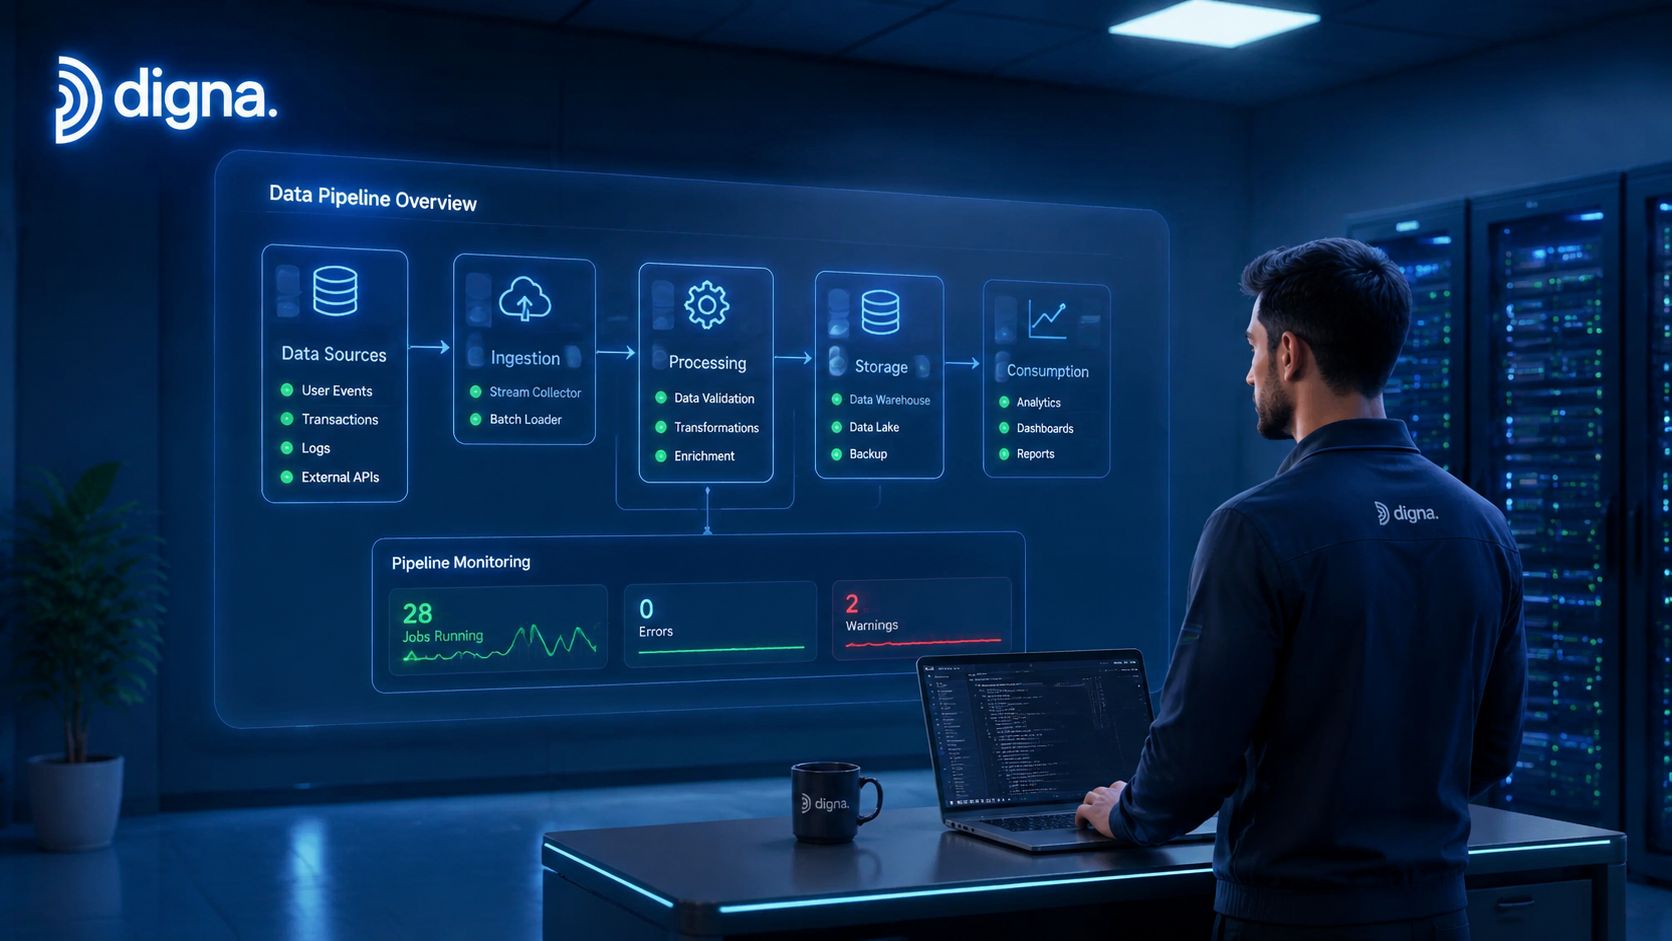
The implementation pattern I trust in these environments keeps production data inside the customer boundary. In-database execution computes metrics where the data already lives, while the observability layer receives permitted metadata, metric results, and incident context instead of unrestricted production records.
A deployment sequence that survives security review
Start with the data-flow diagram. Document where checks execute, what leaves the database, which service account runs them, and where results are stored. Security teams can review a specific flow more effectively than a promise that a product is “secure.”
Separate metric computation from investigation data. Row counts, freshness timestamps, schema fingerprints, and aggregate quality metrics may be sufficient for detection. Record-level samples should be optional, masked, or prohibited where policy requires it.
Use private deployment boundaries. A private cloud or on-premises installation can run inside the customer's VPC, cloud account, or data center. Keep connectors, schedulers, metadata stores, and user interfaces within approved network zones.
Make audit evidence part of the design. Store check definitions, execution times, observed results, acknowledgements, ownership changes, and remediation history. Auditors usually need to establish what was checked, when it ran, what happened, and who responded.
Teams should also document residency decisions explicitly. The data residency requirements guide is a useful reference when deciding which metadata may cross regional or organizational boundaries.
Heterogeneous estates need a common contract
Legacy databases, warehouse platforms, lake storage, Kafka topics, and transformation tools rarely expose identical metadata. Standardize the observability output rather than forcing every source into the same instrumentation method. Each integration should publish asset identity, update time, volume or completeness result, schema state, check status, owner, and lineage references.
Least-privilege service accounts, read-only access where possible, masked identifiers, and separate credentials per environment reduce the blast radius of the monitoring system itself. Test the deployment against backup, failover, and disconnected-network scenarios before production rollout.
The trade-off is real. In-database checks may consume warehouse resources, while external scanning may simplify onboarding but create governance friction. Measure query cost, schedule expensive profiling away from peak workloads, and use lightweight metadata checks continuously with deeper validation on critical assets.
Choosing the Right Alerting Strategy for Your Data Stack
Alerting strategy should follow data behavior, not tool fashion. Static thresholds are easy to explain and audit. Statistical baselines adapt to normal variation. Machine learning can reduce manual rule creation, but it introduces model behavior that compliance and platform teams may want to inspect. Deterministic validation remains essential wherever a business rule must be enforced exactly.
Strategy | Best For | Limitations | Implementation Complexity |
|---|---|---|---|
Static thresholds | Predictable counts, hard limits, contractual delivery windows | Break under seasonality, growth, and gradual drift | Low |
Statistical baselines | Dataset-specific volume, freshness, and distribution behavior | Need sufficient historical context and careful tuning | Medium |
Machine learning anomaly detection | Complex patterns, changing behavior, and broad coverage | Requires explainability, governance, and review of false positives | Medium to high |
Deterministic record validation | Regulatory controls, business rules, and exact row-level requirements | Can't identify unknown patterns without defined rules | Medium |
When simple rules win
Use a static rule when the failure condition is unambiguous. A required partition that hasn't arrived, a prohibited datatype, or a field that must satisfy a defined business constraint should produce a deterministic result. These checks are easier to test, explain to auditors, and reproduce during incident review.
Static thresholds also work well for stable high-volume feeds with clear operational limits. They become fragile when normal behavior changes by hour, season, customer segment, or product lifecycle. A single global threshold often creates false positives during legitimate peaks and misses slow degradation.
When adaptive methods help
Statistical baselines are useful when each dataset has its own rhythm. Compare like with like, such as the same hour or delivery window, and preserve the historical context that led to the alert. Machine learning can extend this approach across many assets, but engineers should still require a reason code, baseline visualization, and an override process.
The most defensible design combines methods. Use anomaly detection for broad coverage of freshness, volume, and distributions. Add deterministic checks for regulatory fields, contractual requirements, and business-critical record logic. Route both through the same incident workflow so responders don't have to reconcile separate alert systems.
A monitoring and reporting layer should expose not only whether a check failed, but also its trend, owner, severity, and downstream relevance. digna's monitoring and reporting capabilities represent one example of that combined operating model, alongside tools built around dbt tests, warehouse assertions, or custom orchestration checks.
Integrating Observability into Your Existing Pipeline Architecture
Observability shouldn't require a rebuild. The safest pattern adds measurement at boundaries that already exist, then sends results to a shared incident and metadata workflow without blocking every task on every check.

In Airflow, emit execution and completion metadata from DAG tasks, then run freshness and completeness checks after the target partition is committed. In dbt, retain test results and model timing as first-class observability events. Spark jobs can publish input and output counts, rejected-record counts, schema fingerprints, and partition details. Kafka consumers should expose lag, event-time delay, malformed-record rates, and topic-level volume behavior.
Put checks where they answer a question
Use synchronous checks when continuing would create unacceptable downstream risk. A schema conformity check before publishing a shared contract or a completeness check before releasing a regulatory dataset may reasonably block the next stage.
Use asynchronous checks for broader profiling and trend analysis. Distribution metrics, column statistics, and historical comparisons can run beside the critical path, provided the resulting alert has a clear containment process. This avoids turning every analytical check into a pipeline bottleneck.
Schema handling deserves an explicit policy. Classify added columns, removed columns, and datatype changes as compatible, review-required, or breaking. Don't automatically fail every additive change, but don't accept a datatype modification without review, as it can change how downstream consumers interpret values.
Lineage should be captured at transformation boundaries, not reconstructed during an incident. Store source-to-target relationships for Airflow tasks, dbt models, Spark transformations, and streaming topics, then attach checks to the assets they describe.
Design principle: Observability should make the pipeline easier to operate, not become another dependency that can stop it unnecessarily.
Finally, use observability results to improve architecture. Repeated freshness delays may expose an overloaded extraction window. Persistent volume anomalies may point to weak source contracts. A pattern of schema incidents may justify versioned interfaces rather than more alerts.
Starting Small and Scaling Your Observability Implementation
Monitoring everything on the first day creates a catalog of checks before the team knows which signals matter. Start with one critical pipeline, preferably an asset that feeds executive reporting, customer operations, regulatory work, or a production model. Rank candidates by business impact, incident history, dependency depth, and the difficulty of detecting failure manually.
A phased rollout is easier to defend because each phase produces operational evidence.
Days 1–30: Map the selected pipeline, identify owners and downstream consumers, establish freshness, job success, completeness, and schema SLIs, and record the baseline.
Days 31–60: Add distribution or record-level validation where the first phase reveals risk. Tune warning and critical thresholds, route alerts to accountable teams, and document the response workflow.
Days 61–90: Review incidents and near-misses, remove noisy checks, add lineage context, measure mean-time-to-detect, and select the next pipeline based on demonstrated risk rather than enthusiasm.
Measure outcomes that change engineering decisions. Mean-time-to-detect shows whether the team learns about failures earlier. Incident volume and repeated root causes reveal whether monitoring is reducing operational burden. Prevented downstream failures demonstrate value to analysts, compliance stakeholders, and business owners.
Adoption also depends on ownership. Assign each critical dataset a technical owner, define who can acknowledge or suppress an alert, and require a reason when a check is disabled. Review false positives after incidents, not just during an annual tooling exercise.
digna can support this phased model with in-database execution, private cloud or on-premises deployment, anomaly detection, timeliness monitoring, record-level validation, and schema tracking. If your environment cannot move production data to a SaaS platform, evaluate whether the architecture preserves that boundary while still giving engineers usable incident context.
Use the first 90 days to instrument one business-critical pipeline, establish trustworthy baselines, and measure detection quality before expanding coverage. To evaluate an in-environment approach for your warehouses, lakes, and regulated data flows, visit digna and explore how its modular observability platform can fit your existing architecture.
Frequently asked questions
What does observability add to pipeline monitoring?
Inspection of the data itself. Pipeline monitoring still matters, because it tells you whether jobs ran and infrastructure held, but it cannot tell you that a batch finished green while the dashboard it feeds is already wrong.
What are the five pillars?
Freshness, distribution, schema, lineage and volume. Freshness shows whether data arrived within its expected schedule, volume compares the amount against normal behavior, schema tracks columns and types, distribution looks at null patterns, ranges and uniqueness, and lineage connects an incident to the assets and teams affected.
How is observability different from data quality rules?
They solve related but different problems. Rules encode conditions someone already knew to write down; observability describes behavior nobody specified in advance, which is why a team that has only one of the two keeps being surprised in a predictable direction.
What does a failing pipeline that did not fail look like?
An orchestration dashboard showing a successful overnight job at 9:00 a.m. while the data it produced is wrong. The pipeline did not fail in the conventional sense, which is exactly why job-status monitoring reported success.
Where should an engineer start?
With the datasets whose behavior would be hardest to reconstruct after the fact. Instrumenting those first gives the lineage and history that turn the next incident into a short investigation rather than an archaeology exercise.



