Data Design Pattern Guide for Modern Teams
|
8
min read

Your team has a warehouse, a streaming pipeline, and dashboards that disagree about the same customer metric. One analyst trusts the finance table, another trusts a departmental mart, and a third has added a filter to make yesterday's report reconcile. The problem isn't necessarily the database technology. It's that nobody agreed on the data design pattern, the rules that determine how information is shaped, governed, and checked after it goes live.
A useful pattern does more than produce an attractive architecture diagram. It gives engineers a repeatable way to capture data, connect related facts, serve different workloads, and expose failure before users make decisions from bad information. The strongest patterns also make ownership explicit, define acceptable change, and preserve evidence about what the system knew at a particular point in time.
Table of Contents
What a Data Design Pattern Actually Means
Teams usually reach for a pattern after the first painful disagreement. A pipeline works for one department, then another team needs the same data with a different definition, delivery schedule, or history. Engineers begin adding exceptions. Analysts create duplicate transformations. Eventually, the organisation has several answers to a question that should have one answer.
Think of a data design pattern as a kitchen recipe. The recipe doesn't dictate the brand of oven or the colour of the plates. It specifies the ingredients, the order of preparation, the relationships between components, and the checks that tell the cook whether the result is safe to serve. A data pattern does the same for information systems.

Structure is only the first layer
A pattern is a reusable response to a recurring design problem. It might organise analytical facts and dimensions, preserve every business event, centralise shared definitions, or let domains publish data products under common standards. The pattern gives a team a vocabulary for making decisions before implementation details take over.
An architecture diagram shows components and connections. A pattern goes further by explaining why those components exist and how they behave under change. Two diagrams can look similar while producing very different outcomes if one defines ownership, history, and validation and the other leaves those questions unanswered.
A practical pattern answers three questions:
How is the data shaped? Identify entities, events, relationships, grain, keys, history, and serving models.
How is the data governed? Define ownership, naming, business meaning, access, lineage, and compatibility rules.
How does failure become visible? Specify freshness expectations, validation checks, schema monitoring, anomaly thresholds, and escalation.
Practical rule: If a pattern doesn't explain what happens when a load is late or a field changes type, it's a structural sketch, not an operational design.
This distinction matters before you choose a warehouse, lakehouse, message broker, or orchestration tool. Technology can implement a pattern, but it can't decide whether a customer's address history belongs in an immutable event stream, a current-state table, or both. The team must make that decision first, then encode it consistently.
How Enterprise Data Warehousing Gave Us the First Patterns
In the late 1980s, enterprises were trying to turn information scattered across operational systems into something leaders could use for analysis. An IBM Systems Journal article published in 1988 used the phrase “business data warehouse,” an important milestone in formalising the idea of integrating information from multiple operational systems for business analysis. William Inmon later developed the enterprise-oriented warehouse pattern and published Building the Data Warehouse in 1992.
Consider a healthcare organisation trying to answer a straightforward question: how much did each department spend on a patient episode? The source systems might record appointments, claims, payments, and provider information separately. Under Inmon's approach, the organisation first brings detailed, historical, integrated data into a central enterprise warehouse. The integration layer reduces inconsistent definitions before downstream teams receive subject-specific subsets. Inmon's pattern generally uses normalised relational structures, which support traceability and reduce redundancy at the shared layer.
That approach treats the warehouse as the organisation's carefully managed ledger of meaning. A finance team and a clinical operations team may still receive different views, but both inherit the same governed foundations.
Ralph Kimball's dimensional approach starts from a different question: what business process must users analyse? His method, formalised through The Data Warehouse Toolkit, first published in 1996, popularised fact tables, dimension tables, star schemas, and conformed dimensions. The healthcare team might build a claims fact table connected to patient, provider, department, payer, and time dimensions. Analysts can query the business process directly without navigating a highly normalised enterprise model.
Most organisations blend the two philosophies. They keep a canonical or integrated layer for shared meaning, lineage, and governance, then publish dimensional marts for reporting and KPI analysis. That hybrid is still visible in modern enterprise data warehouse architectures, even when the underlying infrastructure is a cloud warehouse or lakehouse.
The enduring lesson is simple. Where truth lives and how truth is consumed are related decisions, but they aren't the same decision.
Dimensional Modeling in Practice
A sales team rarely asks, “Can I explore your normalized relational model?” It asks, “How much did we sell, to whom, through which store, and during what period?” Dimensional modelling works well because it organises data around those business questions.
Start with a measurable event, such as an order line. The fact table stores the event's numeric and operational details, including quantity, revenue, discount, order timestamp, product key, customer key, and store key. The dimension tables provide the descriptive context that makes each row useful. Product describes the item, customer describes the buyer, store describes the location, and time supplies calendar and reporting attributes.
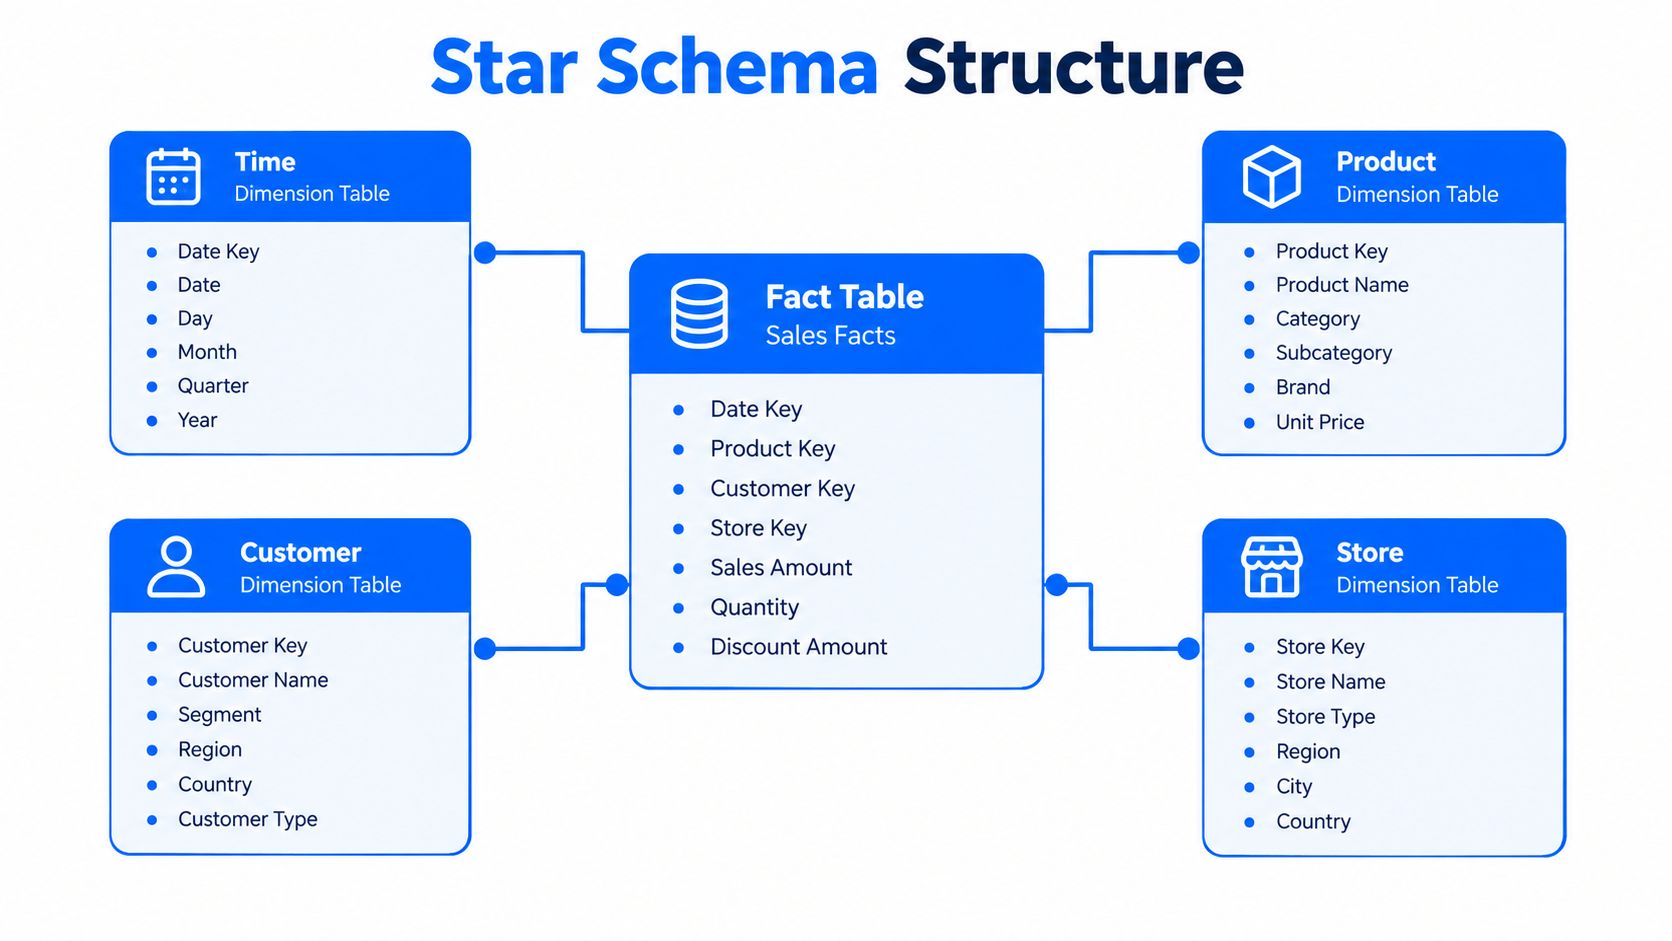
Grain comes before columns
Before adding fields, state the grain in one sentence: “One row represents one product on one order.” That sentence prevents a common failure, mixing order-level and line-level values in the same fact table. If revenue is repeated across several product rows, a simple sum can overstate sales.
A conformed dimension uses the same business definition across marts. If the customer dimension means “bill-to customer” in finance but “end user” in product analytics, the shared name creates false consistency. Teams must define the meaning, keys, history, and valid relationships, then make those rules available to every consumer. Guidance on fact and dimension tables can help teams establish this vocabulary before they build reports.
Historical accuracy creates another design choice. Suppose a customer changes segment from small business to enterprise. A current-state dimension will show the latest segment, but a historical sales report may need the segment that applied when each order occurred. Slowly changing dimension techniques preserve the appropriate history, depending on whether the business wants to retain previous values, overwrite them, or record effective periods.
Where the pattern earns its place
Dimensional modelling pays off when the dominant questions involve how much, how often, where, when, or by whom. Star schemas are approachable for analysts, support predictable joins, and make KPI logic easier to share. A stable fact-dimension contract also gives quality teams clear places to check referential integrity, null rates, duplicate keys, and unexpected measures.
The pattern strains when the workload depends on irregular documents, high-volume unstructured events, or audit-grade reconstruction of every state change. It can represent those inputs, but forcing every problem into a star schema often hides the original event history. Many mature platforms therefore retain raw or canonical records and expose dimensional marts as a serving layer.
Event Sourcing and Append-Only Thinking
A bank balance looks like a current-state value, but reconciliation depends on the history behind it. If a balance is changed incorrectly and the system stores only the latest number, investigators have no reliable way to reconstruct how it was produced.
Event sourcing takes the opposite approach. Instead of updating a balance row in place, the system records events such as a deposit, withdrawal, transfer, or correction. The current balance becomes a projection calculated from that ordered history.

From events to usable state
The pattern has three practical parts:
Append-only event store: Each business change is recorded as a new event. Existing events aren't overwritten.
Projection: A consumer reads events and builds a queryable representation, such as the current account balance.
Replay and correction: If the projection logic changes or state becomes corrupted, the team can rebuild it from the event history.
A correction doesn't erase the original transaction. It adds a compensating event that preserves the chronology. That makes the system useful for audit, debugging, historical analysis, and reproducing incidents.
The read model may not update at exactly the same moment as the event log. Teams must therefore accept and communicate eventual consistency where it fits the business process. They also need event versioning, idempotent consumers, ordering rules, retention decisions, and a strategy for snapshots when replaying a long history becomes expensive.
Choose it for traceability, not fashion
Event sourcing is a strong foundation when the business must answer, “What happened, in what order, and why does the current state look this way?” Financial ledgers, workflow histories, inventory movements, and distributed domain events are natural candidates.
It's a poor default for every CRUD application. Reads become more complex because users often need a projection rather than the source log. Teams must maintain projection code and handle delayed convergence. A conventional current-state table may be clearer when the business only needs the latest value and doesn't require a reconstructable history.
Lakehouse teams may combine event-oriented ingestion with an open table format and materialized serving models. The open table format overview provides useful context for separating durable data history from the models that consumers query.
The event log is the evidence. The projection is the convenient interpretation.
Canonical Models Versus Domain Ownership
A canonical model says the organisation should agree on shared definitions at an integration layer. A domain-owned model says the team closest to a business capability should publish a usable data product and take responsibility for its quality.
Neither position solves every problem. A central model can prevent conflicting definitions, but a central team can become a queue for every change. A domain model can move decisions closer to the source, but separate teams may publish incompatible meanings for “customer,” “active account,” or “completed order.”
Dimension | Canonical Model | Data Mesh |
|---|---|---|
Ownership | A central data or integration team stewards shared definitions | Domain teams own the data products created from their business capabilities |
Governance | Consistent enterprise rules are easier to enforce centrally | Federated standards coordinate teams without removing domain responsibility |
Delivery speed | Cross-domain changes may require central review and alignment | Domains can iterate faster within shared interoperability rules |
Risk | The central team can become a bottleneck or distant from source context | Definitions, quality, and interfaces can diverge without strong contracts |
The canonical case
Canonical models suit organisations that need a common regulatory vocabulary, shared financial controls, or traceability across departments. The integration layer acts like a dictionary. It resolves source-system differences before analysts and applications consume the data.
The cost is coordination. A central team must understand many domains, manage change requests, and keep the model relevant as the business evolves. If it becomes the only group allowed to publish useful data, delivery slows and domain experts lose ownership.
The domain case
Data mesh assigns ownership to domains such as billing, logistics, or customer support. Each domain publishes data as a product, with documentation, quality expectations, access controls, and a service commitment. A federated governance layer still defines shared rules for interoperability, security, and discovery.
This works only when domain teams have the skills and capacity to operate data products. The organisation must provide common tooling and enforce contracts, or decentralisation becomes duplicated pipelines with different assumptions. Teams working through domain boundaries may also benefit from this guide on modeling aggregates for SaaS, especially when business ownership and system boundaries need to align.
A practical compromise keeps a canonical layer for high-risk shared concepts and lets domains publish specialised products around it. Federated data governance can support that balance by defining what must be consistent everywhere and what domains may adapt locally.
Comparing the Three Core Patterns Side by Side
The three patterns solve different primary problems. Dimensional modelling optimises analytical navigation. Event sourcing preserves a sequence of changes. Canonical modelling establishes shared meaning across systems and teams.
Their differences become clearer when you judge them against the workload rather than against personal preference.
Criterion | Dimensional modelling | Event sourcing | Canonical model |
|---|---|---|---|
Query performance | Strong for repeated BI queries and aggregations | Often requires projections or snapshots for convenient reads | Depends on the serving layer, normalised structures may need downstream models |
Governance fit | Clear metric and dimension contracts | Strong history and traceability, with more event-management discipline | Strongest for central definitions, lineage, and regulated shared data |
AI-readiness | Useful for curated features and labelled business metrics | Valuable for replay, temporal features, and behavioural histories | Useful for consistent features and shared semantics across domains |
Operational cost | Moderate, with modelling and historical-dimension maintenance | Higher, because logs, projections, versioning, and replay must be operated | Higher coordination cost, especially when many domains depend on central changes |
Best starting question | “What should users aggregate and compare?” | “What sequence produced this state?” | “Which definition must every system share?” |
The table doesn't identify a universal winner because a real platform often needs all three. A canonical layer can establish shared customer, product, and financial definitions. Dimensional marts can turn those definitions into accessible reporting models. Event logs can preserve the evidence needed to replay or audit important changes.
Diagnose the dominant workload
Ask the team what failure would hurt most:
A slow or confusing report: Start with dimensional modelling and define the grain of each fact.
An untraceable state change: Preserve events and build projections from the append-only history.
Conflicting enterprise definitions: Establish canonical concepts, ownership, and change control.
AI inputs that drift without warning: Add behavioural monitoring and ownership to whichever structural pattern you choose.
AI readiness isn't just a storage question. Embeddings, feature distributions, retrieval results, and model-input timeliness can change while the table schema remains valid. A pattern that governs only columns can miss semantic failure.
Why a Clean Diagram Is Not Enough
A whiteboard can show a polished flow from source systems to a warehouse, mart, dashboard, and model. It can't show who receives the alert when yesterday's file arrives late, which rule validates a claim amount, or how an auditor proves that a report used the correct data at a historical point.
That gap turns architecture into operational risk. A reliable pattern defines the expected delivery behaviour, validation location, ownership, compatibility policy, and evidence retained after each important load.
Put trust controls beside data movement
A team choosing a pattern should specify controls at three points:
Ingestion: Check arrival, volume, basic structure, duplicates, and required fields.
Transformation: Validate business rules, relationships, accepted values, and reconciliation logic.
Consumption: Monitor KPI behaviour, freshness visible to users, downstream failures, and model-input suitability.
Schema evolution needs the same treatment. Additive nullable fields may be compatible with existing consumers, while type narrowing or semantic renaming can break them. Partition layouts should remain an implementation concern wherever possible, so consumers query logical tables rather than hard-coded directory paths. Metadata-driven evolution, as documented in Apache Iceberg's design guidance, lets physical layouts change while historical files retain their original specifications.
Evidence changes the standard
More than 56% of analytics-engineering survey respondents identified data quality as the most frequently reported challenge, while 38% planned to increase investment in data quality or observability in the following year, according to dbt's State of Analytics Engineering 2025. Those figures support a practical conclusion: governance and observability belong in the pattern, not in a later operations backlog.
A trustworthy design makes bad data easier to find, explain, contain, and correct.
For each critical dataset, record the owner, expected delivery behaviour, schema version, validation results, lineage, and incident history. Then define what happens when a check fails. Does the pipeline stop, quarantine records, publish a warning, or continue with an explicit degraded status? The right answer depends on the business impact, but leaving the answer unspecified guarantees inconsistent responses.
Choosing and Operationalising Your Pattern
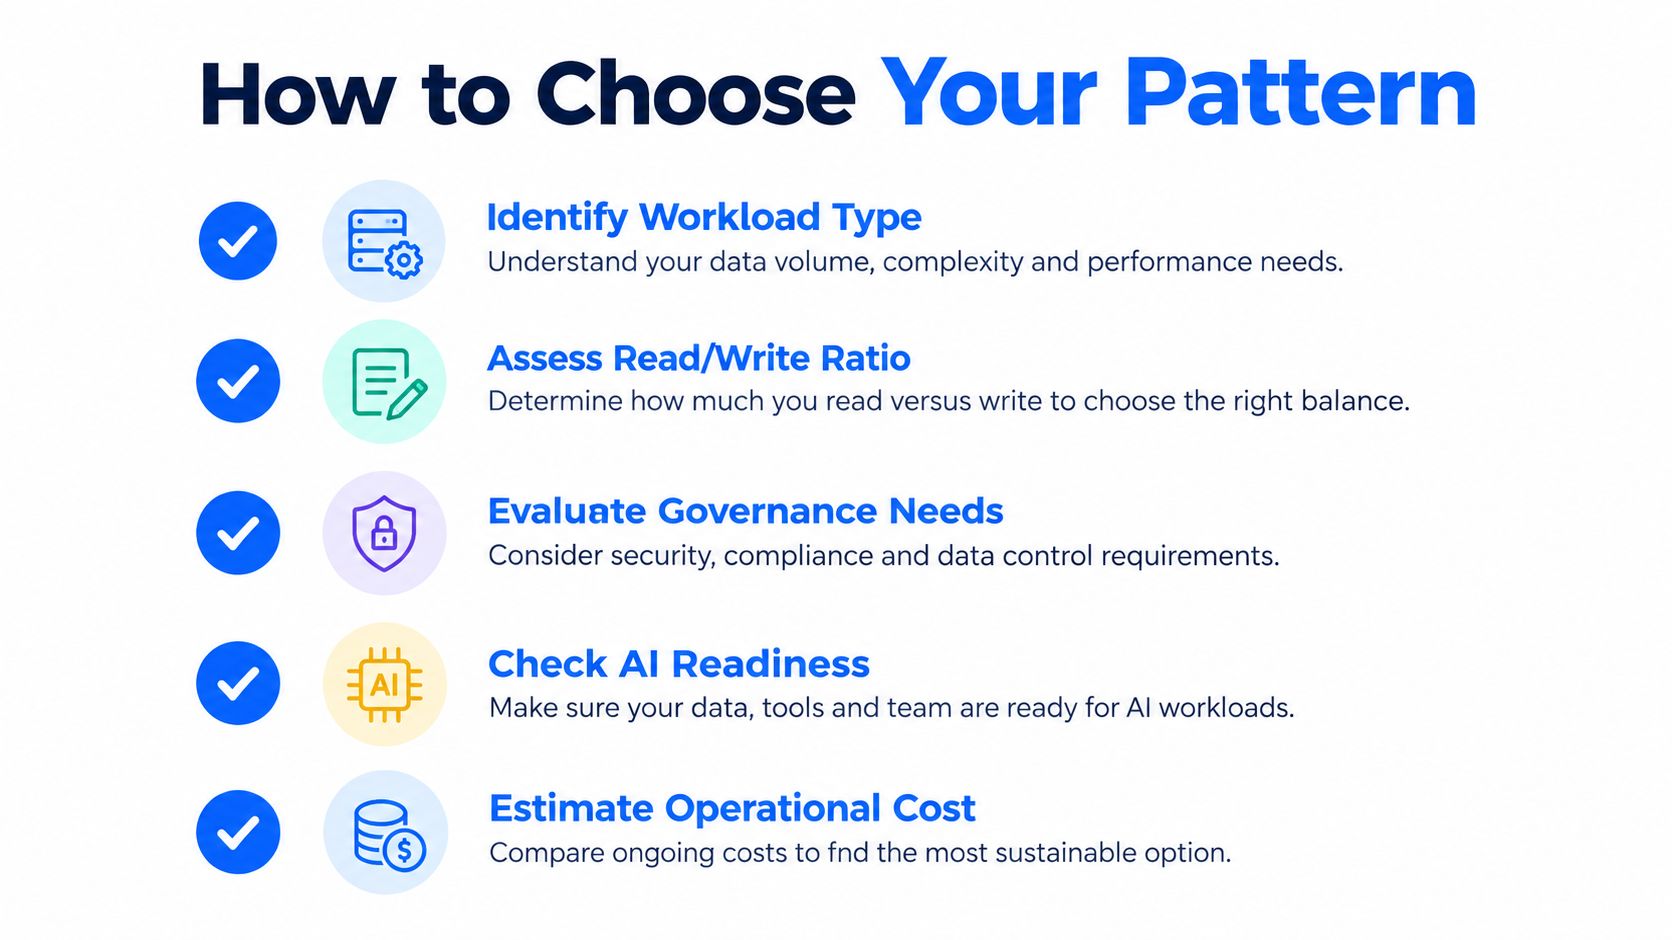
Run a short design review and write down five decisions:
Identify the dominant workload. Reporting, audit, operational serving, real-time reaction, and AI feature generation need different structures.
Choose the primary pattern. Select the model that solves the most important problem, then add supporting layers deliberately.
Define contracts. State grain, keys, meanings, freshness expectations, schema compatibility, and ownership.
Attach controls. Add arrival monitoring, record validation, anomaly detection, schema-drift alerts, lineage, and historical evidence.
Test failure behaviour. Simulate late data, unexpected values, structural changes, duplicate events, and projection rebuilds.
For AI workloads, extend the checklist beyond columns. Decide how the team will detect embedding drift, feature-distribution change, retrieval degradation, and stale model inputs. A technically valid table can still produce an unreliable model if its behaviour changes without an accountable owner.
A platform such as digna's data product management approach can fit this operational layer by combining in-database validation, timeliness monitoring, anomaly detection, and schema-change tracking inside the customer environment. The important decision isn't the tool alone. It's whether the pattern gives named people enough evidence to act when the data stops behaving as expected.
digna helps teams monitor data behaviour inside their own environment through in-database validation, timeliness monitoring, anomaly detection, and schema-change tracking. If you're turning a static architecture diagram into an operational trust contract, visit digna to see how the platform can support that work.
Because type narrowing or a semantic rename can break consumers while every pipeline still runs, digna's Schema Tracker records structural changes in monitored tables so the compatibility policy in your pattern has an alert behind it.
Frequently asked questions
What is a data design pattern?
A data design pattern is a reusable answer to a recurring data problem that covers three things: how data is shaped, how it is governed, and how failure becomes visible. Like a recipe, it defines ingredients, order and checks, not the oven brand, so it guides decisions before you pick any warehouse or tool.
What is the difference between the Inmon and Kimball approaches?
Inmon starts with a central, normalised enterprise warehouse that integrates detailed history before teams get subject-specific subsets. Kimball starts from the business process, building fact tables, dimension tables and star schemas for direct analysis. Most organisations blend both, keeping an integrated layer for shared meaning and publishing dimensional marts for reporting.
Why should you define the grain of a fact table first?
Stating the grain, such as one row per product on one order, prevents mixing order-level and line-level values in the same table. Without it, revenue repeated across several product rows gets summed multiple times and overstates sales. The grain sentence should be written before any columns are added.
When should you use event sourcing instead of a current-state table?
Use event sourcing when the business must explain what happened, in what order, and why the current state looks the way it does. Financial ledgers, workflow histories and inventory movements fit well. For CRUD apps needing only the latest value, a plain table is clearer, since projections and eventual consistency add real operating cost.
Should a data platform use a canonical model or data mesh?
Often both. A practical compromise keeps a canonical layer for high-risk shared concepts like customer, product and financial definitions, while domain teams publish specialised data products around it. Federated governance then decides what must be consistent everywhere and what domains may adapt locally, avoiding both a central bottleneck and diverging definitions.


