10 Data Testing Tools for Reliable Data Workflows
|
10
min read

The most popular advice about data testing tools is also the least useful: pick the platform with the longest feature list. That approach ignores the failure you need to catch. A deterministic rule can prove that a key is unique, but it won't necessarily detect an unusual distribution. An anomaly detector can flag an unexpected shift, but it may not prove that a regulatory field follows an exact business rule. A lineage platform can show who is affected, while a diffing tool can tell you precisely what changed after a code update.
The practical choice is to separate deterministic testing, anomaly detection, observability, regression diffing, and Spark-scale validation. Then compare each tool by its deployment boundary, setup effort, workflow integration, coverage, maintenance burden, and limitations. Teams evaluating property records, for example, still need a broader process to ensure accuracy in real estate data, not just a dashboard of alerts.
The list below compares tools by the workflow they support. digna is included for teams that need in-environment, in-database monitoring and enterprise control, but it isn't the universal winner. The right choice depends on whether your team is preventing bad releases, monitoring live data behavior, validating Spark workloads, or protecting sensitive production data.
Table of Contents
1. digna
digna is an enterprise-grade, sovereign-by-design data quality and observability platform for teams that can't move production data into an external service. It runs inside a customer's private cloud, VPC, or on-premises environment, and its checks execute in-database. That boundary matters in finance, healthcare, telecom, and public-sector environments where copying sensitive records into a SaaS platform can create security, privacy, and governance complications.
The platform combines AI-driven baseline learning with statistical methods. It can detect unusual data behavior, monitor timeliness, validate records against business rules, track schema changes, and provide historical analytics. The modular design lets a team begin with anomalies or timeliness, then add validation, schema tracking, or analytics as operational needs become clearer. Included scheduling, catalog, integrations, and collaboration features reduce the need to assemble a separate operating layer.
Deployment rule: If production data must remain inside your infrastructure, treat that requirement as an architectural constraint before comparing feature lists.
digna's Data Validation module supports record-level checks for required fields, formats, ranges, reference lists, cross-field conditions, and referential or business constraints. Its in-database approach also reduces unnecessary data movement and gives governance teams a clearer control boundary. The platform describes a rapid path from installation to initial insights, with first insights available in under two hours, although production rollout still requires internal infrastructure, access, and ownership decisions.
See how digna handles data quality observability when the same environment needs continuous monitoring and rule-based controls.
The main trade-off is operational responsibility. Private deployment gives the customer control, but the customer also owns capacity planning, updates, and infrastructure support. Licensing uses a base fee plus per-active-table, per-module pricing, so teams should model table scope before committing. It fits organizations that value sovereignty and traceability more than a completely hands-off SaaS experience.

2. Great Expectations
Great Expectations, commonly called GX, is a testing-first library. Engineers define declarative checks called Expectations, group them into suites, and run validations against warehouses, lakes, files, and other supported backends. The workflow feels closer to software testing than to passive monitoring. You write down what should be true, run it in development or CI/CD, and retain the result as an auditable artifact.
The library is strongest when a data team wants tests versioned with code and explained in a human-readable format. Data Docs turn validation results into reports that analysts, engineers, and auditors can review. Python and CLI interfaces make GX flexible across orchestration systems, although that flexibility comes with engineering work.
Where GX fits best
GX works well for teams that need custom checks beyond a platform's standard rules. A suite might combine uniqueness, acceptable values, null handling, range constraints, and custom Python logic. Teams can run those checks before publishing a model, after a load, or as part of a release pipeline. Its open-source model avoids license fees and gives engineers control over the test layer.
The limitation is maintenance. Someone must design suites, update expectations when schemas or business logic change, manage execution, and decide which failures should block a workflow. GX also isn't a substitute for full observability. It can validate stated expectations, but teams may need another system for broad lineage, consumption context, and continuously learned behavior.
GX Core remains the relevant open-source option. GX Cloud was discontinued after an acquisition in mid-2026, so buyers shouldn't plan around a future hosted GUI from Great Expectations. Teams considering the library should therefore assess their ability to operate the surrounding workflow themselves. digna's approach to data validation rules and continuous quality is a useful comparison for teams that want validation with an operational monitoring layer.
3. Soda
Soda sits between a developer-oriented testing framework and a managed observability platform. Soda Core provides an open-source entry point, while Soda Cloud adds collaboration, scheduling, anomaly detection, data contracts, and incident workflows. That split lets teams embed checks in pipelines before deciding whether they need a broader hosted control plane.
The basic workflow is YAML-driven. Engineers define checks for conditions such as freshness, completeness, uniqueness, or accepted values, then run them through Soda's agent model inside their environment. This is approachable for teams that prefer readable configuration over extensive Python code. Data Contracts give the team a way to express expectations between producers and consumers, which can improve accountability across platform boundaries.
The practical trade-off
Soda Core is useful when the immediate problem is getting repeatable checks into ingestion or transformation workflows. Soda Cloud becomes more relevant when teams need a shared UI, anomaly diagnostics, scheduling, and collaboration beyond the engineering group. The distinction matters because advanced capability depends on the managed product, and its commercial evaluation is sales-led.
The contract model also requires organizational agreement. A contract that nobody owns becomes another configuration file that slowly loses relevance. Teams need to decide who defines the rule, who receives the alert, and whether a violation blocks publication or creates a warning.
Soda's AI-assisted rule and contract generation may reduce setup effort, but generated checks still need review. Automated suggestions can accelerate coverage, yet they can't decide whether a business metric is allowed to change during a campaign, acquisition, or reporting period.
Teams comparing deployment models can also review Soda alternatives for data quality workflows, particularly when checks must remain close to the database.

4. Monte Carlo
Monte Carlo is built for end-to-end data observability, not only for writing explicit assertions. It monitors freshness, volume, schema, and distribution signals, then combines anomaly detection with lineage so teams can investigate likely impact. That makes it a strong fit for a large data platform where an incident may affect many dashboards, models, or downstream consumers.
The important workflow is triage. A freshness alert alone tells you that something is late. Lineage can help answer which assets depend on the affected table, which teams consume them, and where the investigation should start. Column-level context can also narrow the blast radius when only part of a dataset changes.
What it doesn't replace
Monte Carlo won't replace a code-led test suite for every business rule. A rule such as “a transaction must reference an approved account” needs an explicit validation approach. Observability tells you that behavior changed or a pipeline is unhealthy, but it doesn't automatically encode every domain constraint.
The platform's broad scope can also be excessive for a small team with a handful of dbt models and a clear CI process. Pricing is sales-led, with limited public self-serve pricing information, so an evaluation should include monitored table scope, retention, integrations, and expected alert volume. Ask for a realistic proof of value using the incidents your team has experienced, not only a vendor demonstration.
Monte Carlo is most compelling when lineage-driven impact analysis and anomaly detection matter as much as test execution. It becomes less compelling when the team mainly needs deterministic checks in pull requests or a lightweight validation library.

Teams should distinguish Monte Carlo's observability workflow from Monte Carlo simulation, which is a different analytical concept. The comparison with Monte Carlo simulation helps keep those use cases separate.
5. Bigeye
Bigeye treats data quality as a set of metrics on tables and columns. That framing works well for engineering teams that want profiling, algorithmic anomaly detection, and automation hooks rather than a large collection of manually authored assertions. Its developer tooling and API-first workflows can fit environments where teams manage data operations through code, deployment pipelines, and service integrations.
The platform provides prebuilt checks, metrics as code, profiling, lineage-enabled workflows, and broad connector coverage. Business-facing lineage views help translate a technical anomaly into an operational question, such as which report or team may be affected. That can reduce the gap between engineering diagnosis and stakeholder communication.
Metrics versus rules
A metrics mental model can require onboarding for teams accustomed to rule-centric testing. Engineers need to understand which metrics deserve monitoring, how baselines behave, and when an alert represents a meaningful incident rather than normal variation. This is a different operating habit from writing a test that must pass or fail.
Bigeye's security and integration story suits enterprise environments, but pricing isn't publicly listed and packaging is sales-led. Buyers should request clarity on monitored scope, deployment boundaries, support, and the work required to connect existing orchestration and incident systems.
The platform is a good fit when teams want observability to become part of developer workflows. It may be less suitable when the primary need is a small, transparent set of SQL assertions that run beside transformation code. In that case, dbt tests or another testing-first library may be easier to maintain.
6. Anomalo
Anomalo is an AI-native monitoring platform for teams that want to discover unknown data problems without writing a rule for every possible failure. Its unsupervised machine-learning checks examine values and structures across structured, semi-structured, and unstructured data. The product also covers freshness and schema behavior, with lineage context and an insights feed that explains changes and suggests actions.
That workflow is useful when a team knows that data changes unexpectedly but can't predict every failure mode. Segmentation and explainability can help separate a meaningful shift in one customer group or region from harmless movement across the full table. No-code configuration lowers the initial barrier, while APIs support integration with existing platform workflows.
Where deterministic checks still matter
Anomalo's strength is discovery. Compliance and contractual requirements still need explicit controls. If a field must be present, a value must fall within a defined range, or a record must match a reference list, a deterministic rule is easier to review and audit than an inferred baseline.
The deployment option matters for sensitive environments. Anomalo can be delivered as SaaS or deployed in a customer's VPC, but teams should confirm what data, metadata, logs, and support access cross the chosen boundary. They should also test whether the platform's explanations help engineers fix incidents or merely describe them.
Sales-led pricing means cost depends on monitored volume and scope. A pilot should include normal seasonality, sparse segments, schema changes, and known incidents. Otherwise, a team may judge the product on clean data and miss the maintenance burden that appears after adoption.
7. Datafold
Datafold addresses a narrower but important failure: what changed after a data code change? Its data-diff workflow compares rows and columns across databases or environments, helping engineers inspect the effect of migrations, refactors, and model updates. Instead of asking whether a dataset looks unusual in general, Datafold asks whether the new result differs from the old result and where.
That distinction makes it valuable in pull requests. A developer can review a proposed transformation, compare outputs, and use CI checks to block a change that produces unexpected differences. dbt integration adds model context, while production monitors extend the workflow beyond the merge.
Use diffing when the question is causal: “What did this code change alter?” Anomaly monitoring answers a different question, “What looks unusual now?”
Datafold is especially effective during warehouse migrations and large-scale refactors, where aggregate checks can miss row-level changes. It can provide high-signal evidence tied to the code review rather than generating a general stream of production alerts.
The limitation is scope. Datafold isn't a complete observability suite, so teams still need separate coverage for freshness, ongoing schema behavior, business metrics, and broad lineage. It also fits best where engineers already use an active CI culture. Without code review integration and clear ownership, diff results can become another report that nobody acts on.
A VPC deployment option supports stricter data boundary requirements, but the team should evaluate setup and query costs against the size of the comparison workload. Sales-led pricing makes a representative migration test more useful than a generic feature review.
8. dbt tests
dbt tests are the most natural choice for teams already building transformations in dbt. They live beside models, run through normal development commands, and stay in version control. The built-in generic tests cover unique, not null, accepted values, and relationships, while singular SQL tests handle more specific business conditions.
The value comes from proximity to transformation code. A developer can update a model and its tests in the same pull request. Reusable generic tests and packages such as dbt-utils and dbt-expectations expand the library without forcing the team to build every assertion from scratch.
The boundary of dbt testing
dbt tests are primarily deterministic. They can establish that a condition is true or false, but they don't provide the same breadth of adaptive anomaly detection as an observability platform. They also won't automatically explain how a late upstream load affects every downstream consumer.
Some warehouses treat declared constraints as informational rather than enforcement mechanisms. That means a passing dbt test remains important evidence, but it doesn't necessarily prevent every invalid write outside the dbt workflow. Teams should decide which checks run before publication, which fail a build, and which create an operational alert.
dbt is a strong foundation, not always a complete monitoring strategy. Add freshness checks, lineage, distribution monitoring, or incident workflows when the production environment requires them. For teams evaluating freshness specifically, digna's dbt source freshness perspective shows how timeliness can extend beyond model-level assertions.

9. Amazon Deequ and AWS Glue Data Quality
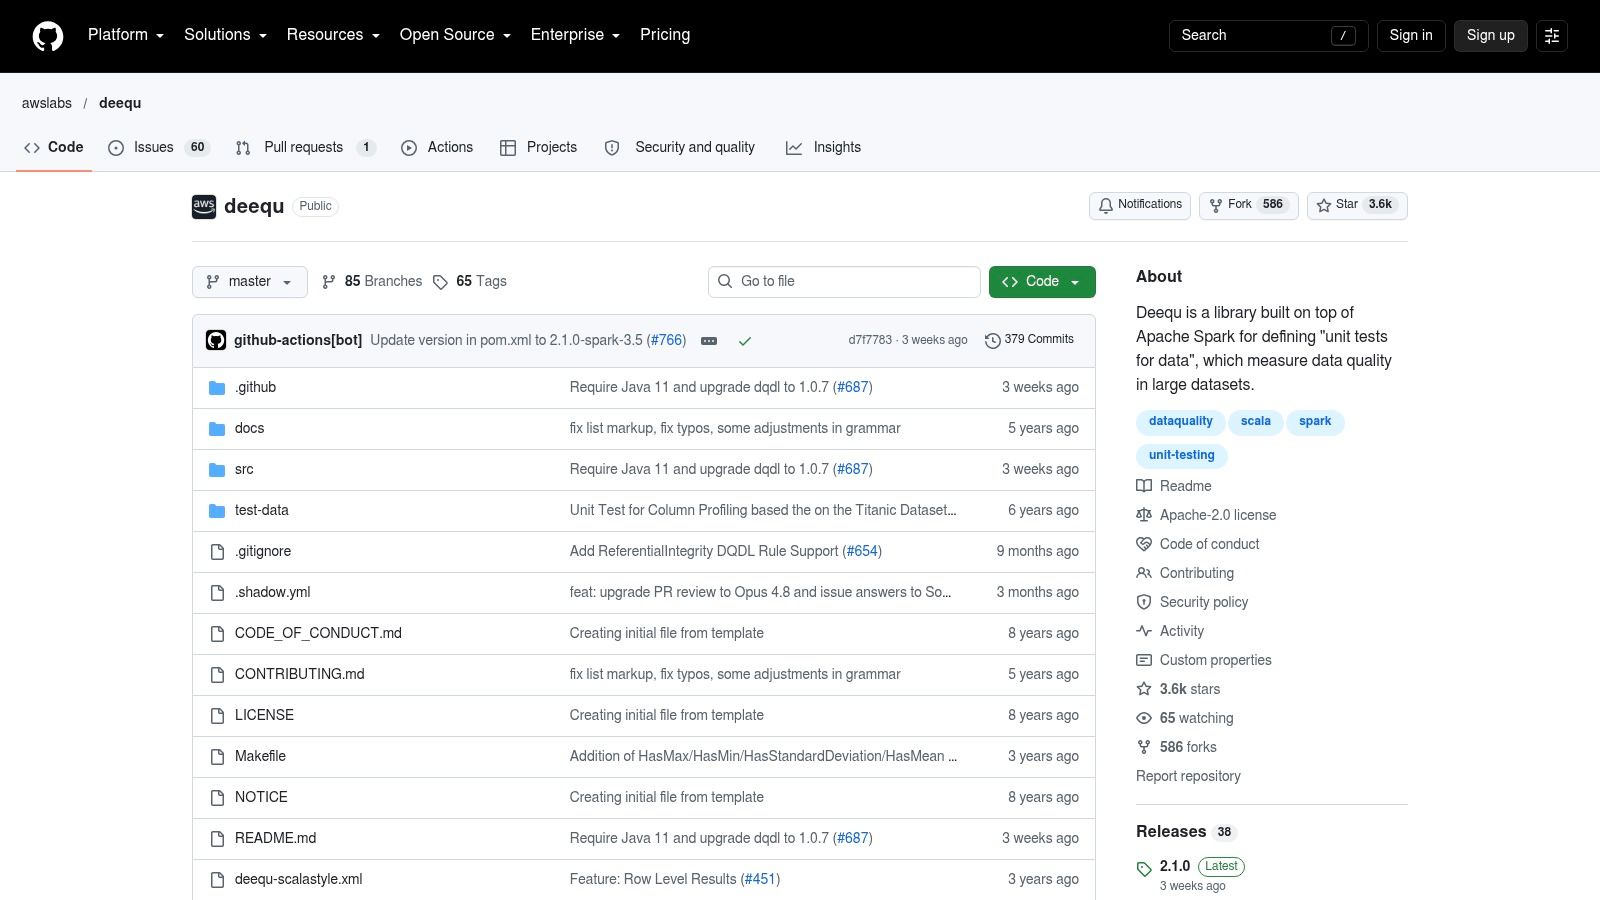
Amazon Deequ is a Spark-scale validation library from AWS Labs. It lets engineers define constraints, profile datasets, and track metrics over time. PyDeequ provides a Python-facing route, but the underlying workflow remains closely connected to Scala and Spark. AWS Glue Data Quality builds on Deequ to provide managed data-quality capabilities inside the AWS ecosystem.
Deequ makes sense when validation must run where large Spark workloads already execute. Candidate constraints can be suggested from profiles, and teams can use constraint metrics as a basis for monitoring. Optional anomaly detection on those metrics adds a statistical layer without changing the core constraint model.
Why Spark fit matters
A pure-SQL team may find Deequ harder to adopt than dbt tests or a warehouse-native library. Engineers need Spark expertise, JVM-aware operations, and a clear approach to packaging and scheduling. The open-source library also doesn't provide a managed, cross-platform user interface by itself.
AWS Glue Data Quality reduces some operating work, but it's a paid AWS service and keeps the workflow closely tied to AWS services such as Glue and EMR. That tight integration is an advantage for AWS-native teams and a limitation for organizations operating across several clouds or on-premises systems.
Deequ is a practical choice when the question is whether a large Spark dataset meets declarative constraints at scale. It isn't the default answer for warehouse-wide lineage, business-user collaboration, or in-database monitoring across heterogeneous platforms.
10. Metaplane
Metaplane targets teams that want fast, self-serve observability without starting with a large enterprise suite. It monitors freshness, volume, schema, and distribution, then uses learned baselines to alert on unusual behavior. Column-level lineage and impact analysis add context when a problem affects downstream models or dashboards.
The product's onboarding approach suits lean data teams and pilots. A free tier and usage-based pricing tied to active monitored tables make it easier to test the workflow before expanding coverage. CI checks for data changes and dbt alignment also keep the platform close to the development process.
The cost of expanding coverage
Usage-based pricing is approachable at small scope, but monitored table counts can increase as teams move from a pilot to organization-wide coverage. Buyers should model the intended table inventory, retention, alert recipients, and advanced features rather than treating the initial trial configuration as the long-term cost.
Metaplane offers less enterprise breadth than the largest observability suites. That isn't automatically a weakness. A smaller platform can be preferable when a team values quick setup and clear operational focus over extensive governance workflows and a broad product surface.
The right pilot should include late loads, expected seasonal changes, schema modifications, and at least one known data-quality incident. A platform that looks simple on stable tables may create too much noise once it monitors the datasets that actually cause operational pain.
Top 10 Data Testing Tools, Feature & Capabilities Comparison
Product | Core features (✨) | Quality (★) | Price / Value (💰) | Target audience (👥) | Unique selling points (🏆 / ✨) |
|---|---|---|---|---|---|
digna 🏆 | ✨ AI baseline anomalies, timeliness, record-level validation, schema tracking, in-database analytics | ★★★★★ | 💰 Transparent base + per-active-table / per-module | 👥 Data engineers, analytics, governance, regulated industries | 🏆 Sovereign (runs in-customer infra); in-database execution; modular + rapid time-to-value |
Great Expectations (GX) | ✨ Declarative Expectations, Data Docs, multi-backend support | ★★★★☆ | 💰 Free OSS (GX Core) | 👥 Engineers, QA, compliance teams | ✨ Audit-ready docs, rich expectation library, large OSS community |
Soda (Core + Cloud) | ✨ YAML checks & Data Contracts, anomaly detection, agent model, scheduling | ★★★★☆ | 💰 OSS Core + Soda Cloud (sales-led) | 👥 Engineers + ops & stakeholders (with Cloud) | ✨ Data contracts, AI-assisted rule generation, Cloud collaboration |
Monte Carlo | ✨ Freshness/volume/schema monitors, ML anomaly, column-level lineage, incident workflows | ★★★★★ | 💰 Sales-led enterprise pricing | 👥 Large data platforms, dataops, SREs | ✨ Strong lineage + blast-radius triage for fast root-cause |
Bigeye | ✨ Metrics-as-code, 70+ prebuilt checks, profiling, lineage workflows | ★★★★☆ | 💰 Sales-led enterprise pricing | 👥 Dev-focused teams, security-conscious enterprises | ✨ Developer automation hooks, enterprise security & integrations |
Anomalo | ✨ Unsupervised ML checks, table observability, insights feed, VPC option | ★★★★☆ | 💰 Sales-led (volume-based) | 👥 Teams needing fast, low-rule anomaly detection | ✨ No-code insights feed with suggested actions; VPC deployable |
Datafold | ✨ Cross-db data diffing, regression testing, dbt + CI/CD integration | ★★★★☆ | 💰 Sales-led | 👥 Engineers doing migrations, PR checks, CI workflows | ✨ High-signal diffs for code reviews & safe rollouts |
dbt tests (Core/Platform) | ✨ SQL-first built-in tests, reusable macros, package ecosystem, CI execution | ★★★☆☆ | 💰 OSS (dbt Core) / paid dbt Cloud | 👥 dbt users, analytics engineers, SQL teams | ✨ Tests live with code and version control; CI-friendly |
Amazon Deequ / AWS Glue DQ | ✨ Declarative constraints, profiling, metric time series, Spark-scale | ★★★★☆ | 💰 OSS Deequ; Glue Data Quality (paid) | 👥 JVM/Spark teams, AWS-centric platforms | ✨ Scales to petabyte Spark workloads; tight AWS integration |
Metaplane | ✨ Baseline-learning monitors (freshness/volume/schema), column lineage, CI checks | ★★★★☆ | 💰 Usage-based pricing + free tier | 👥 Lean teams, pilots, dbt-aligned orgs | ✨ Fast onboarding, transparent usage pricing, free tier |
Choose the Tool That Matches the Failure You Need to Catch
The strongest data testing strategy usually combines layers because each layer answers a different operational question. Deterministic tests ask whether a known condition holds. Anomaly detection asks whether current behavior differs from an established baseline. Observability adds freshness, lineage, incident context, and impact analysis. Diffing asks what changed between two versions, while Spark-scale libraries validate large processing jobs where they run.
Start with the failure that costs your team the most time. If developers repeatedly ship invalid values, missing keys, broken relationships, or incorrect business logic, choose a code-led foundation. dbt tests are the low-friction option for dbt teams. Great Expectations gives Python-oriented teams a flexible open-source library with Data Docs and versioned artifacts. Soda provides a developer-friendly Core path and a managed layer for contracts, anomaly detection, and collaboration. Deequ fits teams whose main validation workload runs in Spark.
Use Datafold when the release risk comes from migrations, refactors, or transformation changes. Its value is not broad monitoring. It is the ability to compare old and new results inside a pull-request or CI workflow and show engineers where the change landed. That makes it a complement to tests and observability, not a replacement for either.
Choose an observability platform when the problem appears after deployment. Monte Carlo, Bigeye, Anomalo, and Metaplane focus on freshness, volume, schema, distribution, lineage, and anomaly workflows, with different balances between enterprise breadth, no-code setup, developer integration, and pricing transparency. Compare alert quality and investigation speed, not just the number of monitors a product can create.
digna belongs on the shortlist when in-environment execution, in-database checks, modular monitoring, and enterprise control are central requirements. Its private-cloud, VPC, and on-premises deployment options keep production data inside the customer's boundary. The combination of anomaly detection, timeliness, record-level validation, schema tracking, and historical analytics can reduce the need to stitch separate monitoring functions together. The trade-off is that internal infrastructure and support remain part of the operating model, and per-active-table, per-module pricing requires careful scope planning.
Run a pilot on representative datasets rather than a clean sample. Include a critical financial or operational table, a late-arriving feed, a schema change, a known invalid-record condition, and a dataset with normal seasonal variation. Document where checks execute, what metadata leaves the environment, who owns each alert, which failures block releases, and how engineers access evidence.
Measure test coverage by critical table, alert precision, mean time to detect, and mean time to resolve. These measures distinguish useful controls from a large collection of noisy checks. They also give governance and data-platform leaders a way to assess whether the chosen tool reduces investigation effort and downstream disruption.
Finally, model pricing against the monitored scope you expect after adoption. Include active tables, modules, environments, support, infrastructure, and the engineering time required to maintain tests. The best tool isn't the one with the most capabilities. It's the one your team can operate continuously, trust during incidents, and extend as data systems become more important.
digna provides in-environment, in-database data quality and observability for teams that need anomaly detection, timeliness monitoring, record-level validation, and schema tracking without moving production data outside their infrastructure. If that workflow matches your security and governance requirements, visit digna to evaluate the platform for your data testing strategy.
If your gap is the deterministic layer described above, with required fields, ranges, reference lists and cross-field conditions checked inside the database, see how digna Data Validation defines and enforces record-level rules.
Frequently asked questions
What is the difference between data testing and data observability?
Data testing checks whether a known condition holds, such as a unique key or an accepted value, while observability watches freshness, volume, schema, distribution and lineage after deployment. Most teams need both layers, since a deterministic rule rarely catches an unusual distribution and an anomaly detector cannot prove an exact business rule.
Are dbt tests enough for data quality?
Usually not on their own. dbt tests cover unique, not null, accepted values and relationships, plus singular SQL tests, and they live beside the models in version control. They stay deterministic, though, so production environments often add freshness checks, distribution monitoring, lineage or incident workflows on top of them.
Is Great Expectations still free after GX Cloud was discontinued?
Yes, GX Core remains the open-source option with no license fee. According to the article, GX Cloud was discontinued after an acquisition in mid-2026, so buyers should not plan around a hosted GUI and must be ready to run suites, Data Docs and execution workflows themselves.
When should I use a data diffing tool like Datafold?
Reach for diffing when the risk comes from a code change, migration or refactor. Datafold compares old and new results row by row inside a pull request or CI workflow, which catches changes aggregate checks miss. It complements tests and observability but does not cover freshness, lineage or ongoing schema behavior.
Which data testing tool keeps production data inside my own infrastructure?
digna runs in a private cloud, VPC or on-premises environment and executes its checks in-database, so production records never leave the customer's boundary. Anomalo and Datafold also offer VPC options, but teams should confirm what metadata, logs and support access cross that boundary before choosing.


