Operational Hazard Analysis for Data Teams
|
6
min read

Many teams still treat operational hazard analysis like a sign-off exercise. They write the checklist, approve the release, and assume the risk picture stays stable until the next review. That habit breaks in modern data and AI operations, where the failures that matter most usually appear after deployment, not before it.
Static reviews miss the signals that change outcomes: schema drift, late loads, broken validation paths, shifting automation authority, and human workarounds that never show up in a pre-launch document. The safer pattern is continuous, data-driven hazard analysis, where observability metrics act as live evidence and every change in the operating environment can reopen the risk question.
Table of Contents
Rethinking Operational Hazard Analysis for Data Operations
Operational hazard analysis works only when it follows the system, not the calendar. A one-time review can catch obvious design flaws, but it cannot keep pace with a pipeline whose source data, orchestration logic, or downstream use changes week by week. That gap matters because the hazard rarely lives in one symptom. It usually shows up as a chain of small failures that line up at the wrong time.
Why point-in-time reviews fail
A pipeline can pass a launch checklist and still become risky later. An upstream team changes a schema, a transformation still runs, a reporting table fills with nulls, and the business keeps acting on stale data because nobody tied those events together. That is exactly where lifecycle thinking matters, because the hazard is not the schema change alone, it is the causal path from change to broken decision.
Practical rule: If the environment can change without a formal release, the hazard analysis has to change without waiting for a quarterly review.
Data observability becomes more than an engineering convenience in this context. When lateness, validation failures, row-count discontinuities, or schema drift are captured as operating evidence, they become the raw material for hazard analysis, not just dashboard noise. A team that treats those signals as safety inputs can react before the issue turns into reporting loss, model degradation, or a control failure.
Data observability works best when it is wired into the same control mindset that safety programs use in regulated industries. The useful question is not whether a pipeline “passed.” It is whether the system is still behaving the way the hazard analysis assumed it would.
The Shift from Qualitative Checklists to Quantitative Models

The modern discipline did not begin with dashboards. It began when safety engineers stopped treating broad checklists as enough and started modeling how failures combine. Fault Tree Analysis emerged in the early 1960s as a deductive method that starts with an undesirable system-level event and works backward to the component failures, human actions, and external conditions that could produce it. Bell Laboratories developed it around 1961 to 1962 for the Minuteman missile launch-control system, and Boeing adopted it in 1963 for commercial-aircraft safety analysis, which pushed hazard analysis toward explicit logic models and probability calculations. NASA's review of FTA traces that development across safety-critical sectors such as nuclear power, chemical processing, and pharmaceuticals. NASA's FTA overview
Why the old logic still matters
The core lesson from FTA is structural: hazards are better understood as combinations of observable conditions than as isolated incidents. In data operations, a late source file, a failed validation, and an unseen schema change form a more useful risk model than “the pipeline failed.” The first version supports investigation and prevention. The second mostly supports blame.
A good hazard model names the conditions that can be measured, not just the outcome that everyone notices after the damage is done.
That logic also helps teams identify single points of failure and minimal cut sets, which matters when one fragile dependency can break a full reporting chain. The goal is not to turn data platforms into aerospace systems. The goal is to use the same discipline that made high-risk engineering more reliable in the first place.
For teams that want to translate those ideas into modern analytics practice, Monte Carlo simulation is a useful companion when the input space is uncertain. It does not replace causal analysis, but it can stress-test how combinations of timing, volume, and transformation errors behave under load.
Mapping System Boundaries and Causal Chains

A hazard analysis is weak if the system boundary is vague. FAA safety-management guidance requires analysts to define the system and operating context, identify hazards in enough detail to determine risk, analyze severity and likelihood, compare risk with performance targets, and reassess controls using operational data. That lifecycle view fits data platforms well, because the system usually spans ingestion, transformation, storage, orchestration, human review, and downstream consumers. FAA safety-management guidance
A practical boundary map
Start with the full data path, not just the warehouse table people query every morning. Include upstream feeds, batch windows, stream processors, dbt models, approval steps, manual overrides, and the teams that consume the data for reporting or automation. If a risk can enter through an upstream system and surface three layers later, it belongs in the same analysis.
Then write hazards as causal chains. A schema modification can break a transformation, which can produce incomplete regulatory reporting, which can create a control failure in the business review process. That is a stronger record than “schema drift” because it identifies the initiating condition, the consequence, and the operating context where the loss becomes visible.
Data system architecture matters here because architecture defines where evidence is available and where controls can be placed. If a team cannot point to the exact stage where lateness, null spikes, or invalid records are detected, the analysis is abstract.
AI agent security in finance is a useful reference if you want to see how risk analysis changes once automated decision-making is in the loop. The common thread is simple: once software can act, the boundary has to include both the action and the conditions that make it unsafe.
What each hazard record should hold
A useful record captures operating mode, initiating condition, consequence, severity, likelihood, existing safeguards, control owner, detection signal, and acceptance authority. That turns a hazard from a memory into a managed object. It also makes reassessment easier when the system changes, because the team knows exactly which assumption was violated.
Scoring Risk with Observable Data Metrics
The strongest risk scores come from combining consequence and likelihood, not from tallying symptoms. FAA policy defines safety risk as the combination of severity and likelihood, and MIL-STD-882-based practice evaluates hazards across hardware, software, human interfaces, and operational environments. That matters in data operations because the same technical fault can be low-risk in one business process and serious in another. FAA Order 8040.4B
Turning observability into a risk signal
A late load is not just an engineering annoyance. If the downstream use case depends on current data, lateness increases exposure by delaying a decision or feeding a stale model score. A null-rate excursion can indicate incomplete source capture, a failed join, or a broken transformation, and each one changes the credibility of the output in a different way.
Risk Component | Abstract Definition | Observable Data Metric |
|---|---|---|
Likelihood | How often the hazard can occur | Load lateness, failed validation rates |
Severity | How bad the outcome could be | Business KPI impact, regulatory reporting completeness |
Detection | How quickly the team can see the problem | Alert latency, row-count discontinuities |
Control strength | How well safeguards block or surface the issue | Schema-change detection, validation coverage |
The table is most useful when teams stop treating it like a reporting artifact and start using it to rank work. A recurring late feed with weak detection deserves a different control plan than an isolated formatting issue caught before publish. That is the difference between a tidy log and a real risk model.
Operational rule: Rank the credible consequence of the causal scenario, then revise the score after controls are applied.
What makes the score defensible
A defensible score is traceable. If a claims dataset arrives late, the team should be able to point to the delay frequency, the detection path, the business exposure, and the control that reduced the residual risk. That is the only way residual acceptance stops being a hand wave and becomes a documented decision.
For a deeper view of the metric layer, data observability metrics are the practical bridge between platform behavior and risk scoring. They give the analysis a measurable surface instead of a broad comfort statement.
Designing Testable Controls for Human Oversight
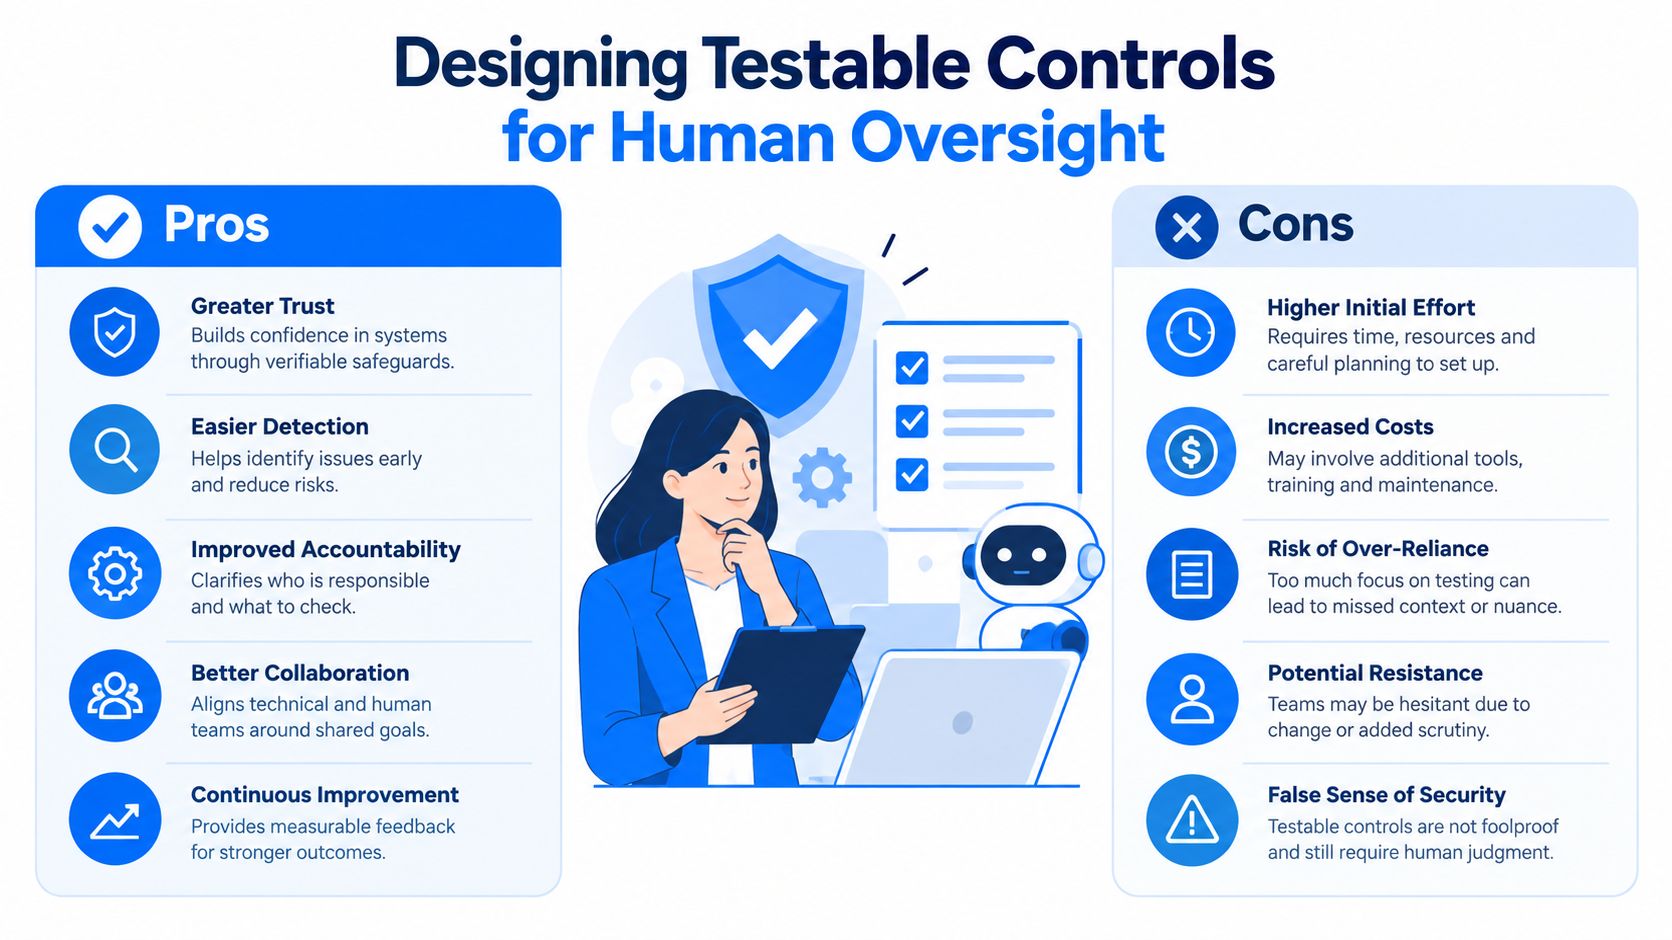
Human review gets added to a lot of control plans because it sounds safe. In practice, it can fail in subtle ways. Regulators and safety organizations keep stressing that human responsibility doesn't disappear when AI is involved, and they recommend testing workload, attention, decision-making, role clarity, escalation behavior, and responses to incorrect or withheld recommendations. Human factors guidance
Human-in-the-loop is not a control by itself
A reviewer who gets too many alerts will start triaging, not validating. A reviewer who sees unclear explanations will accept the system's output because challenge takes too long. A reviewer who doesn't know who owns escalation may notice the issue and still let it slide.
That is why human oversight has to be testable. Simulate degraded data, delayed inputs, schema changes, conflicting signals, automation outages, and high workload, then measure detection time, override quality, escalation completion, recovery time, and recurrence. Those outcomes tell you whether the human has the time, information, authority, and competence to intervene.
Adding a reviewer can raise risk if the reviewer is flooded, undertrained, or blocked from acting.
This is the piece many teams miss. A human layer is not automatically a preventive control. In some environments it becomes a bottleneck that adds delay without adding safety, especially when the alert stream is noisy or the system explanation is weak.
How to make oversight measurable
Record when the operator saw the issue, whether they challenged it, what action they took, and whether the system recovered cleanly. Keep that evidence next to the technical telemetry, because a nominally successful workflow can still hide unsafe human behavior. If the operator has to guess, defer, or route around the process, the control is not mature yet.
Continuous Monitoring in Regulated Industries
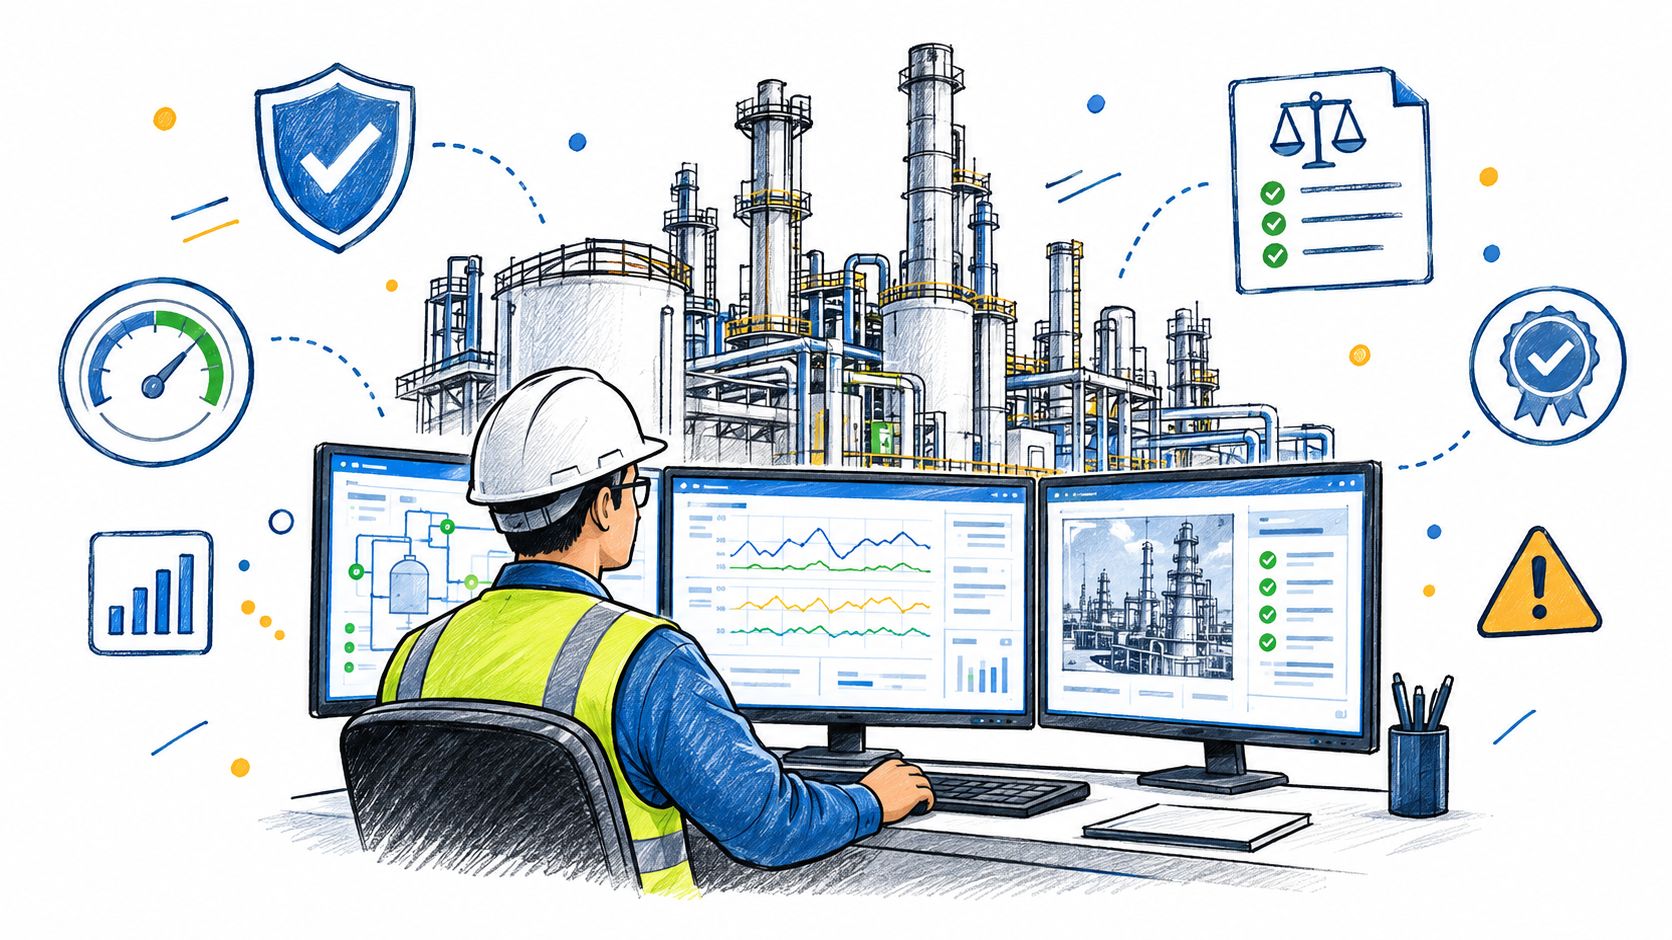
A financial services team can do everything right on paper and still miss the hazard in practice. A transactional feed that usually lands on time starts drifting later than normal, but the volume change is small enough that a static threshold never fires. The report still generates, the dashboard still updates, and the stale data flows unnoticed into a decision process that assumes freshness.
Continuous monitoring changes that failure mode. In a regulated environment, business KPIs, schema drift, timeliness, validation, and platform conditions need to stay under watch together. digna's data quality and compliance use case fits that model because the platform stays in the customer's own environment while monitoring data behavior in place, which keeps the operational evidence close to the system it protects.
Why rigid thresholds fail in regulated settings
A rigid rule only sees what it was written to detect. It misses a load that is present but late, or a schema change that still passes syntax checks while breaking a downstream assumption. It also falls behind when the business context changes faster than the rule set.
Continuous monitoring works better because it can catch unusual combinations of behavior, not just isolated threshold breaches. That matters in healthcare, finance, telecom, and public-sector operations, where a subtle shift in volume or structure can turn into a reporting or service issue before anyone opens an incident ticket.
The best alerts are early, specific, and tied to a business consequence the owner already understands.
The data platform and the control system overlap here. If the observability layer can validate critical business rules, track structural changes, and surface anomalous patterns without moving production data outside the environment, the risk evidence stays usable for both operations and audit. For regulated data operations, that same evidence also supports a clean compliance trail, as shown in digna's data quality and compliance use case.
What good operational monitoring needs
Good monitoring does three things at once. It detects pipeline behavior, validates business meaning, and preserves evidence that the control worked. When any one of those pieces is missing, the team gets noise instead of assurance.
Triggering Reassessment When Systems Change

Operational hazard analysis for AI-enabled operations is still too often treated as a one-time pre-deployment exercise, even though the biggest risks usually show up after deployment. Recent safety guidance emphasizes incremental implementation, continuous monitoring, change control, local validation, and explicit responsibility instead of assuming a model or automated system stays safe after approval. FAA safety guidance on AI-enabled operations
What should trigger a fresh review
A reassessment should start when the system changes in a way that can alter risk. That includes model or software version changes, altered input data distributions, new automation authority, abnormal override patterns, staffing shifts, incidents, and near misses. It also includes process changes that alter who sees an alert, who can approve a decision, or how quickly recovery can happen.
For teams dealing with regulated data or automated content, a useful adjacent reference is rules on AI-generated videos. The reason is simple, if an automated system changes what people see, trust, or approve, the risk analysis has to cover both the output and the human response.
How to keep the evidence trail usable
Record uncertainty, user response, downstream action, severity, affected subgroup, corrective action, and recurrence. That gives the next review enough context to tell whether the hazard was fully resolved or merely suppressed. It also prevents the common failure where a model looks accurate in aggregate but still creates operational harm because people over-trust it, ignore it, or cannot act on its output fast enough.
The strongest process is trigger-based, not calendar-based. When the data, the workflow, or the authority model changes, the hazard analysis should reopen automatically and the control evidence should be updated with it.
digna helps teams turn pipeline metrics, schema drift, validation outcomes, and timeliness signals into continuous hazard indicators inside their own environment. If you're replacing static checklists with live operational evidence, visit digna and see how data observability can support safer, more accountable data operations.
Late loads are one of the most common initiating conditions in these causal chains, so the likelihood score depends on catching them early. digna's Timeliness module learns each table's normal arrival pattern and flags data that lands late or not at all, giving the hazard record a measurable detection signal.
Frequently asked questions
What is operational hazard analysis in data operations?
Operational hazard analysis is the practice of identifying how failures in a live system can combine into harm, then controlling them. In data operations it follows the full data path, from upstream feeds and dbt models to manual overrides and downstream consumers, and is reopened whenever the system changes.
Why do point-in-time hazard reviews fail for data pipelines?
Because most damaging failures appear after deployment. A pipeline can pass its launch checklist, then an upstream schema change fills a reporting table with nulls while the transformation keeps running, and the business acts on stale data. A quarterly review cannot catch a causal chain that forms between reviews.
How can observability metrics be used to score hazard risk?
Map each risk component to a measurable signal. Likelihood can come from load lateness and failed validation rates, severity from business KPI impact or regulatory reporting completeness, detection from alert latency and row-count discontinuities, and control strength from schema-change detection and validation coverage. Rescore after controls are applied.
What should a hazard record include?
A useful hazard record holds the operating mode, initiating condition, consequence, severity, likelihood, existing safeguards, control owner, detection signal and acceptance authority. Writing hazards as causal chains, for example schema change to broken transformation to incomplete regulatory reporting, shows exactly which assumption was violated when the system changes.
When should an operational hazard analysis be reassessed?
Reassess whenever a change can alter risk, not on a fixed calendar. Triggers include model or software version changes, shifted input data distributions, new automation authority, abnormal override patterns, staffing shifts, incidents and near misses, plus process changes that affect who sees an alert or who can approve a decision.


