Data Quality Issues Your Guide to Detection and Remediation
|
5
min read

Poor data quality costs businesses an average of $12.9 million per year, according to Gartner (Revefi summary of Gartner). That number changes the conversation. Data quality issues aren't just annoying cleanup work for analysts or a backlog item for data engineering. They're a direct business risk.
The problem is often first noticed in smaller ways. A dashboard stops updating before a weekly meeting. A finance report doesn't match the source system. A model that worked last month starts making odd predictions. Someone opens a ticket, someone else runs ad hoc SQL, and the team spends the day proving whether the data is wrong or the metric definition changed. In regulated environments, that same pattern adds another problem: many observability tools expect you to move sensitive data into a vendor cloud to inspect it.
That trade-off is often unacceptable. If you're in finance, healthcare, telecom, or the public sector, the practical question isn't only how to detect data quality issues. It's how to detect them without sending production data to a third party. That's where an in-database observability approach matters. You keep data resident, compute metrics where the data already lives, and still get anomaly detection, schema tracking, timeliness monitoring, and record-level validation.
Table of Contents
Why Data Quality Is a Silent Business Risk
The expensive part of bad data usually isn't the first error. It's the delay before anyone trusts that an error exists. Teams lose time debating the dashboard, re-running jobs, comparing systems, and checking whether a field changed upstream. Meanwhile, business users still need to act.
Bad data stays silent because it often doesn't crash loudly. A pipeline can complete while producing a subtly wrong output. A table can load on time while key values drift away from normal patterns. A customer record can remain structurally valid while becoming less useful every month.
Where teams actually feel it
In day-to-day operations, data quality issues show up as:
Broken dashboards: Executives see empty charts or numbers that don't reconcile.
Stale reports: Business teams work from yesterday's reality when they need today's.
Manual verification loops: Analysts spend time checking the data before they can answer the question.
Lost trust: Once people doubt the dataset, they build side spreadsheets and parallel logic.
Practical rule: If users ask whether the dashboard is safe to use before they ask what it means, you have a data quality problem.
Why this is a business issue, not just an engineering issue
A data platform team can patch individual incidents for a while. That doesn't scale. The underlying problem is that modern organizations rely on data for planning, automation, compliance, and AI. Once trust drops, decision speed drops with it.
This is why I treat data quality issues as an operational reliability problem. They affect revenue operations, financial reporting, customer support, and model performance at the same time. The technical symptom might be a late load or schema change. The business symptom is slower decisions and higher risk.
The Eight Common Categories of Data Quality Issues
Most incidents fall into a small set of repeatable patterns. Naming them clearly matters because the fix for a duplicate record isn't the fix for a late pipeline, and the fix for schema drift isn't the fix for incomplete customer input.
A practical taxonomy
Here is the vocabulary I use with new team members.
Issue Category | Business Impact | Example digna Solution |
|---|---|---|
Completeness | Missing fields break segmentation, reporting, or downstream workflows | Data Validation |
Accuracy | Teams act on values that don't match reality | Data Validation |
Timeliness | Users make decisions on stale data | Timeliness |
Consistency | Conflicting representations create reconciliation problems | Data Validation |
Schema drift | Structural changes break queries, models, and dashboards | Schema Tracker |
Duplicates | Counts inflate and customer views fragment | Data Validation |
Outliers | Unusual spikes or drops hide defects or real events | Data Anomalies |
Pipeline failures | Loads succeed partially or fail silently downstream | Data Anomalies and Timeliness |
What each category looks like in practice
Completeness
A record is incomplete when a required field is absent or null in a way that makes the row less useful. Think of a customer table with valid IDs but missing consent status or region.
Accuracy
Data is inaccurate when it doesn't reflect the actual state you're trying to model. A shipped order marked as pending is accurate structurally and still wrong for operations.
Timeliness
Timeliness is about whether data arrived when the business expected it. A sales dashboard generated from old pipeline output can be internally consistent and still unsafe to use.
Consistency
Consistency problems appear when two systems represent the same business entity differently. Finance and CRM may both have the customer, but not with the same status logic or formatting.
A lot of painful incidents happen because a dataset is valid in isolation and misleading in context.
Schema drift
Schema drift is the quiet structural change that catches teams off guard. A column gets renamed, removed, or changes type. The upstream producer may think it's a harmless update. The downstream transformation disagrees.
Duplicates
Duplicates create hidden operational noise. Marketing emails go out twice. Customer support sees multiple records for the same person. KPI counts drift upward for reasons no one intended.
Outliers
Outliers aren't always errors. Sometimes they're the earliest signal that a source changed, a feed duplicated rows, or a business event happened that no threshold rule anticipated.
Pipeline failures
Pipeline failures aren't limited to hard crashes. The more dangerous version is partial success. A job runs, some tables update, others don't, and the dashboard still renders.
Why categorization matters
Once you classify the issue, you can choose the right control:
Record-level rules for invalid values and missing fields
Schema monitoring for structural changes
Freshness monitoring for late or missing delivery
Statistical anomaly detection for silent drift and unusual behavior
Without that separation, teams default to piling more SQL checks onto every table. That creates noise and still misses the issues that matter.
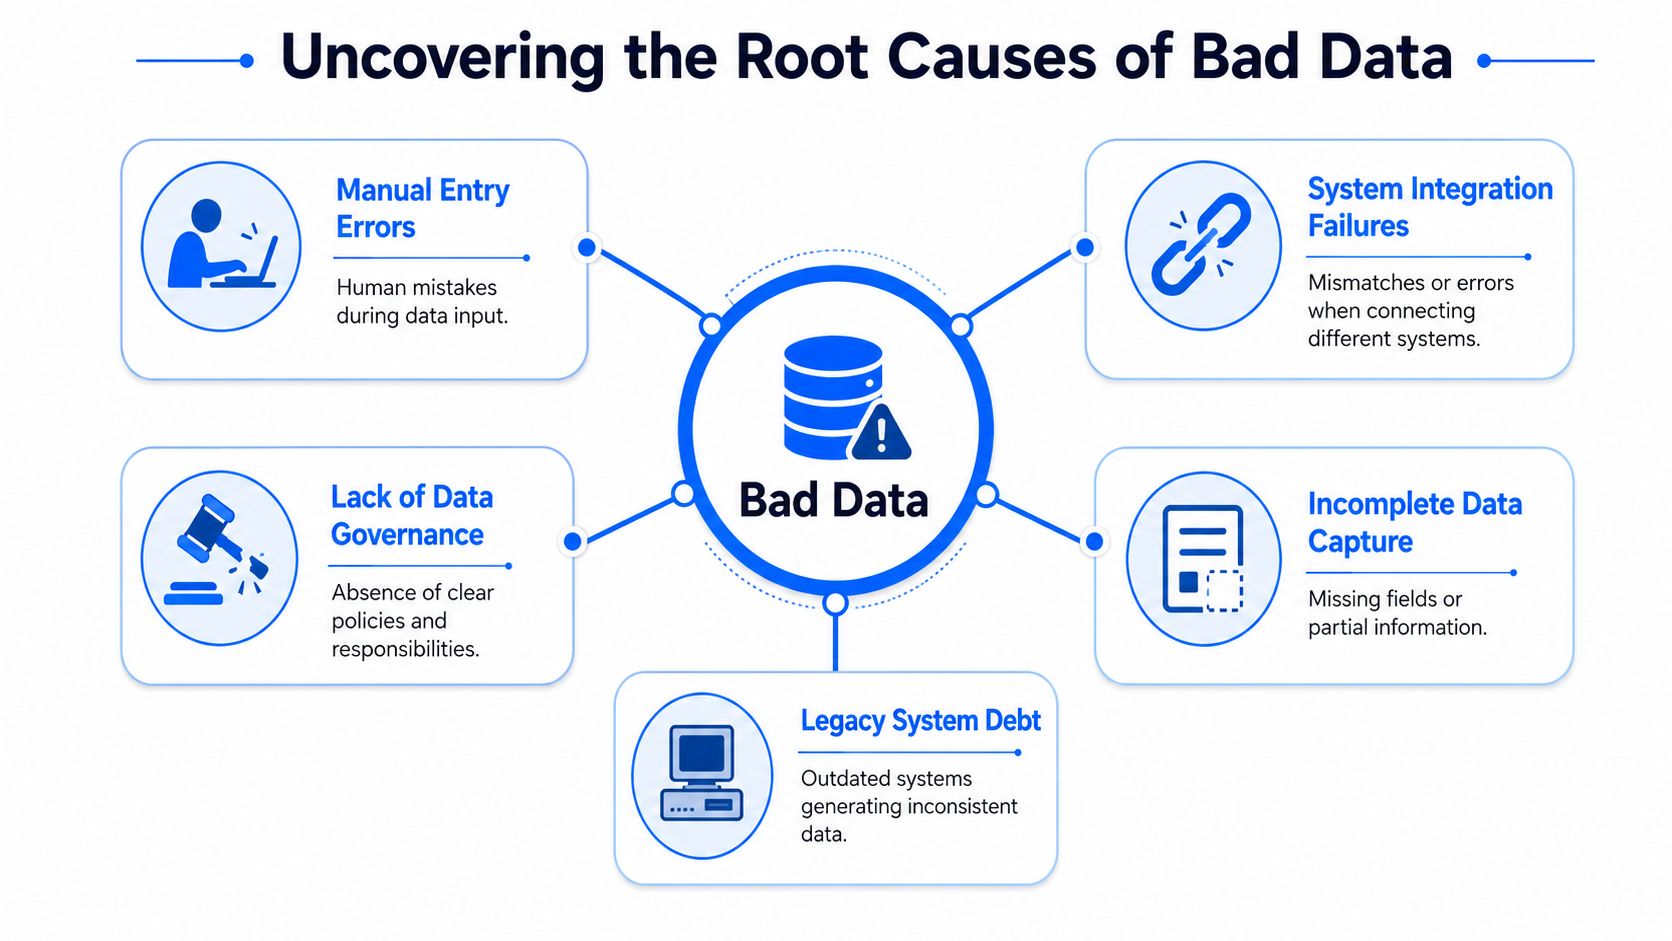
Uncovering the Root Causes of Bad Data
Most recurring data quality issues come from system design and operating habits, not from a single bad row. You need to look upstream, across processes, and over time.
The causes usually hide in plain sight
Manual entry is still one of the biggest sources of defects. Teams copy values from emails, PDFs, and forms under time pressure, then those small mistakes spread into CRM, billing, and analytics. If your workflow still depends on people retyping commercial data, it's worth looking at ways to prevent data entry errors in proposals before the errors ever reach the warehouse.
System integration failures show up when two applications disagree on field meaning, format, or timing. You see one symptom in a dashboard, but the actual defect started when source A sent a value source B interpreted differently.
Governance gaps make all of this worse. If nobody owns a data domain, incident handling turns into guesswork. Engineers can restore a pipeline, but they can't decide whether a business rule changed unless someone is accountable for the data.
Data gets worse even when nobody breaks anything
Data isn't static. Data decay occurs at a global rate of approximately 3% per month, which means records naturally become outdated unless teams maintain them (lakeFS on data quality issues). Contact data changes. Product catalogs evolve. Account status, pricing conditions, and customer relationships don't sit still.
That decay matters because many teams only monitor pipeline success. They don't monitor whether the dataset still reflects current reality.
A successful load can still deliver stale information
A valid schema can still carry outdated values
A complete row can still be wrong for today's decision
The root-cause workflow that actually helps
When an incident appears, I trace it in this order:
Start with the symptom. Which report, table, or model became unreliable?
Check delivery timing. Was the expected load late, partial, or missing?
Inspect structure. Did a column, type, or upstream interface change?
Review value behavior. Did distributions shift even though the schema stayed stable?
Confirm ownership. Who can say whether this is a defect or a real business change?
For teams formalizing that process, a structured guide to analyzing root causes of data issues using AI can make the handoff from alert to diagnosis much faster.
Root-cause work gets easier when your monitoring mirrors how failures actually happen: timing, structure, values, then ownership.
The True Cost of Inaction Business and ML Impacts
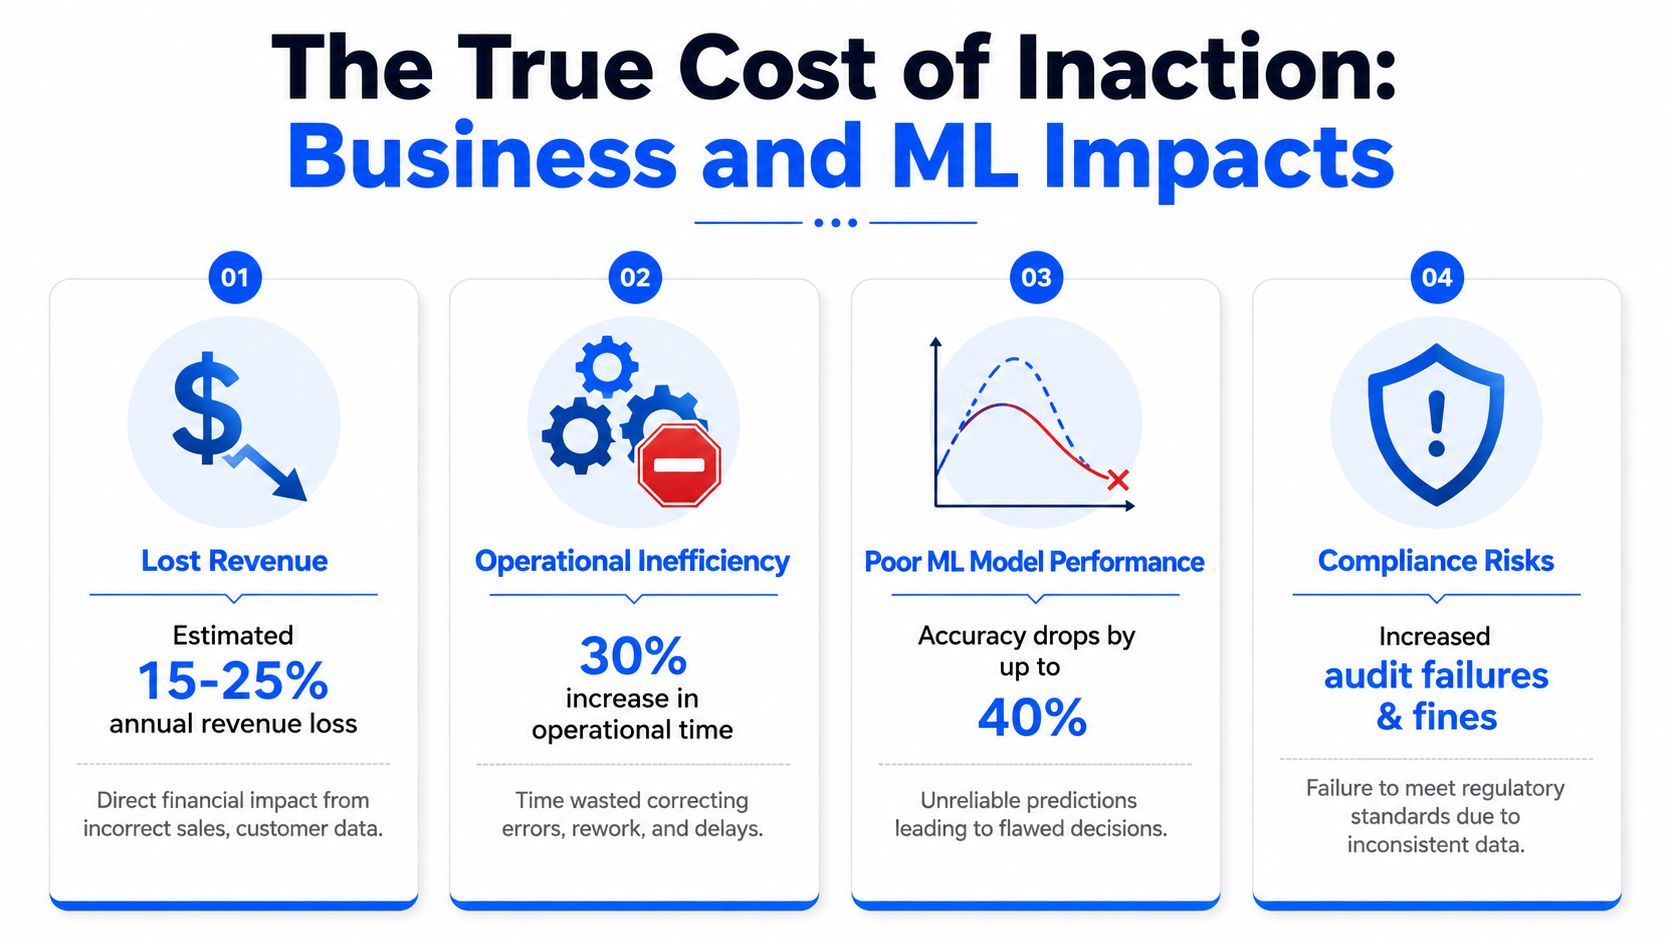
The operational damage from poor data quality isn't limited to rework. It changes how teams behave. They stop trusting automation, duplicate checks manually, and delay decisions until someone validates the numbers.
Business systems pay first
When data trust falls, the first casualty is speed. Revenue teams question pipeline reports. Finance reconciles more by hand. Compliance teams ask for evidence that no one can produce cleanly because the lineage is murky or the source changed unnoticed.
In forecasting workflows, this is especially visible. If you're trying to connect source reliability to commercial planning, this guide on how to diagnose and improve sales forecasting is useful because it shows how data defects distort planning before leaders realize the model isn't the only problem.
ML systems fail differently
Machine learning pipelines are less forgiving than many teams expect. A dashboard may look odd and trigger human review. A model can continue serving predictions while input quality deteriorates.
Traditional rule-based validation often misses up to 90% of ML-relevant anomalies because it relies on static thresholds rather than dynamic baseline learning, and the cost of a single undetected drift event can exceed $1M in lost revenue due to bad automated decisions (Atlan on data quality issues).
That has two practical implications:
Static checks aren't enough for model inputs. Null checks and range checks catch obvious defects, not subtle distribution shifts.
Silent drift is expensive. By the time users notice degraded outputs, the model has already influenced decisions.
If a feature pipeline is important enough to feed a model, it's important enough to monitor for drift, not just validity.
The hidden cost is engineering focus
Reactive data work consumes attention that should go into platform improvements. Instead of building reusable data products, teams chase incidents, answer trust questions, and replay jobs. That's a tax on engineering capacity and on stakeholder confidence.
How to Detect and Measure Data Quality
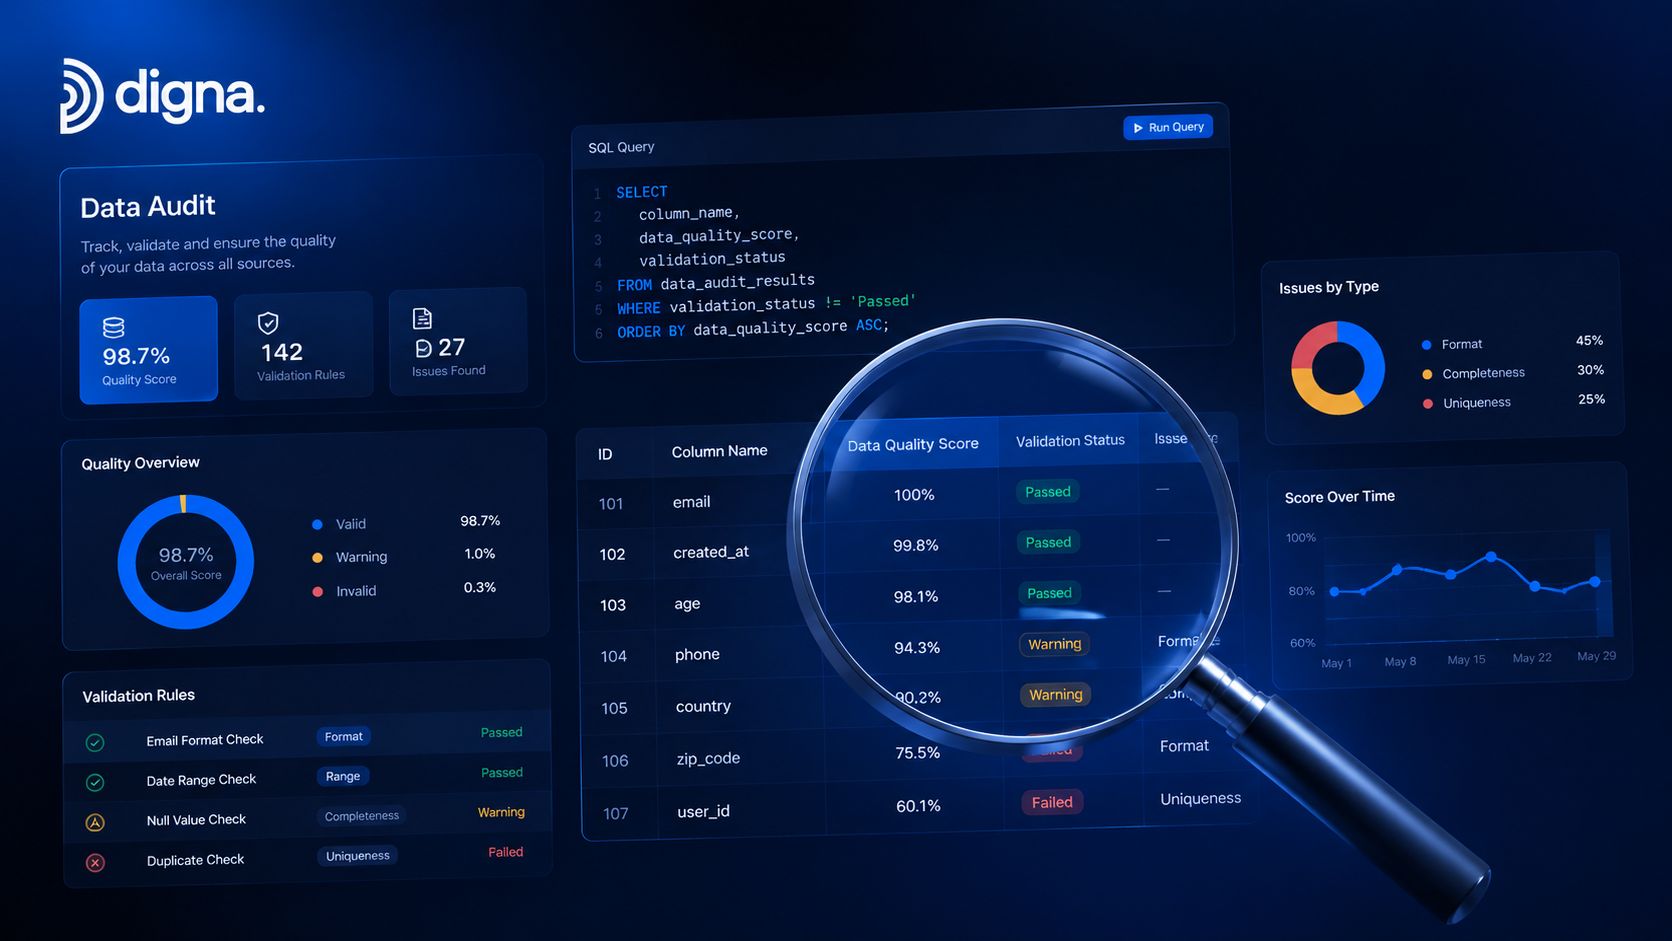
There are two broad approaches to detection. The old approach asks engineers to define rules up front for everything they can imagine. The newer approach combines explicit rules with continuous observability that learns normal behavior and flags deviations.
What traditional checks do well
Manual SQL checks and rule-based tests still have a place. They're good for hard requirements:
Required fields
Accepted value lists
Referential integrity
Business logic such as status or amount constraints
These controls are auditable and predictable. For compliance-sensitive datasets, you want them.
Where traditional checks break down
The problem is coverage. Studies indicate that 85% of data pipelines suffer from unexpected structural modifications like added or removed columns that bypass traditional rule-based monitoring systems (Atlan on data quality software). If your checks only test known assumptions, they won't catch new failure modes.
A static rule also struggles with behavior that changes over time. A table may keep the same schema while a key metric slowly drifts. That can degrade reporting or model quality without violating a single hard-coded threshold.
What modern observability adds
Modern observability tools measure patterns, not just rule compliance. They monitor historical baselines, seasonal behavior, schema changes, and expected delivery schedules. The key shift is this: instead of asking engineers to guess every future issue, the platform watches for behavior that becomes abnormal relative to the past.
A practical measurement stack usually includes:
Detection method | Best for | Limitation |
|---|---|---|
SQL tests | Hard business rules | Misses subtle drift |
Schema monitoring | Column and type changes | Doesn't explain value anomalies |
Timeliness monitoring | Late or missing loads | Doesn't validate record correctness |
Anomaly detection | Silent shifts and unusual patterns | Needs good baseline learning |
What to measure first
If you're building a baseline program, start with a small set of visible metrics and make them operational. A useful reference is this overview of data quality metrics, especially if you need to align engineers and business stakeholders on what gets measured and why.
My default order is simple:
Timeliness of critical tables
Schema changes on shared datasets
Record-level rules for regulated or high-impact fields
Behavioral anomalies on core business metrics
The strongest detection setup mixes deterministic controls with learned baselines. One catches what must never happen. The other catches what no one thought to encode.
A Modern Workflow for Remediation and Monitoring with digna
A workable remediation flow needs to do four things in sequence: detect the issue, localize it, validate its impact, and notify the right owner without moving sensitive data outside the customer environment.
Start with detection inside the database
In regulated environments, the architectural decision matters as much as the feature set. Many teams can't ship production data to a third-party cloud for analysis, especially when the same tables contain operational records, customer identifiers, or sensitive business events.
An in-database workflow keeps the data resident and computes metrics where the warehouse or lake already lives. digna is one example of this approach. It performs anomaly detection, timeliness monitoring, schema tracking, historical analytics, and record-level validation inside customer-controlled environments such as private cloud or on-prem deployments.
That changes the trade-off. You don't have to choose between observability and data residency.
A practical incident flow
Here's the kind of sequence that works well in production:
An anomaly appears. A volume drop, distribution shift, or unusual spike is detected on a critical table.
Timeliness is checked. Was the load late or incomplete?
Schema is inspected. Did an added, removed, or modified column change downstream behavior?
Records are validated. Are business rules failing at row level?
Owners get context. The alert includes the table, metric, time window, and likely source area.
Timeliness failures result in 62% of stale reports and broken dashboards, and data lateness issues increase root-cause analysis time by 3.2x compared to immediate anomaly detection (d data on timeliness monitoring). If the system catches the delay as it happens, engineers investigate one pipeline step. If it doesn't, they spend much longer reconstructing the chain of events.
What works better than ad hoc firefighting
The old remediation pattern is familiar: someone reports a broken chart, an engineer runs SQL, an analyst checks upstream data, and the team patches the symptom. That can solve today's incident and still leave tomorrow's incident waiting.
A better pattern combines:
Expected delivery monitoring so stale data is caught before meetings and reports
Schema change alerts so structural defects don't hide behind successful job runs
Record-level validation for fields tied to compliance, billing, or customer communication
Historical trend views so teams can tell whether a shift is new, seasonal, or long-running
If your downstream issue is customer communication quality rather than warehouse integrity, adjacent hygiene practices matter too. For example, teams cleaning outbound data to boost your email ROI are solving a different layer of the same trust problem: bad records produce bad outcomes.
Why privacy-first observability matters
The strongest argument for in-database observability is operational realism. In many enterprises, security and legal teams will block architectures that require broad vendor access to production datasets. A monitoring design that respects that constraint is more likely to get approved, deployed, and kept in service.
Building a Proactive Culture of Data Quality
Tools help, but culture determines whether alerts lead to better systems or just more tickets.

The teams that handle data quality issues well do a few things consistently:
Assign ownership: Every important dataset needs a person or team who can answer whether a change is expected.
Automate the obvious: Don't spend analyst time on checks a system can run continuously.
Separate rule failures from behavior shifts: Compliance rules, schema changes, and anomalies need different responses.
Make quality visible: Engineers, analysts, and business users should see the same health signals.
Review incidents for prevention: Each fix should produce a better guardrail, not just a one-time correction.
Good data cultures don't wait for executives to discover the problem in a dashboard. They surface it earlier, with context and ownership attached.
A practical checklist for a new team is short:
Name your critical tables and reports
Define owners for each data domain
Monitor freshness and schema on shared assets
Validate regulated and business-critical fields
Track trends so recurring incidents become visible
If you're evaluating privacy-first ways to detect and remediate data quality issues, digna is worth a look. It focuses on in-database observability, anomaly detection, record validation, timeliness monitoring, and schema tracking in customer-controlled environments, which makes it relevant for teams that need strong monitoring without moving sensitive data to a third-party cloud.


