Data Quality Management: A Practical Roadmap
|
8
min read
The board pack is already in circulation when someone spots the problem. Revenue looks softer than expected, a forecast misses its line, and the FP&A analyst reruns the query, then reruns it again. Nothing in the dashboard says “broken.” The warehouse accepted the load, the pipeline reported success, and the report refreshed on schedule.
That's the operational reality of data quality management. Bad data rarely arrives with a clear error message. It appears as a questionable trend, a failed reconciliation, a regulatory exception, or an AI output that sounds plausible until someone checks the underlying records. A workable DQM program catches those failures where they begin, inside the systems and tables that produce the data, rather than waiting for a consumer to discover them.
Table of Contents
When Trust in Data Quietly Breaks
What Data Quality Management Really Means
Measure the flow, not only the endpoint
Replace cleansing projects with operating controls
Core Dimensions and the KPIs That Prove Quality
Governance and the Operational Workflow Around Quality
Build a policy catalog
Run a shared response loop
An Implementation Roadmap That Ships
Start with controls people can trust
Common Failure Modes and the Remediation Patterns That Work
Industry Use Cases Across Regulated and High-Volume Data
Finance needs controls across system boundaries
Healthcare needs identity and arrival discipline
Telecom needs proximity to ingestion
Public sector needs defensible evidence
From Periodic Cleanup to Continuous, Trustworthy Operations
A compact operating checklist
When Trust in Data Quietly Breaks
The FP&A team has shipped its board deck. The revenue figure is 8% understated because a billing table dropped rows after a schema rename the night before the load. The executive reviewing the deck notices that the trend line bends in the wrong direction, but the first reaction isn't “data quality incident.” It's “the business missed plan.”
The analyst checks the source query. Then the reporting query. Then a version with a different join. The result keeps looking wrong. An engineer eventually finds an orphan column left behind after the rename, with downstream logic still expecting the previous field. The VP asks the question every data leader eventually hears: how did this get past QA?
That question exposes the weakness of output-only testing. A report can pass a refresh check while containing incomplete data. A pipeline can complete successfully while delivering a stale partition. A model can produce technically valid predictions from a feature table whose meaning changed upstream. The failure becomes visible only after the data has crossed several boundaries.
Practical rule: Treat every critical table as a production service with an owner, an expected behavior, and an incident path.
The business consequences of continuing data quality issues extend beyond an inaccurate dashboard. Executives inherit unreliable numbers, analysts lose time proving basic facts, regulators may receive flawed evidence, and customers can encounter broken workflows built on the same records. Gartner estimates that organizations lose an average of US$12.9 million per year from data quality failures, while industry summaries commonly cite bad data affecting about 31% of business revenue. These figures are summarized in data quality management market research.
The practical response is to instrument the pipeline itself. Check structural changes, arrival patterns, record behavior, business rules, and downstream impact before consumers act on the result. Every report, ML feature, regulatory submission, and customer-facing process inherits the upstream trust your controls either earn or fail to protect.
What Data Quality Management Really Means
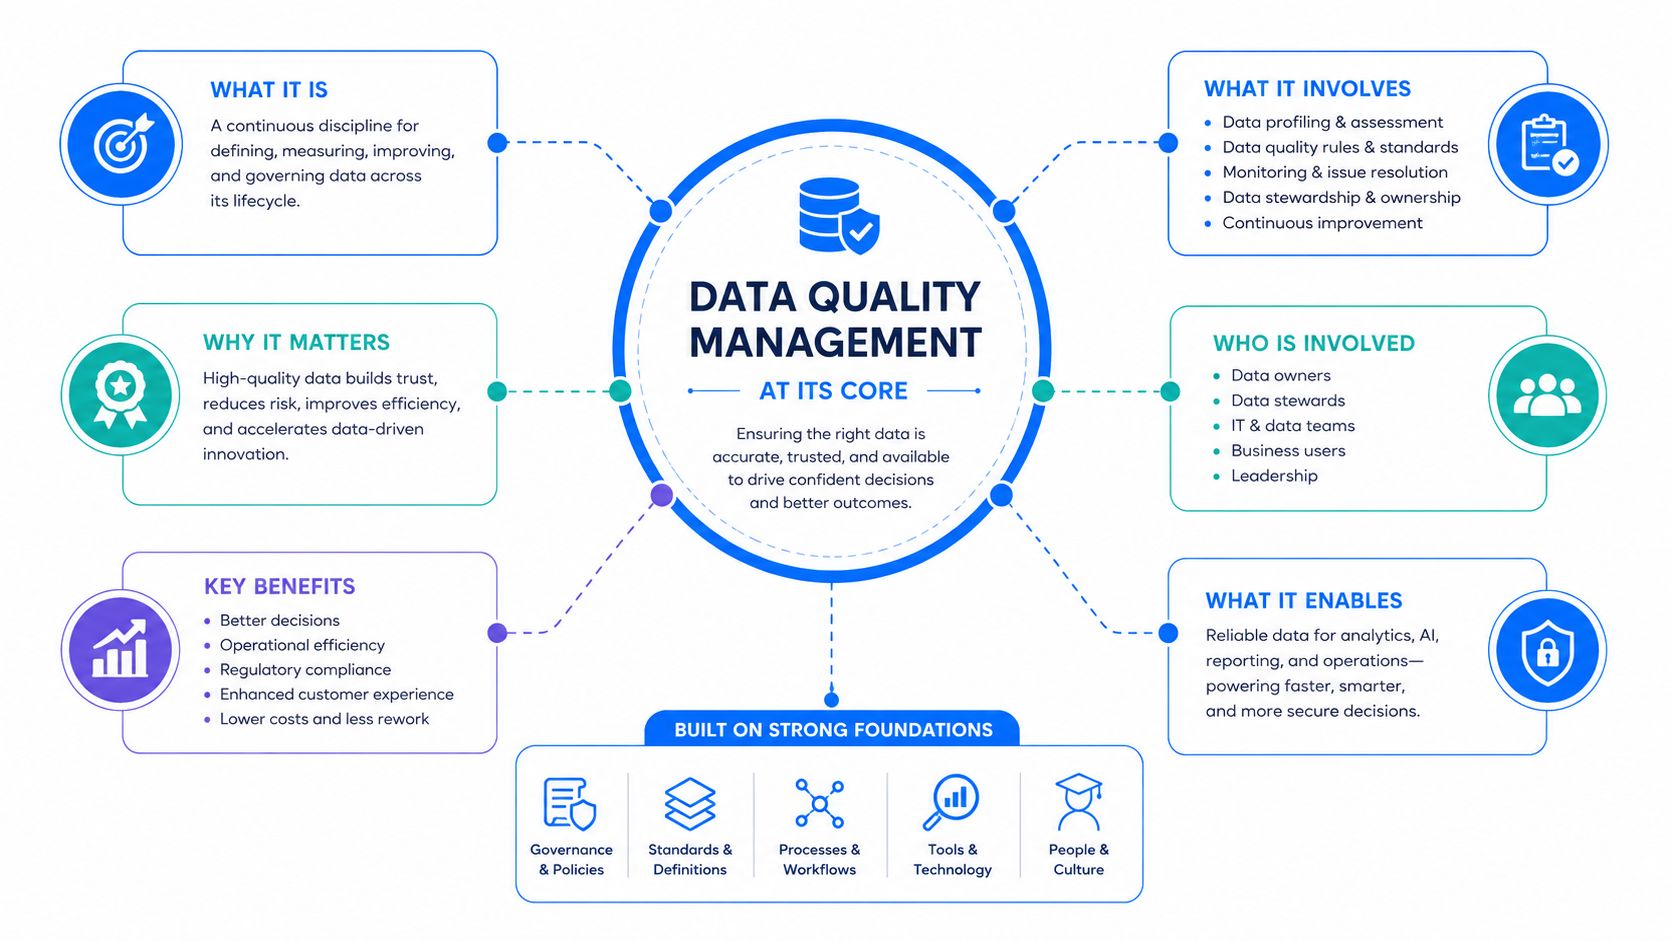
Data quality management is the continuous practice of measuring, controlling, and remediating data against defined standards throughout its lifecycle. That lifecycle begins at ingestion, continues through transformation and storage, and ends when a report, model, application, or operational process uses the data.
The boundary between DQM and adjacent disciplines matters:
Data governance defines policies, ownership, permitted use, and decision rights.
Data observability surfaces signals about freshness, volume, schema, and behavior.
DQM converts those expectations into executable controls that detect defects and support remediation.
The relationship is operational. Governance may require a customer identifier to be unique and available before billing runs. Observability can show that table volume changed unexpectedly. DQM applies the uniqueness and completeness rules, records the exception, and routes it to an accountable owner. This comparison of data quality and data governance clarifies the boundary.
Measure the flow, not only the endpoint
Manufacturing quality control offers a useful comparison. Statistical process control on the production line catches defects before a product leaves the factory. Inspecting finished products at the loading dock still identifies problems, but it cannot prevent wasted materials, rework, or a defective shipment already in transit.
Data quality controls belong at ingestion, transformation, and consumption boundaries, not only in the final dashboard. A record can satisfy the schema while arriving late, omitting required values, appearing more than once, or disagreeing with a related system. The control point should match the failure mode and the cost of discovering it later.
Replace cleansing projects with operating controls
A cleansing exercise produces a snapshot. It can standardize values, remove duplicates, and repair known defects, yet those defects return when the source process changes. DQM provides the always-on controls that test whether data remains fit for its intended use.
In regulated environments, controls should run inside the customer's database whenever the architecture permits. Rules and anomaly checks evaluate live tables, preserve local context, and reduce unnecessary data movement. The trade-off is that teams must manage query cost, permissions, and rule ownership in the same operating environment. That discipline makes exceptions easier to trace because the responsible team can review the table's behavior, history, and failures where the protected data already resides.
Core Dimensions and the KPIs That Prove Quality
A DQM program needs dimensions that people can measure and act on. Six provide a practical baseline, but the threshold must reflect the dataset's use. A completeness target for an optional marketing attribute shouldn't be treated like a completeness target for a regulatory field.
Dimension | KPI | Typical Threshold | Accountable Role |
|---|---|---|---|
Accuracy | Match rate against a trusted source or expected distribution | 99.5% on critical fields | Data steward |
Completeness | Null and default-value rate per column, segmented by data tier | Near-zero for required critical fields | Source system owner |
Consistency | Cross-system reconciliation rate, such as customer IDs matching between CRM and billing | All critical reconciliations resolved before reporting | Integration team |
Timeliness | Lag between event time and available time | Minutes for operations, up to 24 hours for reporting | Platform team |
Validity | Conformance to schema, regex patterns, and enumerated value lists | All mandatory rules pass | Engineering |
Uniqueness | Duplicate rate across natural and surrogate keys | No unexplained duplicates on critical keys | MDM team |
The accuracy measure needs a reference point. Compare critical values with a trusted source, an approved golden record, or an expected distribution. The data steward should own the definition of “trusted,” because engineers can calculate a match rate without knowing whether the reference itself is fit for purpose.
Completeness should be segmented by column and tier. A null rate can hide behind an acceptable table average, while a single critical field is missing across a meaningful slice of records. Source owners must fix collection and upstream defaults, not ask analysts to patch the reporting layer.
Consistency exposes conflicts between systems. Customer identity matching between a CRM and billing platform is a straightforward example, but the same logic applies to product, account, provider, and location data. Integration teams own the mapping and reconciliation contract.
Timeliness measures whether information arrives in time for the decision that depends on it. A technical paper from the EDM Council's global data management benchmark describes timeliness as a normalized value in the range (0,1], with values closer to 1 representing better freshness. That framing is useful because a record can be correct in content yet unusable after the decision window has closed.
Validity and uniqueness complete the control set. Engineering owns format and permitted-value rules, while MDM teams own duplicate resolution. Don't optimize validity in isolation. Perfectly formatted data that arrives late, or fresh data containing duplicate business keys, still creates operational risk.
For a broader set of implementation-oriented measures, use this guide to data quality metrics.
Governance and the Operational Workflow Around Quality
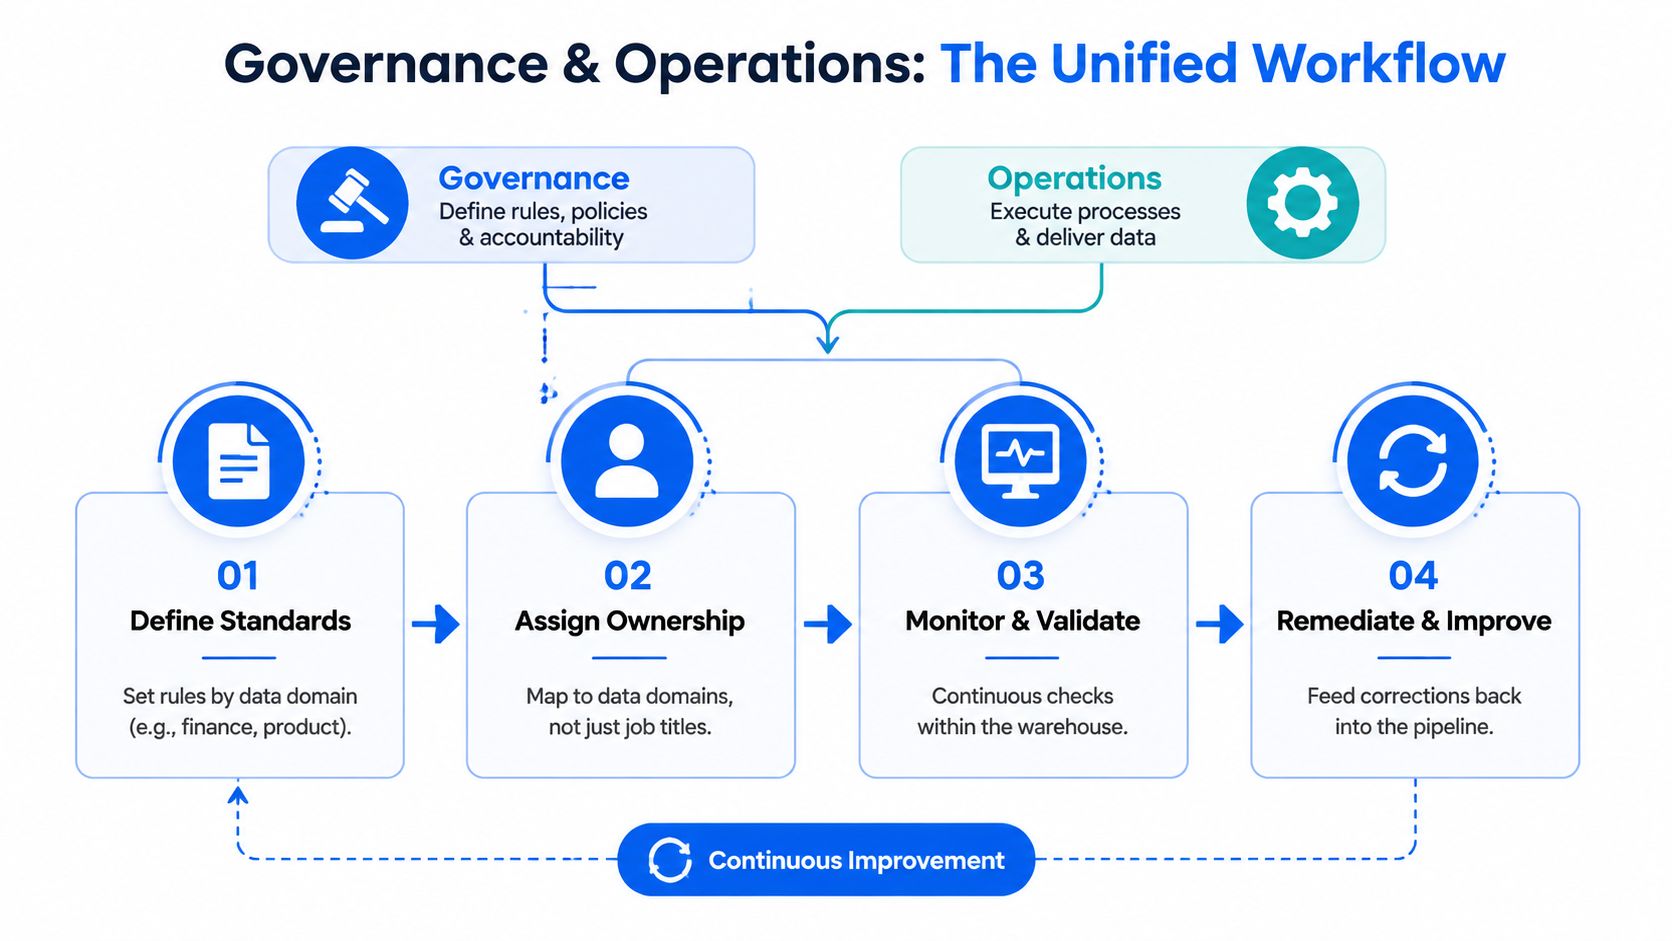
Governance and operations fail when they live in separate meetings. A policy that doesn't produce a check is documentation. An alert without an owner is noise.
Assign accountability by data domain, not only by job title. A finance analyst can own the revenue tables, a clinical informaticist can own patient records, and a product manager can own behavioral events. Their responsibilities differ, but each needs authority to define acceptable values, approve thresholds, and request source-system changes.
Build a policy catalog
Each domain owner should maintain a versioned catalog containing:
Business rules: What values, relationships, and states are permitted.
Thresholds: How much deviation is acceptable before intervention.
Freshness SLAs: When data must arrive for each consuming process.
Evidence requirements: What logs, results, and approvals an audit or incident review needs.
Incident routing should reflect business impact. A P1 can break executive reporting or a regulated process. A P2 can corrupt a single domain. A P3 can reduce confidence without creating immediate operational harm. These categories matter because they stop every exception from waking the entire data team.
Run a shared response loop
Stewards monitor dashboards, review exceptions, and tune policies. Engineers place validation and anomaly checks at ingestion and transformation points. Governance committees review recurring patterns, unresolved ownership, and trend metrics instead of investigating every individual alert.
The data governance strategy guidance is most useful when translated into this operating loop. In practice, digna's anomaly detection and timeliness monitors run in-database against source tables, while schema tracking flags structural drift when it occurs. The platform's role is to provide signals and evidence. The organization still needs owners who can decide whether to reject, quarantine, repair, or accept an exception.
An Implementation Roadmap That Ships
DQM programs stall when teams monitor everything before proving that someone will respond to an alert. A workable roadmap starts with the tables where bad data can interrupt a regulated process, distort executive reporting, or affect an ML model.
Inventory critical tables first. Assess accuracy, completeness, consistency, timeliness, validity, and uniqueness, then rank each asset by business impact. Run continuous controls inside the customer's database where possible. This keeps checks close to the source, avoids a separate data-movement path, and preserves evidence for investigation.
Phase | Duration | Key Deliverables | digna Modules Used |
|---|---|---|---|
Assessment and prioritization | Defined by the delivery team | Critical-table inventory, dimension assessment, business-impact ranking | Data Analytics, Data Catalog |
Quick wins | Defined by the delivery team | Null checks, duplicate detection, freshness monitoring for priority tables | Data Validation, Timeliness |
Control expansion | Defined by the delivery team | Schema tracking, distribution monitoring, cross-system contracts, incident routing | Schema Tracker, Data Anomalies, Data Validation |
Scale-out | Defined by the delivery team | Reusable templates, domain onboarding, operating reviews | Selected modular combination |
Start with controls people can trust
The first release should target failure modes that teams can explain and resolve. Enable required-field checks, duplicate detection, and freshness monitoring on the highest-risk tables. Prioritization matters more than broad coverage. A control that receives a response is more valuable than a larger rule set that produces unattended exceptions.
Once those checks operate reliably, formalize ownership. Publish SLAs, name stewards, define escalation paths, and test the process with real exceptions. A timeliness breach on a regulated table should reach its responsible owner, rather than a general channel where no one is accountable.
Add advanced controls after the response loop is working. Schema tracking can flag added or removed columns and datatype changes. Anomaly detection can identify shifts in row counts or distributions. Validation rules can enforce cross-system contracts, especially when one domain's transformation depends on another domain's data.
Start narrow enough that every alert receives a response. Expand only after the response loop works.
Scale through templates after the controls have proved useful. A finance pattern for freshness and key uniqueness may guide another domain, but copying it without review creates thresholds that do not match the local process. Each owner should confirm the rule's business meaning and set its threshold around the asset's decision window.
Teams assessing rollout options can use this data quality implementation roadmap as a starting point, then adapt the sequence to their warehouse, lake, or pipeline architecture. The practical test is simple: prioritize the data with the highest operational consequence, keep monitoring close to the source, and expand only when ownership and response are visible.
Common Failure Modes and the Remediation Patterns That Work
The most damaging failures are often the ones that pass a basic pipeline check. A job can report success while its output has the wrong shape, the wrong arrival time, or an unexpected distribution.
Failure Mode | Symptom | Remediation Pattern | digna Module |
|---|---|---|---|
Silent schema drift | Added, removed, or retyped fields break consumers unexpectedly | Diff the current structure against a known-good baseline and alert on changes | Schema Tracker |
Stale feed | The pipeline succeeds, but the latest business event is missing | Monitor business timestamps and expected delivery patterns | Timeliness |
Rule fatigue | Large collections of static checks produce exceptions nobody tunes | Combine deterministic rules with learned behavioral baselines | Data Anomalies, Data Validation |
Alert noise | Teams suppress or ignore repeated low-value notifications | Apply severity tiers, ownership, suppression windows, and incident grouping | User-centric dashboard |
Schema drift deserves early attention because row-count checks won't detect every structural break. A source team can add a nullable column, remove a field, or change a datatype while preserving the number of rows. Downstream SQL, BI logic, or ML features can then fail in ways that look unrelated to the source change.
Freshness monitoring must use business-meaningful timestamps. A successful orchestration task proves that code ran, not that useful data arrived. Compare event time with availability time and expected delivery behavior so a technically green pipeline can still raise a useful incident.
Static validation remains important for explicit policy violations. It becomes ineffective when teams encode every possible fluctuation as a hard threshold. Anomaly detection can surface deviations from normal distributions and volumes, but it needs ownership context and a response path. Neither approach replaces the other.
The strongest design layers controls. Schema checks catch structural changes, timeliness checks catch late or missing feeds, volume and distribution checks catch behavioral shifts, and deterministic validation enforces business rules. A shared dashboard helps responders see whether these signals describe one incident or several unrelated problems.
Industry Use Cases Across Regulated and High-Volume Data
DQM priorities change with the data's purpose. A finance team may care most about reconciliation and audit evidence, while a telecom operator may need to identify a regional ingestion problem before an operational dashboard becomes misleading.
Industry | Top Quality Priorities | Primary KPI Examples | digna Module Lead |
|---|---|---|---|
Finance | Timeliness, uniqueness, reconciliation, schema stability | Booking-key uniqueness, trade-to-risk reconciliation, delivery lag | Timeliness and Schema Tracker |
Healthcare | Identity integrity, claims validity, feed freshness | Duplicate patient identifiers, required-field conformance, arrival lag | Data Validation and Data Anomalies |
Telecom | High-volume freshness, volume stability, regional consistency | Event arrival behavior, volume shifts, regional distribution changes | Timeliness and Data Analytics |
Public sector | Auditability, completeness, consistency, exception traceability | Required-field compliance, reconciliation, documented exception status | Data Validation |
Finance needs controls across system boundaries
Trade and risk records often move through front, middle, and back-office systems. A practical control set checks booking-key uniqueness, reconciles critical identifiers across systems, and watches for changes in product master structure before P&L attribution breaks. Timeliness matters because a correct risk record that arrives after a reporting or decision window has limited value.
Healthcare needs identity and arrival discipline
Patient identity records and claims data require strong validation because duplicates and malformed identifiers can distort downstream measures. Duplicate MRNs, for example, should create a workflow for investigation rather than an invisible cleanup task. Late-arriving HL7 feeds also need timeliness alerts, particularly where operational metrics depend on a complete event sequence.
Telecom needs proximity to ingestion
Call detail records and network telemetry arrive in high volumes and can vary by region. In-database checks close to ingestion can monitor freshness and volume without creating an additional data movement process. Analytics views can then help teams isolate whether an unusual pattern is broad or concentrated in a particular operating area.
Public sector needs defensible evidence
Benefits and census data may be reviewed long after the original load. Validation rules should produce traceable results, exception ownership, and remediation history. That evidence is part of data quality, not an administrative afterthought. A control that detects an issue but can't show who reviewed it or what changed leaves the organization exposed during audit or oversight.
From Periodic Cleanup to Continuous, Trustworthy Operations
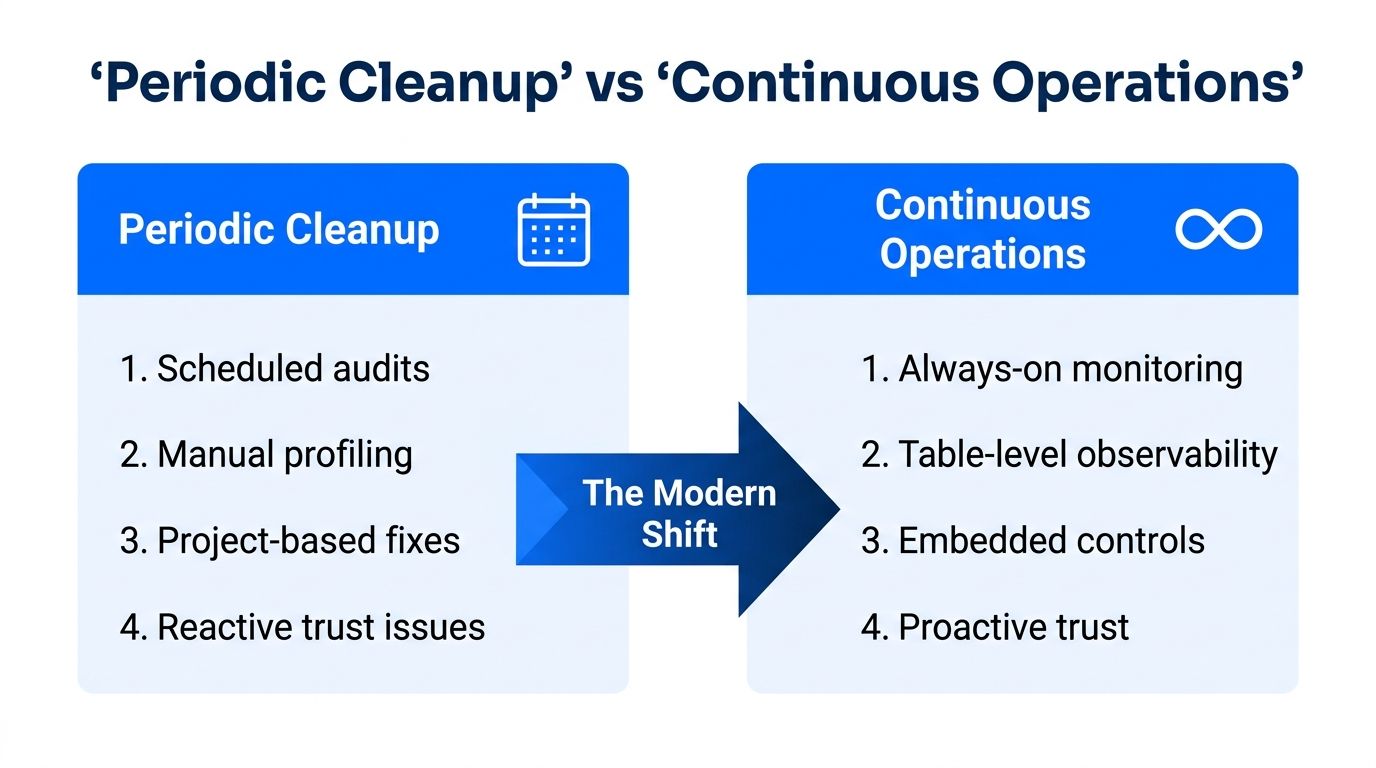
Periodic cleanup is still useful for remediation, migration, and baseline creation. It isn't an operating model. Data can break between scheduled sweeps, and unresolved ownership causes exceptions to accumulate until someone needs the data urgently.
Monte Carlo's survey evidence illustrates the operational pressure. Monthly data incidents increased from 59 in 2022 to 67 in 2023, and a later benchmark reported about one data quality issue for every 10 tables per year, compared with about one for every 15 tables in earlier measurements, as documented in Monte Carlo's data quality statistics. The implication is straightforward: table-level monitoring must run continuously in environments where schemas, freshness, and metric behavior change regularly.
A compact operating checklist
Instrument priority tables first: Begin with regulated assets, executive reporting, and ML inputs.
Assign dataset ownership: Name the person or team accountable for each critical domain.
Agree on thresholds before alerting: Stakeholders should define acceptable behavior before engineers tune notifications.
Route exceptions to one queue: Give responders a shared place to triage, assign, and document incidents.
Track detection and resolution: Monitor mean time to detect and mean time to resolve as operational signals.
Review coverage regularly: Reassess rules, baselines, and ownership during quarterly control reviews.
For 2026, three priorities deserve attention. First, codify quality SLAs as explicit contracts between producers and consumers. Second, add AI-assisted anomaly reasoning to remediation playbooks, while keeping human owners responsible for decisions. Third, treat schema and lineage as security-grade assets, with review discipline comparable to production code.
The shift isn't from manual work to automation alone. It's from uncertain data ownership to visible operational responsibility. When controls run where the data lives, teams can detect issues earlier, preserve evidence, and decide whether a dataset is fit for the process that depends on it.
digna provides in-database data quality management through anomaly detection, validation, timeliness monitoring, and schema tracking, with deployment inside your own cloud, VPC, or data center. Visit digna to evaluate a focused monitoring plan for your highest-stakes tables and build from there.
Frequently asked questions
How does data quality management differ from governance and observability?
By what it produces. Governance defines policies, ownership, permitted use and decision rights; observability surfaces signals about freshness, volume, schema and behavior; data quality management converts those expectations into executable controls that detect defects and support remediation.
What does output-only testing miss?
The cause. In one example a revenue figure was 8% understated because a billing table dropped rows after a schema rename the night before the load. Checking the output alone tells you the number looks odd; it does not tell you which change produced it.
How should a critical table be treated?
As a production service with an owner, an expected behavior and an incident path. That framing is what moves a dataset out of best-effort maintenance and into something with a defined response when it misbehaves.
What does the failure cost?
Gartner estimates organizations lose an average of US$12.9 million per year from data quality failures, while industry summaries commonly cite bad data affecting about 31% of business revenue. Those figures argue for instrumenting the pipeline rather than inspecting the output.
Where should a roadmap start?
With the datasets whose failure has consequences, then working through standards, executable controls, measurement and remediation for those first. A roadmap that begins with estate-wide coverage usually produces a backlog instead of a control.


