Tsql Query Optimization: A Practical Performance Guide
|
7
min read

A slow SQL Server query usually doesn't show up with a neat explanation. It lands in production as a dashboard that times out, a stored procedure that used to be fine, or a report that only fails when the right customer or date range hits it. That's why tsql query optimization works best when it starts with evidence, not with a rewrite.
Table of Contents
Reading Execution Plans and Understanding Optimizer Behavior
Rewriting Queries with Set-Based Patterns and Early Filtering
Addressing Memory Pressure and Platform Resource Constraints
Implementing Continuous Monitoring with In-Database Observability
Starting with Diagnostics Before Rewriting Anything
The fastest way to waste time is to change SQL before you know what's slow. In production, a query can look guilty while the issue is shared contention, stale statistics, or a bad plan cached from a different parameter value. A disciplined tuning pass starts by capturing the exact workload, including the actual parameters, and measuring the query before anything changes.
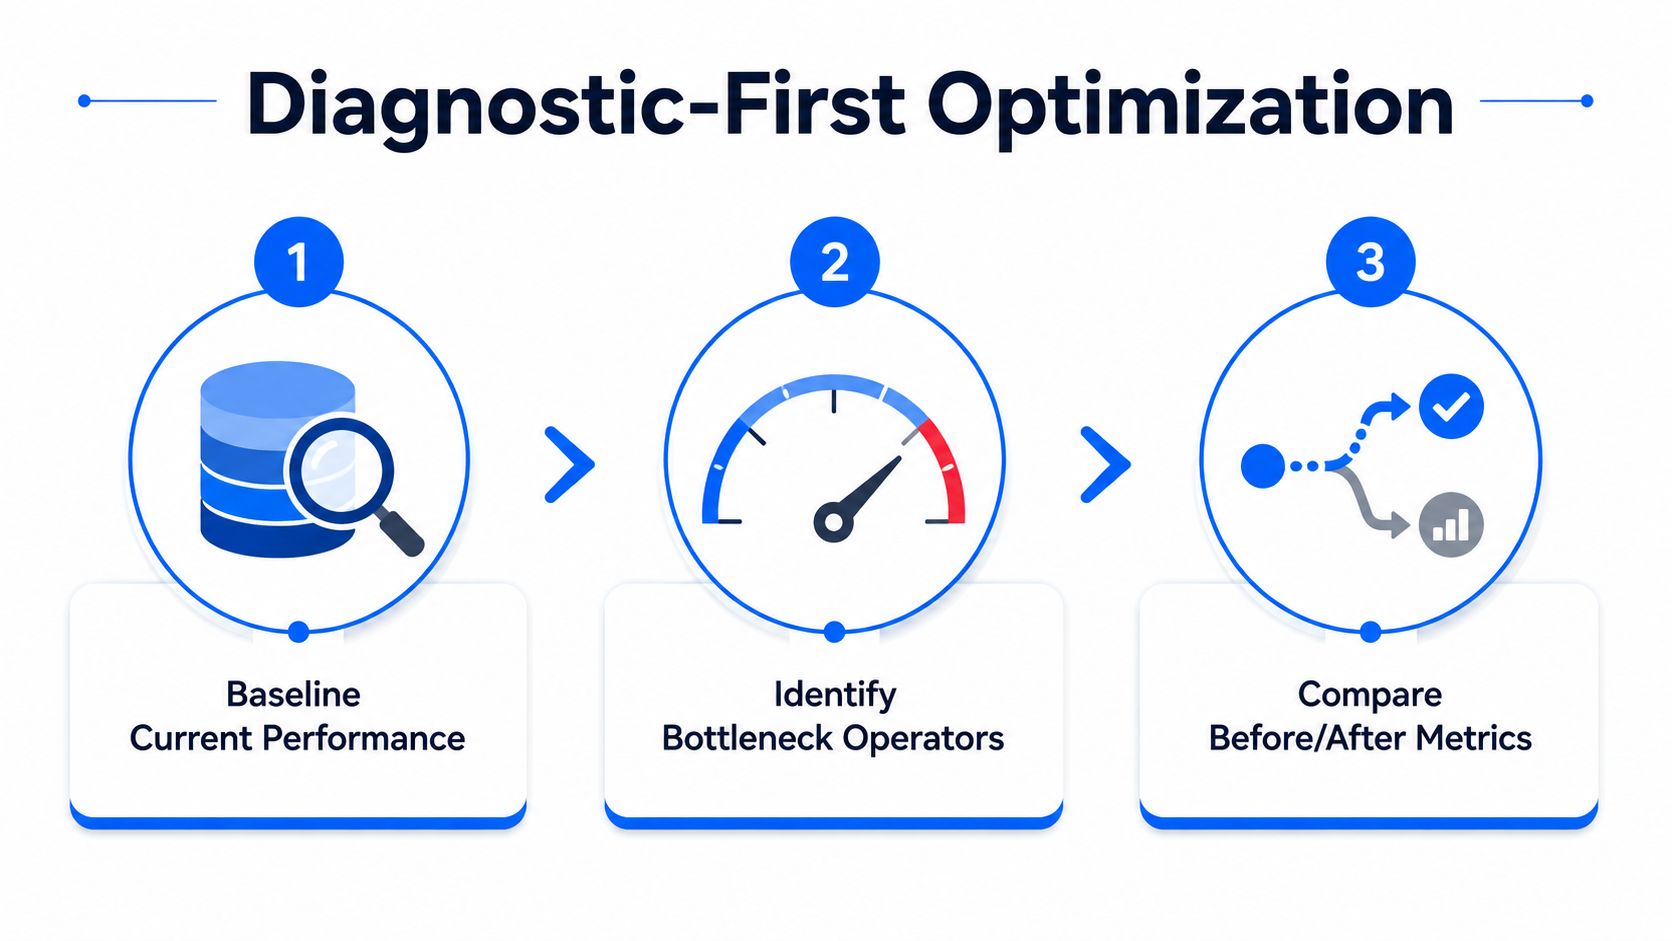
Baseline first, then touch the SQL
The baseline is not optional. A practical tuning loop starts with execution time, logical reads, and CPU, then captures the plan and the surrounding workload so you can tell whether a change helped or just moved the cost somewhere else, which is the same workflow recommended in SQL Server tuning guides because it keeps cause and effect visible (tuning workflow guidance).
Practical rule: if you can't explain the bottleneck operator before the rewrite, you probably don't understand the problem yet.
That's especially true when the symptom is slow response time but the cause is outside the statement text. Server-level wait analysis, queue correlation, and then database or query-level inspection is the sequence that avoids chasing the wrong thing, because the workload may be blocked by I/O, memory, or concurrency pressure before it ever reaches your rewrite candidate (instance-to-query tuning sequence).
Change one thing at a time
One-variable-at-a-time tuning sounds slow, but it's the only way to trust the result. If you change the query text, the index, and the statistics update in the same pass, you won't know which lever mattered. Worse, a rewrite can improve logical reads while increasing CPU or making the plan more fragile under a different parameter set.
A good workflow looks like this:
Capture the exact query text and parameters. The same stored procedure can behave very differently under different inputs.
Find the bottleneck operator. Sorts, scans, and key lookups are often where the cost piles up.
Apply one targeted change. Then rerun the same workload under the same conditions.
Compare against the baseline. Recheck reads, CPU, and elapsed time before moving on.
That method sounds simple because it is. The hard part is resisting the urge to “fix” everything at once. If the query is really suffering from shared resource contention, the first useful fix may be outside the query itself, which is why experienced DBAs don't treat the SQL text as the only place to look.
Reading Execution Plans and Understanding Optimizer Behavior
A bad query often looks fine in the text editor and still falls apart at runtime. SQL Server does not execute statements in the order they are written. The optimizer is cost-based and statistics-driven, so it evaluates possible plans, estimates row counts, and chooses the path it believes will cost the least (cost-based optimizer overview). In tsql query optimization, that makes plan reading the first real diagnostic skill, not a polished afterthought.
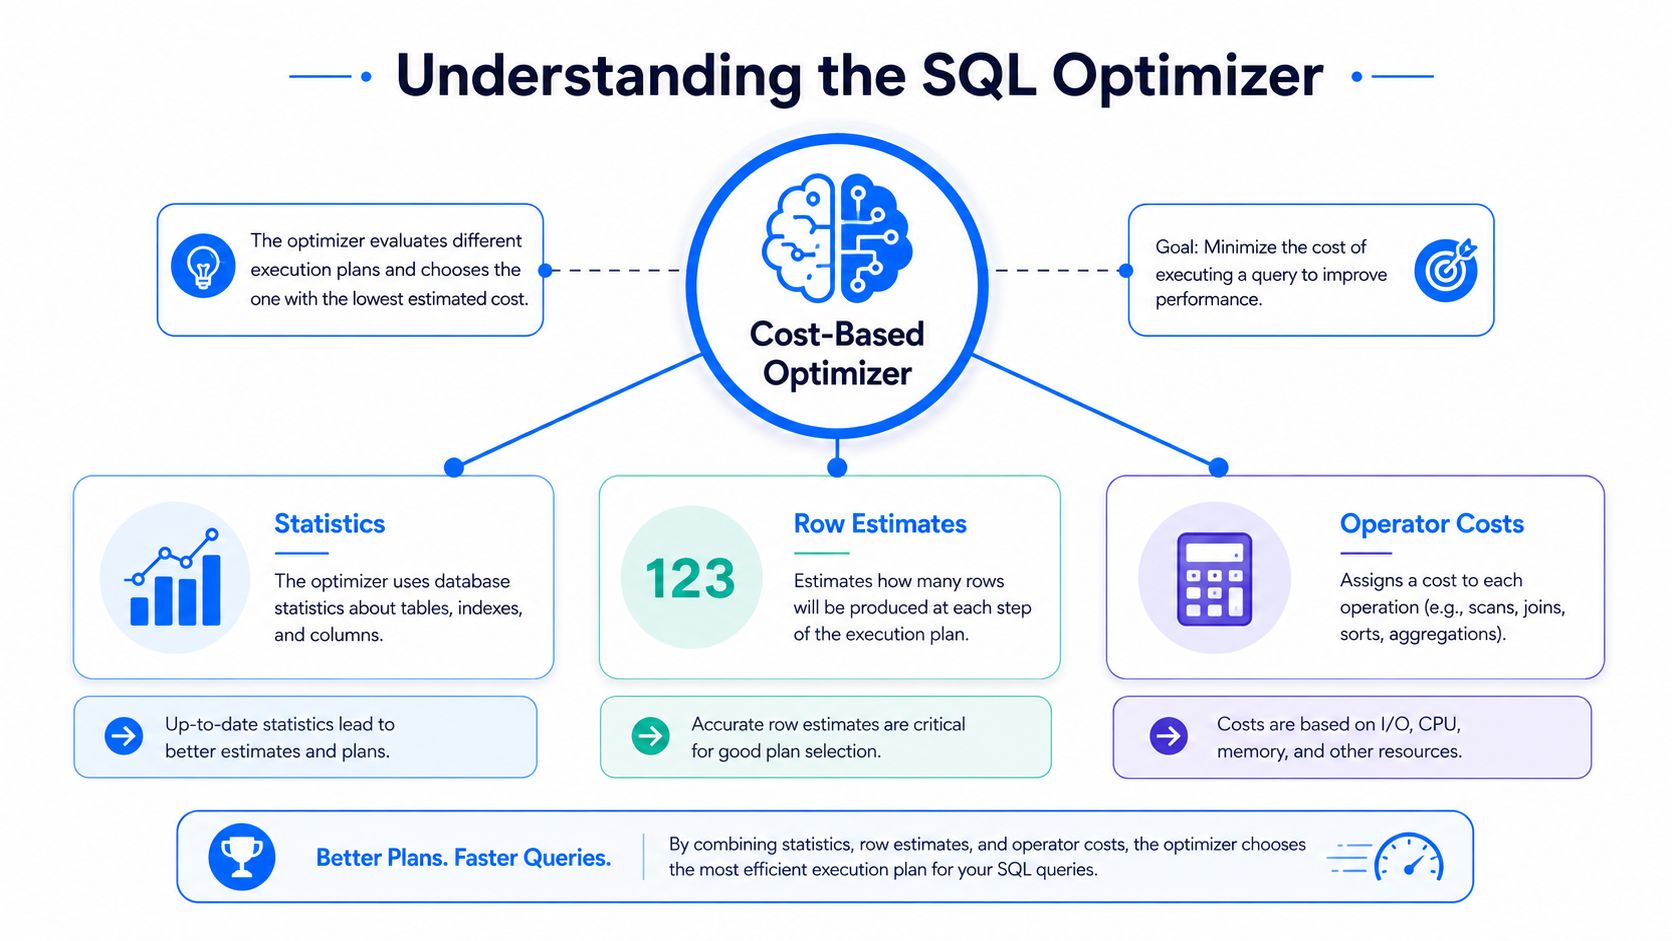
Read the plan from the leaves upward
Start at the leaves, not the root. The leaf operators show where rows enter the plan, and the most expensive leaf, often the one with the highest loops-times-time cost, usually points to the first place where the plan goes wrong. If a scan feeds a join and then a sort, the scan is often the primary problem even when the sort dominates elapsed time.
That reading habit becomes more useful when you connect it to the optimizer's inputs. DBCC SHOW_STATISTICS exposes the statistics SQL Server is using for a table or indexed view, including STAT_HEADER, DENSITY_VECTOR, and HISTOGRAM (Microsoft documentation). Those objects matter because the optimizer makes its cardinality guess before it settles on a plan. The density information is especially useful for multi-column filters on the same table, where simple row-count intuition often breaks down.
If the plan looks suspicious, I compare it with a practical tuning checklist such as how to optimize SQL queries with execution plan analysis. That kind of step keeps the review grounded in the actual operators, not just in guesswork about the query text.
Estimated rows versus actual rows
The first thing I check in a bad plan is the gap between estimated and actual rows. When those numbers diverge sharply, the optimizer is working from a distorted picture, and the rest of the plan is usually built on that mistake. A 2025 VLDB paper found cardinality estimation errors are widespread and often the dominant factor behind poor plans (VLDB 2025 paper), which matches what shows up in production when skewed distributions or correlated predicates push the engine toward the wrong join or access method.
If the optimizer thinks 10 rows are coming and 10,000 actually arrive, the plan is not slightly off, it is solving the wrong problem.
That is also why stale statistics deserve attention early. Fresh stats do not guarantee a perfect plan, but stale ones make a bad guess much more likely. For memory-optimized tables, Microsoft notes that the optimizer still maintains statistics on index key columns and may create additional statistics on non-key columns when needed, so those workloads still depend on the same cardinality picture.
Rewriting Queries with Set-Based Patterns and Early Filtering
Once the bottleneck is real and visible, rewrite the SQL with a narrow purpose. The highest-value changes are usually the ones that reduce the amount of data the engine has to touch, not the ones that make the query look clever. Filtering early, projecting fewer columns, and keeping predicates sargable all help the optimizer use indexes more effectively and lower I/O and memory pressure (optimization techniques guide).

Make the engine touch less data
The simplest wins are often the ones teams skip because they feel too basic. Avoid SELECT * when the query doesn't need every column, because extra projected columns widen rows and increase I/O. Put selective filters in the WHERE clause before joins when you can, because that lowers the join volume the engine has to carry through the rest of the plan.
A few patterns consistently matter:
Use sargable predicates. If the predicate can't be matched efficiently to an index, the optimizer has less room to work.
Prefer
UNION ALLwhen duplicates don't need to be removed.UNIONadds sorting or deduplication work.Trim subqueries that only reformat data. Nested logic that doesn't reduce rows often adds overhead without helping the plan.
Match indexes to real filters. A targeted index helps when it aligns with the access path the query uses.
A good rewrite reduces work the optimizer has to consider, not just the lines of SQL you had to read.
Use row goals and hints with restraint
Microsoft documents query hints that can alter execution behavior, including row-goal behavior, where after the first specified number of rows are returned the query keeps running to produce the full result set (query hints documentation). That can be useful when fast initial output matters more than total throughput, but it changes the optimizer's trade-off. A plan that's great for a tiny result set may be a poor choice for a large one.
That's why I treat hints as a last-mile correction, not a first response. If the query still drags after early filtering and set-based cleanup, the next question is usually whether the access path is fighting the data shape or the statistics behind it.
Index Design and Statistics Maintenance Strategies
Indexes aren't magic performance switches. They're inputs to the optimizer's cost model, and they only help when they fit the query pattern and the data distribution. If the access path doesn't match how the query filters, joins, or projects columns, the engine can still choose a scan, a lookup-heavy plan, or a spill-prone sort.
Design for the query you actually run
The best index for theory and the best index for production are rarely the same thing. In practice, you want indexes that match the most expensive and repeatable access patterns, especially the filters that show up in your slowest queries. A covering index can remove key lookups when the query needs a small, stable set of columns, but it can also add write overhead and storage cost, so the design needs a real workload, not a guess.
Microsoft's statistics model matters here because the optimizer estimates cardinality from those objects before selecting a plan (DBCC SHOW_STATISTICS). If the stats are stale, even a well-built index can be ignored or misused. That's why good index design and good statistics maintenance travel together.
Keep statistics fresh enough to trust
Statistics maintenance isn't housekeeping, it's part of plan quality. When row distributions shift, the optimizer may still think the table looks the way it did yesterday or last month, and that stale picture can cause bad join choices, poor access methods, and unexpected memory use. For memory-optimized tables, Microsoft still maintains stats on index key columns and may add more on non-key columns when needed, which shows how central statistics remain across storage models.
A practical maintenance stance is simple:
Update stats when plans regress. Don't wait for the problem to become systemic.
Watch for repeated key lookup patterns. They often show where a covering index would help.
Use rebuilds and reorganizations for a reason. Maintenance should support the workload, not happen on autopilot.
Review index usage regularly. An index that looked smart six months ago may be dead weight now.
Missing index suggestions can help you spot obvious gaps, but they're not a design strategy by themselves. I treat them as hints, then compare them to the workload and the maintenance cost. The optimizer can only choose from the shapes you give it, and stale stats can make even a good shape look bad.
Solving Parameter Sniffing and Plan Forcing Challenges
Some of the worst production surprises aren't about query text at all. They happen because the same stored procedure gets very different plans depending on the first parameter value the optimizer sees, and then that plan gets reused for later calls that don't match the original shape. That's why parameter-sensitive plan behavior belongs near the top of any serious tsql query optimization playbook.
When the cached plan is the problem
Microsoft's Azure SQL guidance explicitly calls out RECOMPILE, OPTIMIZE FOR, OPTIMIZE FOR UNKNOWN, plan forcing, and splitting procedures as targeted remedies when one query performs well for some parameter values and badly for others (Microsoft training guidance). That matters because the query text may be fine, but the cached plan can be wrong for the current workload.
The practical symptom is familiar. The procedure flies for one customer, crawls for another, and flips back and forth after cache changes or restarts. In that case, the optimization problem is really about controlling plan variability, not rewriting a perfectly readable query into something unmaintainable.
Pick the remedy that matches the failure mode
RECOMPILE is useful when the query needs a plan adapted to the current parameters and the overhead is acceptable. OPTIMIZE FOR is better when you know a representative value and want to bias the plan toward it. OPTIMIZE FOR UNKNOWN can be a safer middle path when no single parameter value reflects the workload well. Plan forcing helps when you've already identified a plan shape that behaves reliably.
The right fix for parameter sniffing isn't always a better index. Sometimes it's a more honest plan choice.
Newer operational controls matter too. Microsoft's modern guidance includes DISABLE_RESULT_SET_CACHE, which shows how query tuning now has to account for cache behavior as well as indexing and rewrites. That's a useful reminder that inconsistent performance is often about the interaction between data, cache, and parameter values, not just the SQL itself.
Addressing Memory Pressure and Platform Resource Constraints
A query can be well written, correctly indexed, and still slow. When that happens, the bottleneck is often memory pressure, spill-to-disk behavior, or broader platform limits rather than the query text itself. A lot of tuning guides skim past that reality, even though it is often the reason a “fixed” query still disappoints.
Separate local query cost from shared resource pressure
Start with wait analysis and resource monitoring before blaming a single statement. A query that spills to disk, competes for memory grants, or runs into tempdb contention can look like a bad rewrite candidate when the deeper issue is system pressure. Microsoft's guidance on query processing and Azure SQL observability points toward tools such as resource monitoring, Database Watcher, Query Performance Insights, and Fabric capacity metrics to see whether the workload is constrained by the platform itself (platform observability guidance).
If the whole instance is under pressure, a local SQL rewrite can look ineffective even when it is doing exactly what it should.
That is why wait types matter. They show whether the bottleneck is CPU saturation, I/O delay, concurrency blockers, or something else entirely. A query that trims logical reads but still spills can improve one number while leaving the user experience almost unchanged.
Escalate to capacity planning when the workload says so
At some point, query tuning stops being the right lever. If the workload keeps fighting memory, storage, or concurrency limits, the fix may be capacity planning, workload isolation, or platform redesign rather than another rewrite. That is the practical difference between solving a statement-level problem and solving a system-level problem.
For teams working in managed environments, that distinction matters even more because the platform can hide some of the underlying pressure until the workload gets noisy. If your fixes keep shaving a little cost off the query but users still feel the slowdown, the next question is not what SQL to tweak, it is what shared resource is still saturated. That is also where a database reliability engineering approach helps, because it ties query behavior to repeatable operational checks and keeps memory-related regressions from being treated as one-off surprises. See database reliability engineering practices for the broader operating model behind that kind of work.
Implementing Continuous Monitoring with In-Database Observability
One-off tuning is useful, but it doesn't stop the next regression. Data grows, distributions shift, workloads drift, and the plan that worked last quarter can age badly without warning. That's why continuous monitoring is the only sane way to keep query performance from becoming a recurring fire drill.

Watch for drift before users do
The useful shift is from reaction to detection. In-database observability platforms can monitor query performance metrics, execution pattern changes, and timeliness signals without moving data outside the environment, which matters when security or governance rules make data movement expensive or undesirable. digna's Data Platform Observability is one example of that model, with monitoring that stays inside the customer's environment and tracks workload health, consumption patterns, and performance-related metrics across the data environment (digna data observability).
That kind of baseline-driven monitoring is valuable because it spots abnormal behavior before the dashboard fails or the SLA is missed. The point isn't to replace tuning. It's to make tuning proactive instead of reactive.
Use observability to close the loop
Continuous monitoring makes the earlier diagnostic workflow stick. Instead of diagnosing a slowdown once and forgetting it, teams can compare new behavior against the old plan, catch regressions early, and keep the workload close to the baseline that was proven in production. digna also publishes a SQL query optimisation guide that aligns with this pattern, focusing on real parameters, execution plans, bottleneck nodes, stats refresh, and plan comparison.
That's the part I like operationally. Query-level fixes are real, but they decay unless someone keeps watching the workload after the change ships. Observability turns that into a routine, not a rescue mission.
If you're dealing with a slow stored procedure, a plan that keeps changing, or a query that looked fixed until the data shifted again, visit digna and evaluate whether in-database observability can give you the baseline, anomaly detection, and workload monitoring you need to keep performance stable. The right tuning process doesn't end at the rewrite, it keeps watching the system so the next regression doesn't surprise your team.
Frequently asked questions
What should you do before rewriting a slow query?
Measure. The fastest way to waste time is to change SQL before knowing what is slow, and the baseline is not optional because without it you cannot tell whether the rewrite helped or moved the problem.
When do you actually understand the problem?
When you can explain the bottleneck operator before the rewrite. If you cannot name which operator dominates the plan and why, any change you make is a guess dressed up as optimization.
Why can a slow query have nothing to do with its text?
Because the symptom is response time while the cause may sit outside the statement. Blocking, parameter sniffing, stale statistics or resource contention all present as one slow query while the SQL itself is fine.
What does the execution plan tell you that timing does not?
Where the work happens. A total duration says the query was slow; the plan shows which operator consumed the effort, which is the difference between knowing something is wrong and knowing what to change.
Does adding an index fix a slow query?
Only when the plan says the access path is the bottleneck. Indexes added without that evidence carry write cost and maintenance forever while leaving the original bottleneck untouched.



