How Do You Optimize SQL Queries: A Complete Guide
|
8
min read

You're staring at a dashboard that used to load fast, and now it drags long enough for someone to ask if the database is down again. The reflex is familiar, add an index, rewrite a join, maybe blame the warehouse. The queries usually don't need more guesswork, they need a proper diagnostic loop, a clean read on the plan, and a hard look at the trade-offs behind every “fix.”
Table of Contents
The SQL Optimization Mindset Before You Touch a Query
Why the mindset matters more than the first fix
Profiling Queries and Reading Execution Plans
What to look for in the plan
Index and Schema Strategies That Move Performance
Choosing indexes with intent
How to judge whether an index is worth it
Query Refactoring Patterns for Real Performance Gains
Small rewrites that usually pay off
Before and after in practice
Statistics and Maintenance Practices That Prevent Regressions
What maintenance really protects
A lightweight operational checklist
Engine-Specific Tips and Testing Strategies You Can Trust
How testing should differ by environment
A practical validation sequence
Putting It All Together Into a Sustainable Optimization Practice
The SQL Optimization Mindset Before You Touch a Query
A slow query feels urgent, but the first mistake is treating every slowdown like a schema emergency. Start with the logic that made modern SQL optimization possible in the first place, IBM System R's 1979 paper, Access Path Selection in a Relational Database Management System. That work introduced cost-based optimization, where the database estimates cardinality from table statistics, compares candidate plans, and picks the lowest-cost path instead of following fixed rules alone, a foundation still used by major systems today (IBM System R history and the 1979 cost-based optimization model).
That framing matters because query tuning is a measurement problem before it is a fix. Modern engines still compare CPU, memory, and disk I/O costs across alternative plans, which means the optimizer depends heavily on the quality of its statistics and on whether the estimates match the data it sees. If the inputs are stale, the plan can look reasonable on paper and still perform badly in production.
Why the mindset matters more than the first fix
If you start by adding indexes before you know what the plan is doing, you are guessing faster. The better question is whether the optimizer is choosing the wrong access path, the wrong join order, or the wrong scan strategy because its inputs are stale. That is also why modern tuning still centers on statistics, selective predicates, and join order, not only on throwing hardware at the problem.
For a practical refresher on SQL fundamentals before you dive into tuning, the Professional Careers Training SQL guide is a useful baseline. For keeping query work inside a broader operating model, database management best practices gives a useful frame for maintaining performance without turning every change into a one-off rescue.
Practical rule: treat every slow query as a measurement problem first. If you cannot explain the plan, you should not change it yet.
Profiling Queries and Reading Execution Plans
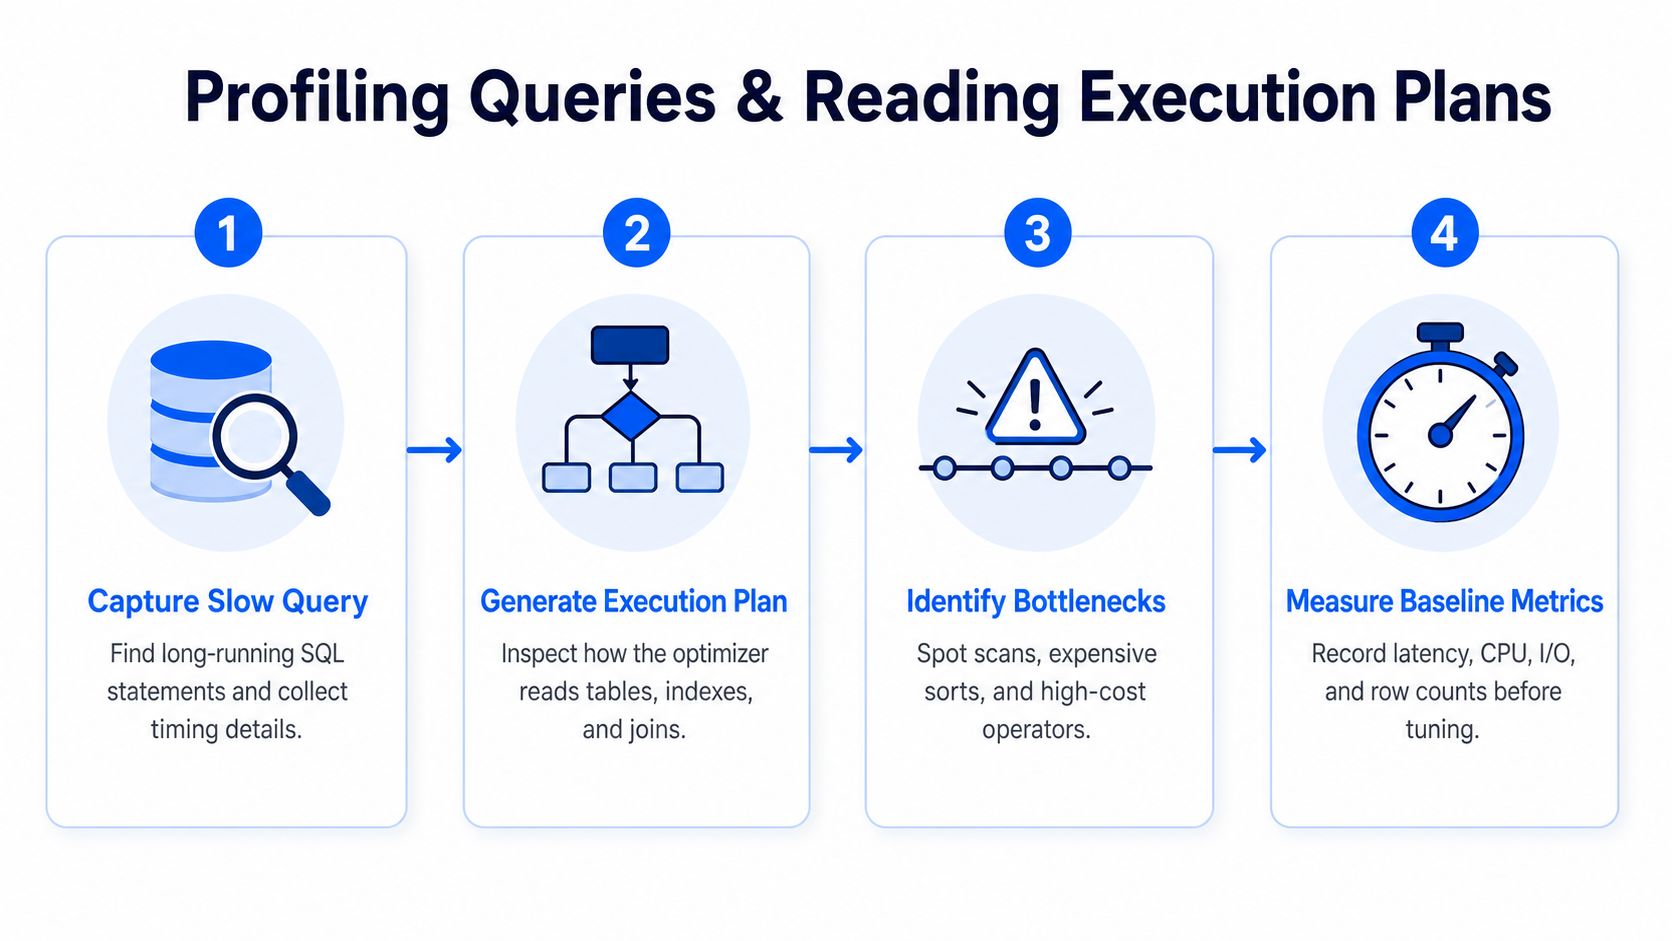
A query should never be tuned from memory. Capture the slow statement with the actual parameters, then run EXPLAIN ANALYZE so you can see what the engine did, not what the text of the SQL suggests it might do. Senior data engineers usually work in a tight loop, capture the query, inspect the actual plan, change one thing, refresh statistics with ANALYZE, then re-run and compare the new plan against the old one (practical query tuning workflow with EXPLAIN ANALYZE and ANALYZE).
The most useful shortcut is to compare estimated row counts with actual row counts inside the plan. When they're off by about 10× or more, stale statistics are often the reason the optimizer picked a bad join order or access path (estimated vs. actual row count mismatch and stale statistics guidance). That mismatch often shows up as a Seq Scan on a large table, a high-row-count Nested Loop, or a Sort on unindexed columns, which gives you a concrete place to intervene.
What to look for in the plan
Warning Sign | What It Means | Next Step |
|---|---|---|
Seq Scan on a large table | The engine is reading far more data than necessary | Refresh statistics, then add or adjust an index on the filtered column |
Nested Loop with high row counts | Join order or join method is likely wrong | Check cardinality estimates, then test a different join path |
Sort on unindexed columns | The database is sorting too much data after scanning | Reduce rows earlier, or add an index that supports the ordering |
Estimate and actual rows diverge sharply | The optimizer's model doesn't match reality | Run |
Compare the plan before and after each edit. If you make two or three changes at once, you won't know which one actually helped.
The key discipline is isolation. Make exactly one change, then retest. That keeps your observations usable and prevents “fixes” that only looked good because cache warmth, data distribution, or an unrelated rewrite changed at the same time.
Index and Schema Strategies That Move Performance
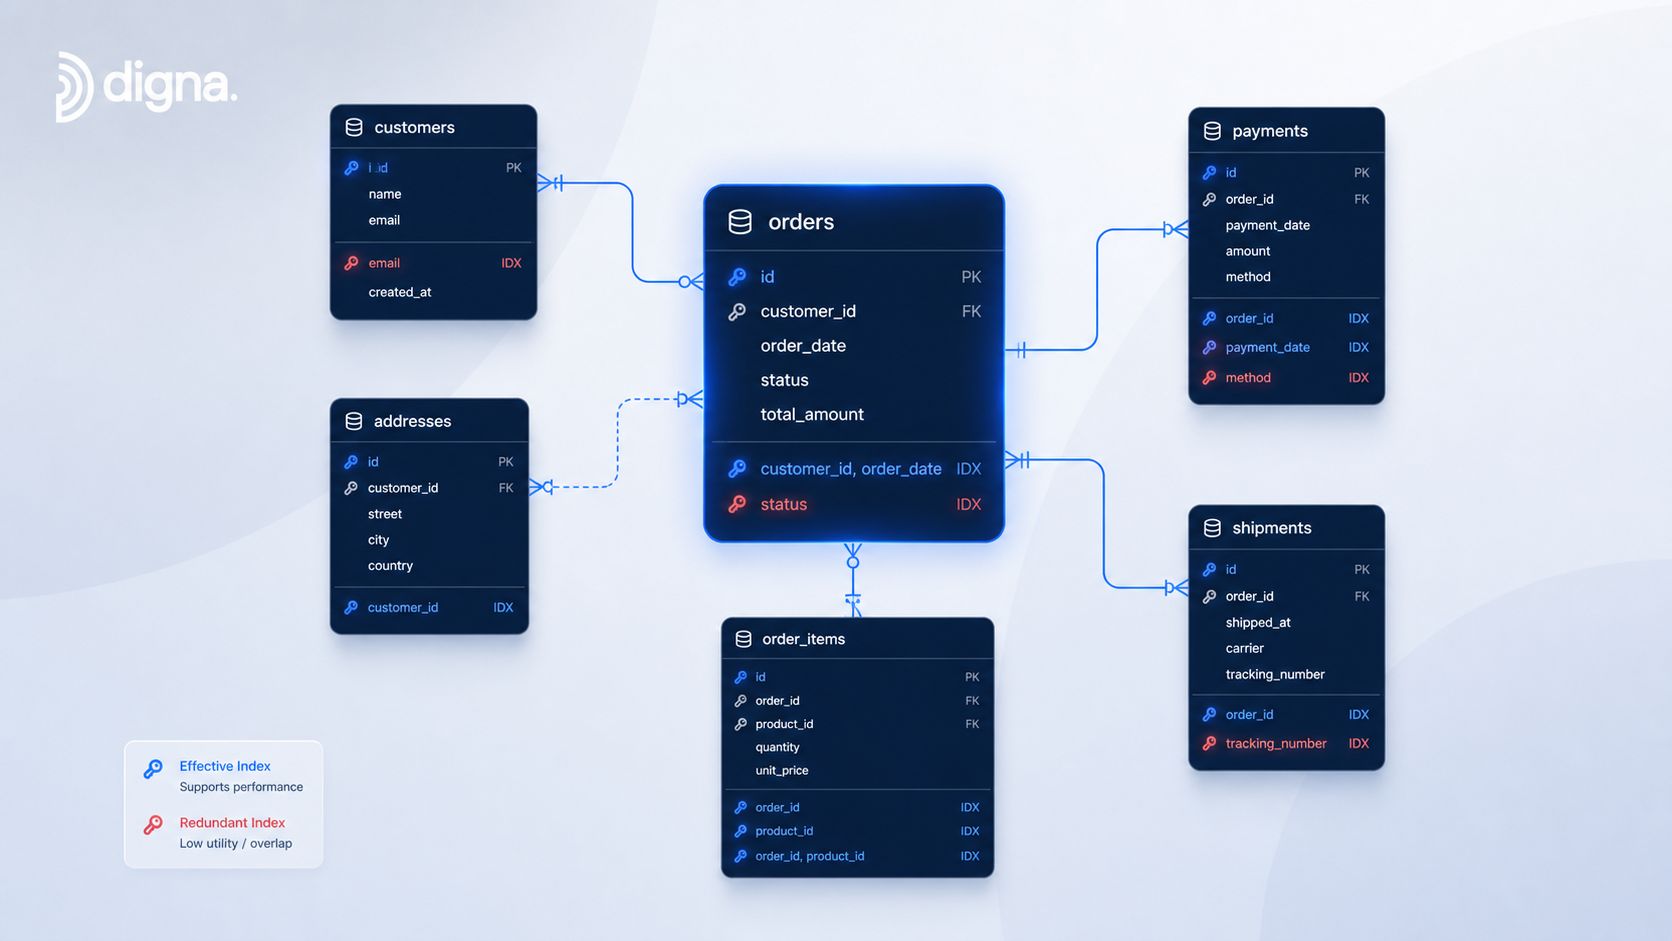
Indexes are still the most obvious tuning lever, but they are also the easiest to misuse. The common advice, “add an index on the WHERE clause,” is only half the story. The harder part is knowing when an index helps enough to justify the write penalty, because too many indexes slow INSERT, UPDATE, and DELETE operations, and most generic optimization content barely addresses that trade-off (write-heavy system trade-offs and the index overload problem).
Choosing indexes with intent
A single-column index can be perfect for one filter and useless for a join that depends on a different access pattern. Composite indexes help when your predicates line up in a predictable order, while covering indexes can keep the engine from visiting the base table at all. Partial indexes make sense when only a slice of the table is hot, and they are often cleaner than indexing everything just to rescue one slow report.
Schema design matters just as much. If a table stores the wrong data type, the optimizer has less room to reason efficiently, and if your model forces huge scans across badly shaped tables, indexes become a bandage instead of a fix. The same is true for partitioning, because a good partition boundary lets the engine skip whole chunks of data instead of filtering after the scan.
If the table design is already messy, the optimizer has to work harder than it should. Teams that plan broader schema changes often borrow ideas from star and snowflake modeling, where access patterns are clearer and joins are easier to reason about. A useful reference point is star and snowflake schema design.
How to judge whether an index is worth it
The test is not “Did the query get faster?” The key test is whether the read improvement outweighs the write cost across the workload that matters. If a table is append-heavy and mostly read once, a new index can be cheap. If the same table supports constant updates, every extra index becomes maintenance work the database must pay for on every write.
Rule of thumb: optimize the access path the workload uses, not the one that looks best in a single query screenshot.
That trade-off matters most in production systems where report latency and ingest throughput compete for the same storage and CPU. Good schema choices lower the need for emergency indexing later, which is usually the cleaner outcome.
Query Refactoring Patterns for Real Performance Gains
The fastest win is often to change the SQL itself. A concrete starting point is to avoid SELECT * and return only the columns you need, because fewer columns reduce I/O, memory use, and the amount of data the engine has to move through the plan (industry guidance on minimizing selected columns). That sounds basic, but it still shows up in production queries that drag huge payloads through joins just to discard most of them later.
Small rewrites that usually pay off
The next habit is to filter early with WHERE so the database shrinks the working set before it joins, groups, or sorts (early filtering guidance). If a condition can be applied before a join, do it there. If a subquery only exists to narrow the row set, keep it narrow before the expensive operators run.
Other rewrites are more situational, but they matter. Replace a broad join with EXISTS when you only care whether a match exists. Push predicates into subqueries when that lets the engine cut rows earlier. Avoid OFFSET for deep pagination in large datasets, especially in warehouse-style systems where skipping through rows means paying for scans you never needed.
Before and after in practice
A query like this:
SELECT * FROM orders o JOIN customers c ON o.customer_id = c.id WHERE c.country = 'DE'
often does more work than necessary. It pulls every column, then forces the engine to carry them through the join.
A tighter version looks like this:
SELECT o.id, o.order_date, c.id, c.country FROM orders o JOIN customers c ON o.customer_id = c.id WHERE c.country = 'DE'
That still isn't perfect, but it reduces the payload immediately. If only order identifiers and country are needed, don't hand the engine the rest of the row. If the same result is being paginated at scale, keyset pagination usually beats OFFSET because it avoids making the database walk through rows it's going to skip anyway.
The biggest mistake here is mixing refactors with index changes so tightly that you can't tell which move mattered. Keep the SQL shape simple first, then decide whether the remaining pain is structural or physical.
Statistics and Maintenance Practices That Prevent Regressions
A query can look healthy and still drift into bad territory when the optimizer is working from stale statistics. Cost-based optimization spread across major engines because the same basic logic travels well across systems like SQL Server, Teradata, Oracle, and PostgreSQL. The optimizer can only make a sound choice when its view of data distribution still matches reality.
What maintenance really protects
Statistics management is easy to overlook because the query still runs, just slower than before. That is usually when plans start to drift. The optimizer depends on the current shape of the data, so when distributions change and stats lag behind, it can misjudge selectivity, pick the wrong join path, or fall back to a plan that looks safe but performs poorly.
A practical maintenance cadence stays simple, even though the exact timing depends on the system. Refresh statistics after large data changes, review plans after deployments or schema changes, and watch for plan regressions in the queries that matter most. If a query that was stable starts showing a row-estimate mismatch, treat that as a maintenance signal before it turns into a user-facing incident. For teams running Snowflake in production, monitoring usage, cost, and query behavior together makes those regressions easier to spot before they spread.
A lightweight operational checklist
Update statistics regularly: Do this when data distribution shifts enough to affect selectivity, not only on a fixed calendar.
Review plans after schema changes: New columns, dropped indexes, or rewritten joins can change plan quality immediately.
Watch for estimate drift: If actual and estimated rows are no longer close, the optimizer's model is probably stale.
Document known-good patterns: Keep a note of which join paths, filters, and indexes protect critical workloads.
Retest after maintenance: A fresh
ANALYZEorUPDATE STATISTICScan change the plan in both good and bad ways, so verify the result.
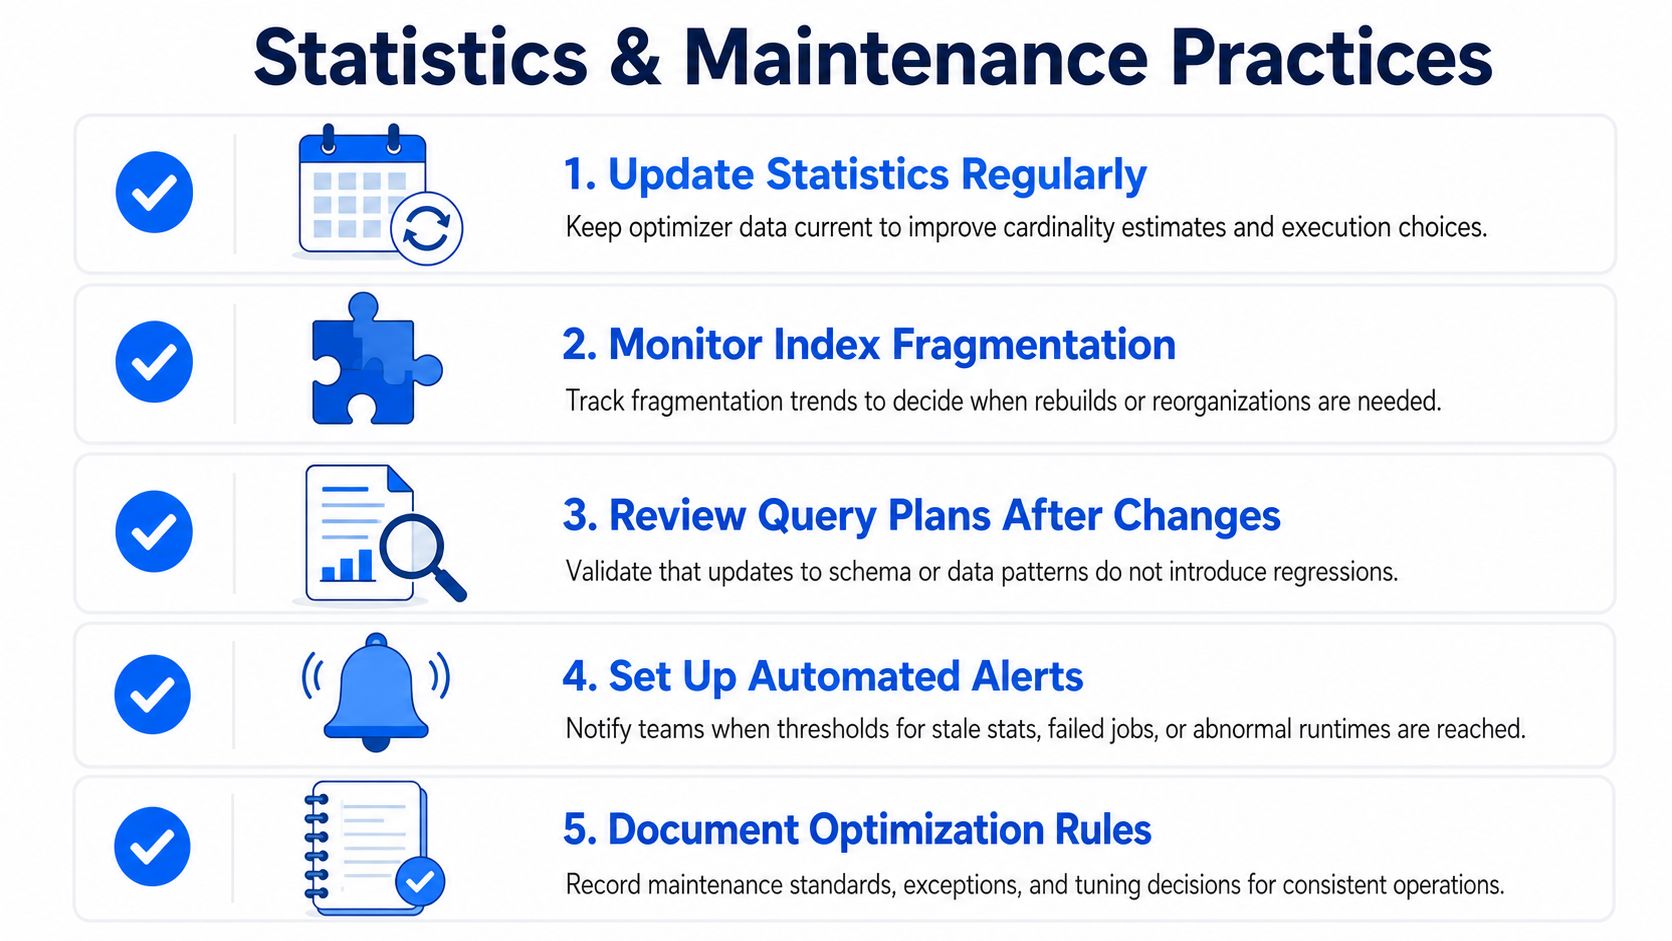
That maintenance loop keeps optimization from turning into emergency work. It also makes performance problems easier to separate from data-quality problems, because you can tell when the engine is wrong versus when the data shape has changed.
Engine-Specific Tips and Testing Strategies You Can Trust
The first rule is universal, the second layer is engine-specific. In warehouse-style systems, the priority often shifts from classic OLTP indexing to scan reduction, partition pruning, and pagination patterns that avoid brute-force reads. Recent warehouse-focused coverage keeps returning to avoiding OFFSET, using UNION ALL when it reduces work, filtering early, and leaning on platform-specific features, because cost and latency have to be balanced together when the bottleneck is large-scale analytics rather than a single hot table (warehouse-style optimization gaps and scan-cost focus).
How testing should differ by environment
A change that looks brilliant in a cached dev environment can disappoint in production. That's why the baseline has to be clean, one query, one plan, one change, then a retest under comparable conditions. If the engine supports a proper EXPLAIN or profile view, use it before promoting anything, then check the slowest operator again after the rewrite.
Across engines, the details vary. PostgreSQL often rewards careful use of index types and plan inspection. MySQL can behave very differently depending on index shape and join pattern. SQL Server has its own plan-reading habits and hints, but the point stays the same, measure the actual plan before you trust the rewrite.
A practical validation sequence
Capture the baseline query and runtime context.
Record the execution plan.
Change one thing.
Re-run under the same conditions.
Compare the slowest operator, not just the wall-clock time.
For teams working in modern cloud warehouses, that comparison should also include scan cost and data volume moved through the plan, not just elapsed time. In practice, that means choosing query shapes that reduce full-table work before they hit the expensive parts of the system.
One option that fits into a broader monitoring stack is digna's Snowflake monitoring for usage, cost, and performance, which can help teams keep an eye on workload behavior while they tune. Use tools like that to observe the workload, but still verify each SQL change directly in the database.
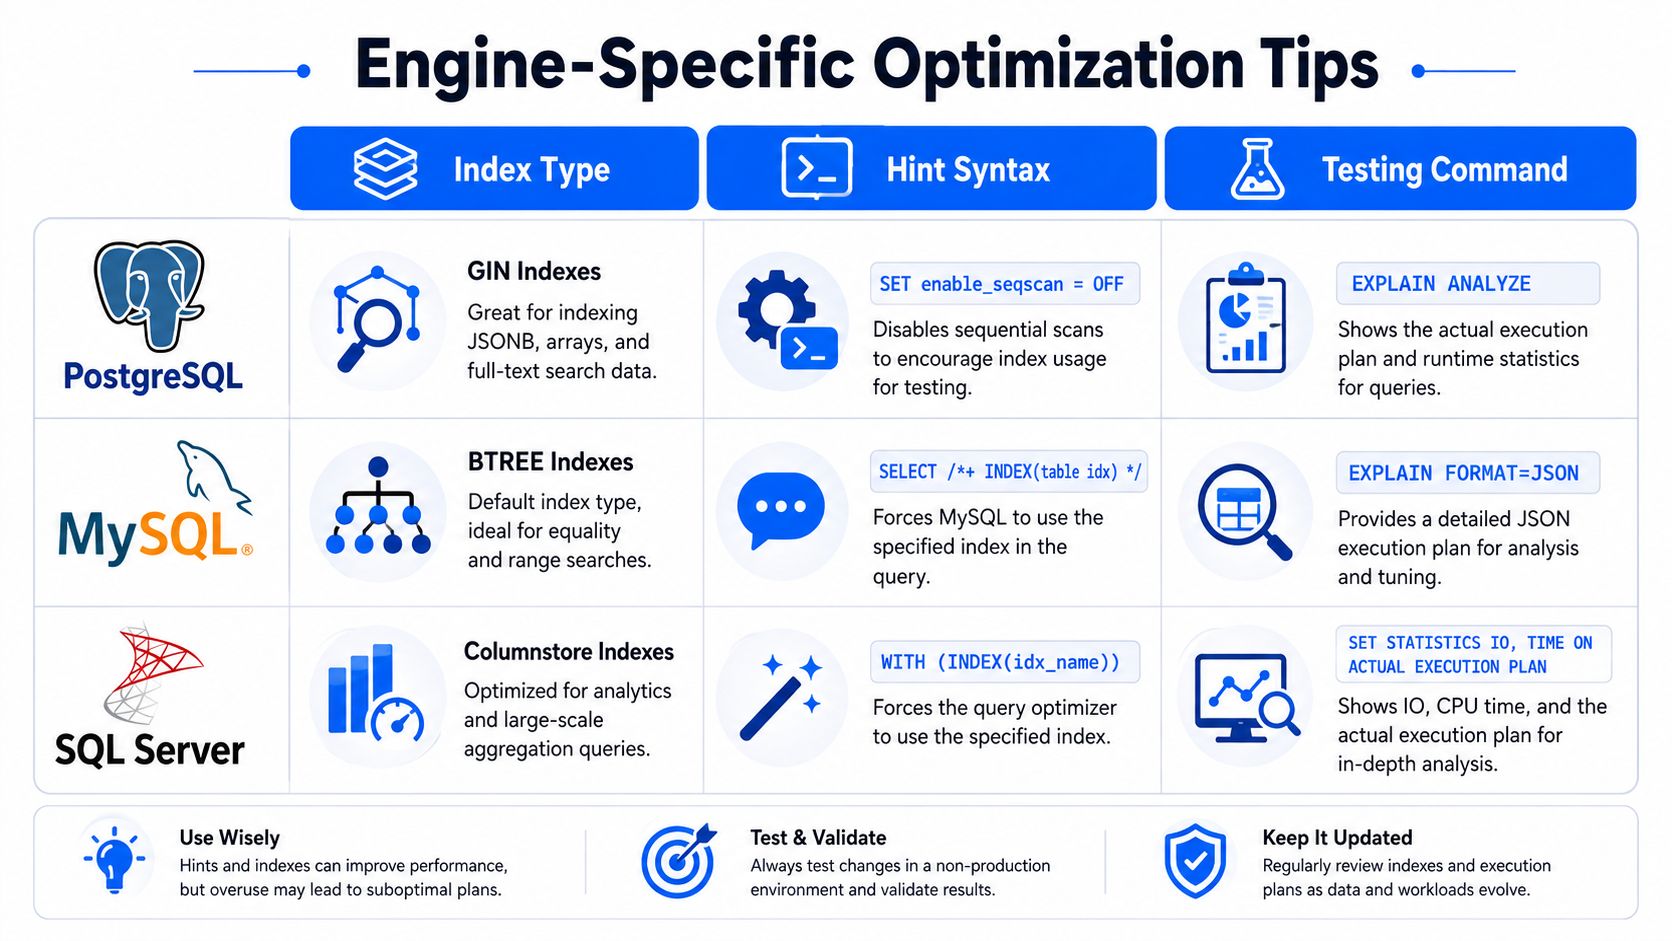
The goal isn't to memorize every engine quirk. It's to build a validation habit that survives platform differences, because the best plan on paper isn't the one you deploy, it's the one that still looks good after real traffic hits it.
Putting It All Together Into a Sustainable Optimization Practice
The cleanest way to optimize SQL queries is to treat tuning as a loop, not a hero exercise. Start with the plan, identify the bottleneck, make one change, retest, and then decide whether the issue was physical, logical, or statistical. Once you do that consistently, query work stops being firefighting and starts looking like routine operations.
The true value lies in prevention. Good indexing, careful refactoring, and regular statistics maintenance reduce the chances that one bad plan turns into a dashboard incident or a delayed pipeline. Teams that keep that discipline in place spend less time guessing and more time fixing the actual cause.
A sustainable practice also connects query health to observability. Slow SQL often shows up as stale dashboards, late reports, or pipeline delays, so the same operational mindset that protects data reliability also protects query performance. When those two areas are managed together, the whole analytics stack becomes easier to trust.
If query latency is making dashboards late or pipeline runs harder to trust, use digna to monitor the data behavior behind those failures as well as the operational signals around them. Its in-database approach helps teams watch timeliness, schema change, validation, and platform behavior without moving data out of place. That makes it a practical fit when SQL performance problems are starting to affect reliability, not just query speed.