Data Quality Improvement Playbook for Enterprise Teams
|
6
min. czyt.

A quarterly revenue dashboard can look perfectly healthy while overstating EMEA bookings for weeks. A vendor upgrade changes a source-system currency column, nulls begin flowing into the warehouse, and a downstream transformation interprets the missing values incorrectly. Finance discovers the problem during board preparation, after analysts have already circulated reports and leaders have made decisions from them.
That incident isn't primarily a dashboard problem. It's a data quality improvement failure involving schema control, timeliness, ownership, and incident response. The fix isn't another isolated monitoring purchase. It's an operating model that defines what trustworthy data means, assigns responsibility to the teams creating it, detects defects close to their origin, and measures how quickly the organization restores confidence.
Table of Contents
Why Most Data Quality Programs Stall Before They Start
The first response to an incident like the EMEA example is often predictable. Someone proposes a data quality platform, another team builds a dashboard of null rates, and a center of excellence publishes standards that producers never see. The organization creates visible activity without changing the conditions that allowed the defect through.
The tool is rarely the operating model
A quality tool can calculate metrics, execute rules, and route alerts. It can't decide whether the finance team or the commercial systems team owns the currency field. It also can't determine whether a missing value should block a load, quarantine affected records, or trigger a warning while processing continues.
That decision requires a documented contract between producers and consumers. Without it, teams debate alerts after the incident instead of agreeing beforehand on acceptable behavior. A useful review of structural causes appears in this analysis of why data quality projects fail, particularly the distinction between technical symptoms and organizational causes.
Coverage must extend beyond completeness
Null rates are useful, but a table can be complete and still be wrong. A feed may arrive late, contain a changed schema, use an invalid currency code, or introduce duplicate business keys. Teams that measure only completeness create a false sense of control because they're checking one dimension while ignoring the decision window and the meaning of the data.
A working program assigns controls to the risks that matter:
Standards: Definitions, accepted values, ownership, and change procedures.
Accountability: Named producers and stewards with authority to resolve defects.
Feedback: Alerts, tickets, retrospectives, and pipeline changes that prevent recurrence.
Quality also needs an economic lens. The IBM Institute for Business Value summary reported that 43% of chief operations officers identified data quality issues as their most significant data priority. More than one quarter of organizations reported annual losses above USD 5 million, while 7% reported losses of USD 25 million or more. Those figures explain why quality belongs in operating reviews, not only in engineering backlogs.
The practical unit of progress is the incident-to-resolution cycle. A program is working when it detects failures earlier, routes them to the right owner, limits downstream exposure, and turns each post-incident finding into a stronger pipeline control.
Assessing Your Current Data Quality State
Start with evidence, not stakeholder frustration. People often say they don't trust a dataset, but that perception may reflect a handful of visible incidents, unclear definitions, or measurable defects. Your baseline should capture all three.
Build the baseline from four evidence streams
First, perform incident archaeology. Export the last six months of data-related tickets from Jira or ServiceNow. Cluster each ticket by domain, affected dataset, defect type, root cause, time to detection, time to resolution, and whether the same issue had appeared before. Don't discard “small” tickets. Repeated manual corrections often reveal a process weakness that a major outage exposes later.
Second, profile critical tables automatically. Examine null rates, distinct cardinality, minimum and maximum values, duplicate keys, referential integrity, and distribution changes. Compare source and target counts where appropriate, but don't treat matching row counts as proof of correctness. A transformation can preserve volume while corrupting values.
Third, survey producers and consumers separately. Ask producers which fields they believe they own and consumers whether the data is fit for their decisions. Capture qualitative trust scores alongside usage patterns, critical reports, models, and operational workflows. A high-use dataset with low trust deserves priority even if its incident history is quiet.
Fourth, classify defects against the six dimensions. Use accuracy, completeness, consistency, timeliness, validity, and uniqueness as a shared vocabulary. The data quality maturity model can help teams turn scattered observations into a repeatable baseline rather than a one-off workshop.
Create a measurable maturity snapshot
Score each dimension on a 1 to 5 scale, using explicit evidence. A low score might mean the organization has no shared definition or repeatable measurement. A middle score could indicate automated checks but inconsistent ownership. A high score should require documented thresholds, monitored controls, accountable owners, incident history, and regular improvement.
Dimension | Primary Metric | Sampling Approach | Typical Detection Source |
|---|---|---|---|
Accuracy | Agreement with an authoritative source or verified outcome | Compare critical fields against source records or approved reference data | Reconciliation, consumer review |
Completeness | Null, missing-record, and required-field rates | Full-table checks for critical fields, sampled checks for lower-risk attributes | Profiling, validation tests |
Consistency | Agreement across systems, tables, and definitions | Compare shared keys, units, labels, and calculated values | Cross-system reconciliation |
Timeliness | Arrival and availability against the decision window | Monitor every expected partition or delivery event | Schedule monitor, pipeline logs |
Validity | Conformance to types, ranges, formats, and business rules | Full checks for constrained fields, targeted sampling for complex records | Schema checks, rule engine |
Uniqueness | Duplicate rate for defined business keys | Full-key scans or incremental duplicate detection | Database constraints, profiling |
Keep the baseline versioned. A score without the underlying tests, samples, and definitions can't support quarter-over-quarter comparison.
Defining SLAs and KPIs That Actually Hold
A data quality SLA needs four things: an owner, a threshold, a measurement window, and an escalation path. Remove any one of them and the SLA becomes an aspiration. “Keep the data fresh” isn't enforceable. “The risk feed must arrive within its agreed decision window, with the risk data owner paged when the threshold is breached” is operational.
Tier datasets by consequence
Don't apply the same control intensity to every table. Classify datasets as critical, operational, or exploratory according to business impact, regulatory exposure, downstream dependency, and recovery expectations.
Critical datasets support financial reporting, risk decisions, regulatory submissions, or essential customer operations. Operational datasets drive recurring workflows and management reporting. Exploratory datasets support analysis where delayed or imperfect data is inconvenient but not immediately damaging.
Thresholds should reflect use, not a universal scorecard. A revenue fact table may require 95% completeness, while an intraday risk feed may require 98% freshness, but those figures only matter when each is tied to an owner, a defined measurement window, and an explicit response. The point is to make the business trade-off visible.
Separate early signals from outcome measures
Row counts and null rates describe the state of data after processing. They're useful lagging indicators, but they won't tell you whether the operating model is improving. Add leading indicators such as SLA breach rate, time to acknowledge, consumer-reported defect rate, recurring-incident rate, and the percentage of critical datasets with current runbooks.
Tier | Freshness SLA | Completeness KPI | Validity KPI | Owner Accountability |
|---|---|---|---|---|
Critical | Defined by the decision window and monitored per delivery | Required fields measured on every load | Business rules block or quarantine material failures | Named steward, producer owner, and on-call escalation |
Operational | Agreed delivery window with warning and breach states | Trend monitored against an approved threshold | Invalid records routed for correction before consumption | Producer resolves, steward confirms fitness |
Exploratory | Best-effort availability with visible status | Profiled periodically rather than blocking work | Warnings documented for known limitations | Consumer accepts or escalates the risk |
Publish the SLA where producers work. Put it in the warehouse repository, pipeline configuration, pull request template, and incident runbook. A governance portal can hold the canonical definition, but it shouldn't be the only place engineers can find the contract.
Validation, Anomaly Detection, Timeliness, and Schema Controls
No single control catches every defect. Rule-based validation provides precision where the contract is known. AI-driven detection provides broader coverage where normal behavior is difficult to encode. Timeliness and schema controls address failure modes that value-level checks often miss.
Match the control to the defect
Deterministic validation is the right choice for required fields, uniqueness, referential integrity, accepted value sets, data types, and known row-level business rules. It's interpretable and easy to connect to an audit trail. Its weakness is maintenance. Every new rule requires authoring, testing, and ownership, and a rule can't detect a failure nobody anticipated.
Anomaly detection learns normal distributions, volumes, cardinality, and behavior over time. It can surface silent drift, unexpected shifts, and vendor payload changes without a rule for every possibility. The trade-off is interpretability. A statistical alert needs context, and teams must tune it so unusual but legitimate events don't create alert fatigue.
Timeliness monitoring checks whether data arrives and becomes usable within its decision window. A table that exists but reflects yesterday's state is not healthy for an intraday process. Guidance on data timeliness and validation monitoring recommends automated aging thresholds so stale records are flagged before downstream workflows rely on them.
Schema tracking versions column types, nullability, nested structures, and field presence. It should distinguish additive changes from breaking changes and semantic drift. Adding a nullable column may be safe for one consumer and disruptive for another, so lineage and impact analysis matter.
Control | What it catches | What it misses | Cost profile | Best-fit layer |
|---|---|---|---|---|
Deterministic validation | Known rule violations and contract failures | Novel patterns outside defined rules | Predictable authoring and maintenance effort | Ingestion, normalization, serving |
AI-driven anomaly detection | Distribution shifts, unusual volumes, silent behavioral drift | Context that requires business explanation | Lower manual rule creation, higher tuning need | Broad monitoring across pipelines |
Timeliness checks | Missed loads, delayed partitions, stale-but-present data | Values that arrive on time but are wrong | Low once schedules and windows are defined | Ingestion and delivery boundaries |
Schema tracking | Added, removed, or type-changed fields and structures | Meaning changes without structural change | Moderate metadata and ownership effort | Source contracts and pipeline boundaries |
Teams evaluating automation patterns can also review Truespeak automation insights for broader workflow context. The quality program should still decide which failures block processing, which quarantine records, and which only notify consumers. More automation isn't automatically better if it moves uncertainty into an opaque queue.
A layered approach is stronger than choosing between rules and AI. Use data validation rules and continuous quality controls for known obligations, then add anomaly detection for the long tail.
In-Database Execution, Workflow Integration, and Runbooks
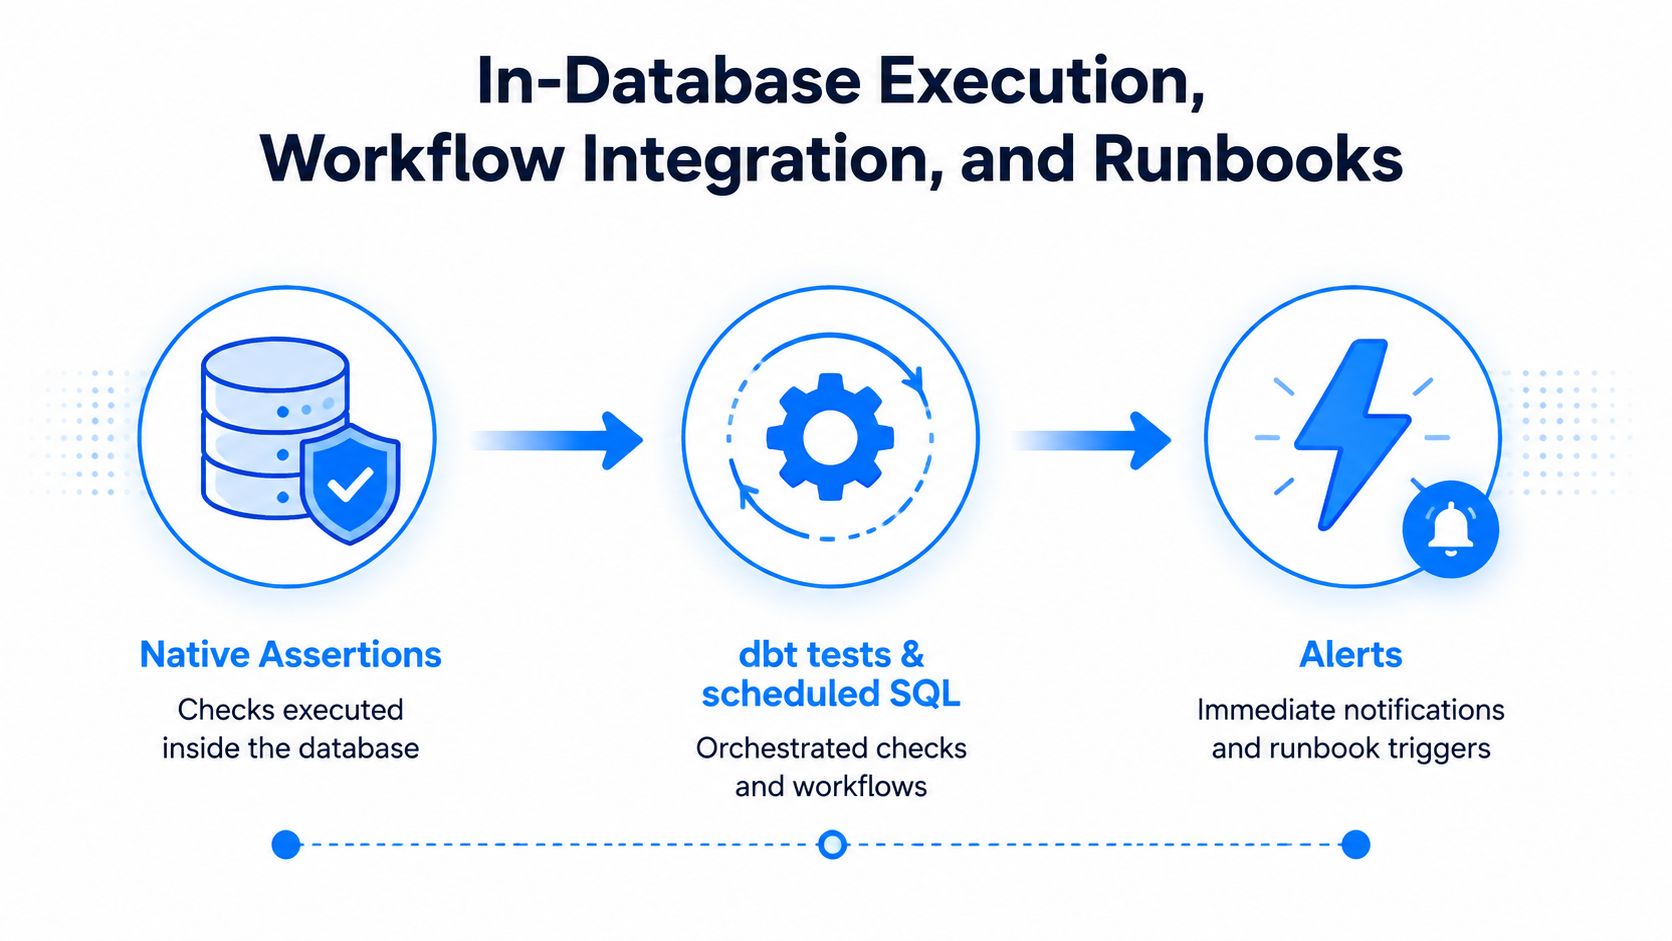
Run checks at the boundary where the data is produced or transformed. Native assertions, dbt tests, and scheduled SQL keep validation close to the table and make failures easier to associate with a specific load, partition, or transformation. A separate monitoring layer can add value, but it shouldn't introduce a long delay between defect creation and detection.
Route signals into existing work
Use severity-based routing rather than sending every result to every channel.
Severity one: Page the on-call engineer through PagerDuty when a critical dataset is unavailable, materially invalid, or outside its decision window.
Severity two: Open a Slack thread with the producer and steward when consumers are affected but a controlled workaround exists.
Follow-up: Create a Jira ticket for recurring defects, rule maintenance, documentation, or pipeline remediation.
The data workflow automation guidance is useful when designing these handoffs, but the principle is simple: alerts must reach the person who can change the producing process.
Make the runbook executable
A runbook should let an engineer begin diagnosis without finding the original author. Include:
Failure signature: The metric, rule, or schedule that breached.
Blast radius: Tables, dashboards, models, reports, and business processes affected.
Likely owner: Producer, steward, platform team, or external vendor.
First three queries: Checks for source values, transformation output, and downstream impact.
Containment step: Rollback, quarantine, load pause, or consumer notification.
Communication template: What happened, what is affected, what users should do, and when the next update will arrive.
Deduplicate alerts within a defined window, suppress child alerts when a parent pipeline failure explains them, and batch low-severity findings into a digest. Before declaring the process ready, run an incident drill. Confirm that the alert fires, the owner is reachable, the queries work, the rollback is safe, and the ticket captures enough evidence for a later retrospective.
Organizing Teams, Ownership, and Operating Cadence
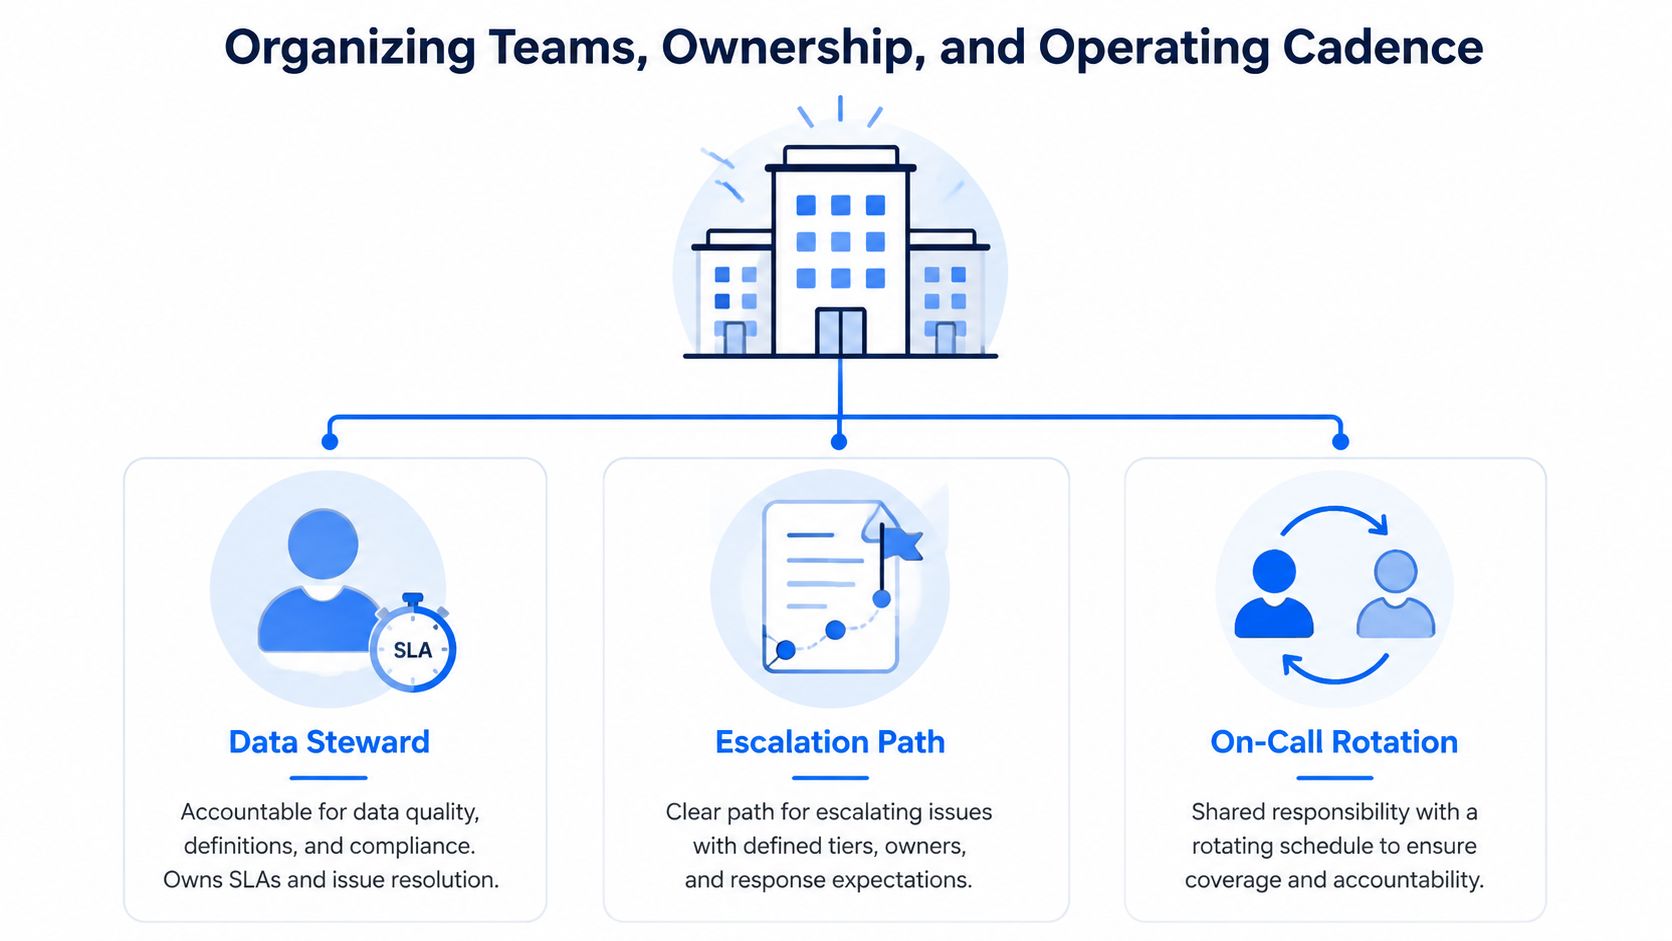
Ownership becomes clear when each dataset has a named steward, a producer, a consumer, and an escalation path. A center of excellence can provide patterns and coaching, but it shouldn't be accountable for a defect it can't correct.
Separate the roles
The data producer owns ingestion, source contracts, schema changes, and pipeline behavior. The data steward owns definitions, quality expectations, business interpretation, and resolution coordination. The data consumer validates whether the dataset is fit for a report, model, or operational decision and files actionable defects.
Cross-domain incidents need a designated incident lead. If a vendor owns the source, a commercial systems team owns the application, and a platform team owns the warehouse, the lead coordinates containment while each group owns its part of the investigation.
Turn meetings into artifacts
A useful cadence produces decisions, not discussion:
Weekly triage: Reviews new anomalies, assigns owners, and closes or escalates incidents.
Monthly KPI review: Compares SLA performance, recurring defects, consumer reports, and overdue remediation.
Quarterly contract refresh: Reviews definitions, thresholds, lineage, regulatory changes, and new consumers.
Use a lightweight RACI for every critical dataset. The producer is responsible for implementation, the steward is accountable for fitness and definitions, consumers are consulted on impact, and the platform or governance group is informed of systemic changes. Adapt the letters if your organization uses a different model, but don't leave accountability shared by an unnamed committee.
The operating model also needs an on-call rotation for the most consequential pipelines. Without it, alerts arrive after business hours and the organization measures detection while accepting slow recovery. Ownership should appear in the catalog, repository, alert payload, and runbook, not only in a meeting document.
Measuring ROI and Your First 90 Days
Leadership doesn't need another quality score without a financial interpretation. Start with data downtime, the period when a dataset is unavailable, stale, or untrustworthy for its intended use. A practical formula is DDT = N × (TDD + TTR), where incidents are multiplied by average time to detection plus average time to resolution, as described in this data downtime measurement guidance.
Convert operational loss into a business case
Pull the hours analysts, engineers, finance staff, and operations teams spent chasing bad data during the previous quarter. Multiply those hours by the relevant loaded hourly cost, then add documented consequences such as revised forecasts, delayed decisions, failed customer actions, or compliance remediation.
Track the same categories after deployment. The comparison should show fewer incidents, shorter detection time, shorter resolution time, less rework, and lower exposure to decisions made from unreliable data. Don't claim that every avoided incident is guaranteed revenue. Separate hard savings from avoided risk and make the assumptions visible.
The case is material for many enterprises. IBM reports that more than one quarter of organizations estimate annual losses above USD 5 million from poor data quality, while 7% estimate losses above USD 25 million. Use those figures as context, not as a substitute for your own baseline.
Use a focused 90-day sequence
Phase | Days | Key Deliverables | Success Criteria |
|---|---|---|---|
Baseline | 1 to 15 | Profile the top five critical tables, define SLAs, assign owners, record current downtime | Every priority dataset has a contract, owner, and starting measurement |
Instrument | 16 to 45 | Deploy schema and freshness checks in-database, route alerts to on-call channels, publish runbooks | Breaches reach the responsible team with actionable diagnostic context |
Tune | 46 to 75 | Add anomaly detection, review false positives, adjust thresholds, and document exceptions | Alert volume is manageable and meaningful changes receive investigation |
Review | 76 to 90 | Run the quarterly review, report downtime and response changes, and select the next coverage area | Leadership sees operational impact and approves the next expansion |
The data quality business case framework can help structure the financial narrative around cost, risk, and measurable outcomes.
Avoid four traps. Vanity metrics reward the number of checks rather than useful detection. Alert fatigue hides serious failures beneath noise. Tooling without accountability creates dashboards instead of remediation. Skipping the first incident retrospective guarantees that the same class of defect will return.
Start with five critical tables, one named owner for each, and a written definition of what “available and trustworthy” means. Then measure the first incident from detection through resolution, because that cycle will tell you more about program maturity than a polished quality score.
digna provides in-database validation, anomaly detection, timeliness monitoring, and schema tracking inside your own environment, so teams can connect quality controls to the pipelines and datasets they already operate. Visit digna to evaluate a modular approach to data quality improvement across warehouses, lakes, and enterprise pipelines.

Poznaj zespół tworzący platformę
Zespół z Wiednia, składający się z ekspertów od AI, danych i oprogramowania, wspierany rygorem akademickim i doświadczeniem korporacyjnym.