Operational Analytics in Healthcare Explained
|
6
min read

Most advice about operational analytics in healthcare starts in the wrong place. Hospitals do not need more dashboards first, they need more trustworthy measurement, because a fast feed with broken meaning only speeds up bad decisions. The actual work is not collecting every possible signal, it is keeping patient flow, capacity, cost, quality, and compliance metrics stable enough that leaders can act on them with confidence.
That matters more now because healthcare has moved from retrospective reporting toward continuous operational control. Healthcare-related papers in major operations-management journals rose from approximately 1% in 2010 to nearly 8% in 2024, which is one reason the field now reads like a management discipline, not just a clinical reporting exercise (source study). In practice, that means admission volumes, queues, resource utilization, delays, and service outcomes deserve the same attention as clinical quality measures.
Table of Contents
Understanding Operational Analytics in Healthcare
Hospitals do not get better operational decisions from more feeds alone. Extra exchange often adds noise when the measurement layer is unstable, and a queue metric is only useful if encounter data, timestamps, and status changes stay consistent over time.
Operational analytics is a management discipline built around continuous measurement and control. It covers patient flow, hospital performance, cost efficiency, regulatory adherence, and the signals that shape day-to-day operations. That includes clinical outputs, admission pressure, service backlogs, and the delays that distort executive dashboards.
From retrospective reporting to live operational control
Healthcare analytics was built around periodic reports, manual compilation, and after-the-fact review. That model still has a place, but it does not fit environments where staffing, throughput, and reimbursement move continuously. The stronger approach is to monitor operational signals as they happen, then escalate only the exceptions that matter.
The research base reflects that shift. Healthcare-related papers in major operations-management journals rose from approximately 1% in 2010 to nearly 8% in 2024 (source study). Hospitals now treat operational data as something that shapes management decisions, not just historical documentation.
Operational teams need the same mindset. If admission counts, discharge timing, and bed availability drift out of sync, the issue is not a reporting defect. It is a control problem that affects staffing, access, and downstream financial performance.
Practical rule: If a KPI can change because a source system changed its behavior, that KPI needs a control layer, not just a visualization layer.
Reliable measurement starts with governance and data discipline. For a practical baseline, this guide to data quality management in healthcare is a useful companion to the operational view.
Core Use Cases Driving Hospital Performance
Hospital leaders usually feel operational analytics in three places first, clinical operations, capacity planning, and the revenue cycle. These are different problems, but they all depend on the same thing, reliable signals that stay meaningful as workflows change. A dashboard that mixes stale feeds, inconsistent definitions, and late-arriving records helps nobody.

Clinical operations need more than outcome summaries
Clinical operations depend on signals such as wait times, care coordination handoffs, readmissions, mortality trends, and patient satisfaction. Those measures only help if teams can also see where the work slowed down, which queues formed, and where service breaks happened. Leaders who stop at monthly outcome summaries usually discover too late that the operational cause has already moved elsewhere.
The technical feed matters here as much as the metric. If encounter times are inconsistent or care-location codes are late, the apparent performance of a unit can look better or worse for reasons that have nothing to do with actual care. That is why clinical operations teams need record-level validation alongside reporting.
Capacity planning lives or dies on timeliness
Capacity decisions depend on bed turnover, staffing ratios, emergency department bottlenecks, and movement through the care continuum. These are live operational signals, not static planning variables. If a bed-cleaning event is delayed in the source system or a transfer status arrives late, the staffing picture can be wrong before the shift even ends.
Operational analytics has to connect the floor to the dashboard. A useful system tracks timing, arrivals, and handoffs in near real time, then alerts only when patterns deviate from expected flow. Otherwise, leaders end up staffing to yesterday's conditions.
Revenue cycle teams need the same discipline
Revenue cycle performance is shaped by claim denials, coding distributions, and discharge-to-bill lag times. These are not just finance metrics, they are operational signals with direct consequences for cash flow and compliance. When coding patterns shift or discharge events post late, the financial impact can show up long before anyone notices the cause.
If your organization is comparing different infrastructure patterns for data-heavy workloads, exploring serverless GPU use cases can help frame the trade-offs around scalable processing. The point is not that every analytics stack needs the same architecture, it is that operational use cases demand fast, dependable processing close to the data.
For a blunt look at what breaks when quality slips, these five incidents caused by poor data quality in healthcare are a useful reality check.
Data Requirements for Reliable Healthcare Analytics
Healthcare interoperability is often sold as a pipeline problem, but analytics teams experience it as a meaning problem. A feed can arrive successfully and still be unusable if a required note field is null, a code set drifts, or a clinically important distinction disappears. That is why structural success is not the same thing as analytical safety.
Standards help, but they do not eliminate the need for monitoring. The United States Core Data for Interoperability defines baseline data classes and elements, including clinical notes, allergies, laboratory results, and medications, yet a technically valid exchange can still leave a reporting team with incomplete or misleading context (interoperability baseline). In practice, hospitals have to watch not just whether data arrived, but whether it arrived with the meaning intact.
Technical exchange is not analytical usability
FHIR APIs and standardized exchange formats create a shared foundation, but they also create a new class of risk. The issue is no longer whether the interface exists, it is whether the payload still means what the downstream system thinks it means. Structural changes in a resource can alter cohorts, suppress fields, or change how downstream logic classifies care events.
That is why analytics teams should monitor schema changes, field-level null rates, code-system conformance, value-set drift, and arrival lag. These controls catch cases where a feed still “works” technically but no longer supports reliable decisions. In healthcare, that distinction matters because the wrong cohort can become the wrong operational action very quickly.
A pipeline that preserves uptime but loses semantics is still a broken pipeline.
Context loss can distort population health logic
The most dangerous failures are subtle. ONC's interoperability guidance highlights the value of consistently exchanging “Reason Not Performed,” because without it a documented decision can look like a care gap. That is a clear example of semantic completeness, the analytics system must preserve context, not just values.
The lesson for hospital data teams is direct. Monitor structural change, but also monitor whether critical fields are missing, collapsed, or redistributed in ways that affect interpretation. This guide to healthcare data validation at clinical and regulatory scale fits well if your team is designing those checks into governed workflows.
The right question is not “Did the file load?” The right question is “Did the file still mean the same thing after it loaded?”
Essential Metrics for Clinical and Financial Success
Building dashboards is easy. Keeping the numbers on them accurate is the hard part, and it is where most hospitals underinvest. When a KPI changes because of upstream data behavior, the problem is measurement control, not visualization design.
AHRQ Quality Indicators are a good example because they rely on standardized administrative data, which means miscoded or missing fields can change the apparent quality rate even when care delivery has not changed (AHRQ Quality Indicators). That makes quality measurement a governed process, not a static report.

Treat every KPI like a metric contract
A metric contract ties a KPI to the rules that make it trustworthy. That means defining the numerator, denominator, exclusions, refresh timestamp, and source fields that support the calculation. It also means versioning the metric definition so that source-system changes do not change the business meaning.
Hospitals should attach completeness checks, validity rules, and timeliness thresholds directly to the data feeding each KPI. If a discharge field is late or a procedure code shifts format, the metric should fail loudly enough to be reviewed before it reaches leadership. Silent drift is worse than a visible incident because it contaminates decisions while appearing stable.
Make the calculation lineage visible
Analysts and executives need to see what the metric is built from, not just the final value. Exposing the numerator, denominator, exclusions, and refresh timestamp turns a KPI from a black box into an auditable object. That also supports exception-based workflows, where teams investigate anomalies instead of manually reviewing everything.
This KPI monitoring dashboard resource is relevant if you want to see how a governed view can surface changes without forcing teams to dig through raw tables. The broader idea is simple, if a metric is important enough to drive action, it is important enough to defend with evidence.
Operational standard: If a source-system change can alter the apparent rate, the KPI is not trustworthy until the change is validated.
The best metric programs do not try to eliminate all variation. They distinguish real operational change from data artifacts, then route exceptions to the people who can explain them.
Implementation Strategies for Sustainable Analytics
Healthcare organizations launch dashboards fast and then struggle to keep them valid after workflows, staffing, and source systems change. That is the sustainability gap. The first version of an analytics program is usually easy to sponsor, but the long-term control work often has no clear owner.
Recent literature reports that only 31% of healthcare analytics initiatives remain fully operational three years after implementation without structured sustainability planning, compared with 78% when such planning is in place (sustainability study). That gap is not a technical footnote. It is the difference between a program that matures and a program that steadily decays.
Build for drift, not just launch
Sustainable analytics starts by assuming that inputs will change. Staff behavior changes, source systems change, and coding practices change. A resilient operating model anticipates those shifts with baseline recalibration triggers, expected delivery windows, and clear thresholds for pausing decisions when data quality degrades.
Ownership matters just as much as tooling. Each governed metric needs a named data product owner, a fallback path when feeds are late, and an escalation route when definitions move. If nobody owns the control when a schema changes, the dashboard will keep showing numbers that no longer deserve trust.
Treat analytics as a service
A one-time project mindset fails because it assumes the work ends at go-live. In healthcare, analytics is a service that has to stay aligned with the operational environment. That means regular review of metric behavior, validation of business rules, and structured evidence for why a KPI remains fit for use.
Use phased implementation when the data environment is messy. Start with the highest-value measures, lock down the definitions, then expand once the monitoring layer proves it can catch drift before leadership sees it. That is slower than launching five dashboards at once, but it is usually the only path that survives contact with real operations.
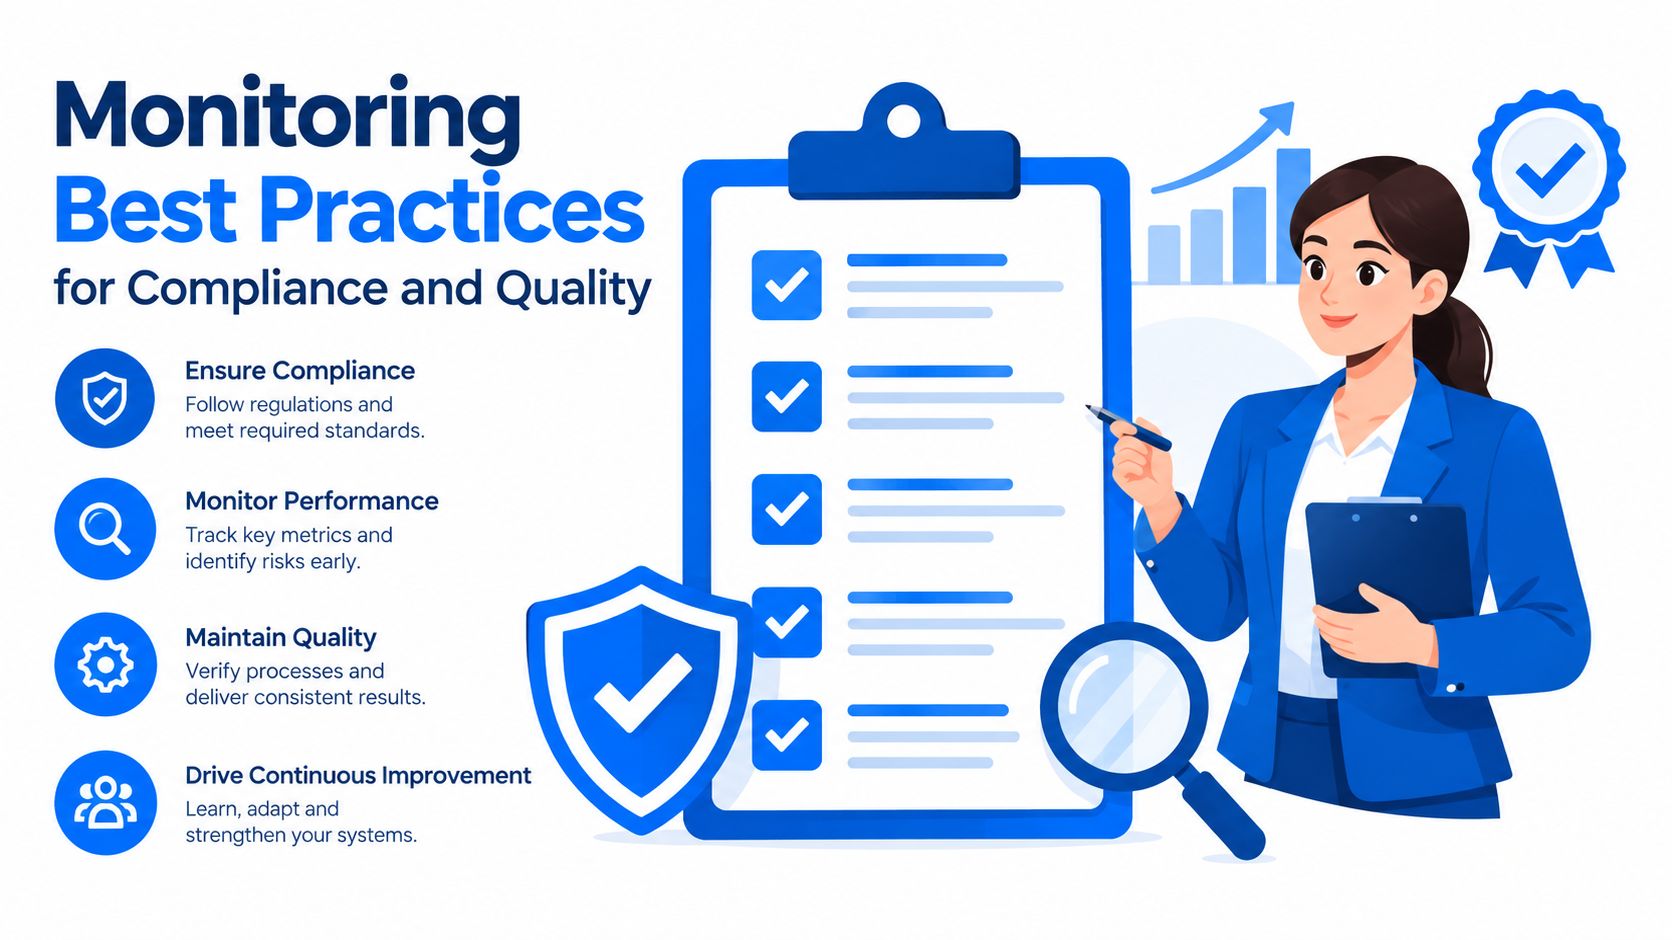
Monitoring Best Practices for Compliance and Quality
In healthcare, observability is not just a data-engineering habit, it supports compliance. Under the HIPAA Security Rule, organizations must assess risks and vulnerabilities affecting the confidentiality, integrity, and availability of electronic protected health information, and that analysis has to stay current when conditions change (HIPAA Security Rule guidance). If platform behavior shifts and nobody notices, the risk analysis is already stale.
CMS quality programs add another layer of operational pressure. Hospitals must meet prescribed submission formats and deadlines, and some programs require very strict completeness thresholds. For example, CMS quality data submission rules include a 100% completeness threshold for specific CDC NHSN infection measures, which makes missing loads and record-count anomalies a real operational issue, not a reporting inconvenience (CMS submission controls).
Compliance monitoring has to happen before submission day
Waiting until report close is too late. A timeliness monitor should flag delayed feeds, missed loads, and unexpected early deliveries while there is still time to fix the issue upstream. A validation layer should also reconcile source-system totals so that record-count anomalies are visible before they become filing problems.
Hospitals should connect platform monitoring to evidence collection. If a schema changes, if a feed is partial, or if a critical table stops updating, the incident record needs to show what changed, when it changed, and how the team responded. That gives compliance teams something far more useful than an after-the-fact apology.
Security and quality work belong together
Security leaders and data leaders often sit in different meetings, but the monitoring questions are closely related. Did the data remain available. Did the structure change. Did the metric still reflect the intended population. Those are operational questions, compliance questions, and governance questions at the same time.
This healthcare data compliance resource is worth reviewing if your team is building a control framework that needs to satisfy both operational and regulatory expectations. The practical goal is not just to detect failure, it is to produce audit-ready evidence that the control worked.
Building a Resilient Healthcare Data Strategy
A resilient healthcare analytics program does not begin with a dashboard, it begins with a controlled environment for the data itself. That is why platforms like digna focus on in-database validation, timeliness monitoring, anomaly detection, and schema tracking inside the customer's own infrastructure, where sensitive data stays governed and local rather than being moved around for inspection.
That approach fits a hospital operating model better than scattered checks bolted onto the side of the stack. Teams can see pipeline health, schema drift, and KPI volatility in one place, while keeping execution aligned with internal security and governance rules. For organizations evaluating broader operational support, IT Cloud Global for medical centers is a relevant example of how healthcare infrastructure thinking extends beyond analytics alone.
The larger lesson is simple. If you want operational analytics to be trusted, you need to observe the data continuously, validate the meaning continuously, and assign ownership continuously. Without that discipline, even a polished dashboard becomes a liability.
digna helps healthcare teams monitor data quality, schema change, timeliness, and business metrics inside their own environment, so operational analytics stays trustworthy after the first dashboard goes live. If you're trying to keep hospital KPIs accurate, auditable, and usable for real decisions, visit digna and see how continuous validation and observability can support that work.
For the module that watches expected delivery windows and flags delayed, missed or unexpectedly early loads before they reach a capacity or compliance report, see digna Timeliness.
Frequently asked questions
What is operational analytics in healthcare?
Operational analytics in healthcare is a management discipline built on continuous measurement and control of hospital operations. It covers patient flow, capacity, cost efficiency, regulatory adherence and service backlogs, so leaders can act on live signals such as admission pressure and delays instead of waiting for periodic retrospective reports.
Why do hospital dashboards show misleading KPIs?
Most misleading KPIs come from upstream data behavior, not from dashboard design. A late discharge field, a shifted procedure code or a care-location code that arrives late can make a unit look better or worse even when care delivery has not changed, which is why each KPI needs a control layer.
How does data timeliness affect hospital capacity planning?
Capacity planning depends on timely data because bed turnover, staffing ratios and emergency department bottlenecks are live signals. If a bed-cleaning event or transfer status arrives late in the source system, the staffing picture can be wrong before the shift ends, and leaders end up staffing to yesterday's conditions.
What is a metric contract for a healthcare KPI?
A metric contract ties a KPI to the rules that make it trustworthy: numerator, denominator, exclusions, refresh timestamp and source fields. The definition is versioned, and completeness checks, validity rules and timeliness thresholds are attached to the feeding data so drift fails loudly before the number reaches leadership.
How many healthcare analytics programs stay operational long term?
According to the study cited in the article, only 31% of healthcare analytics initiatives remain fully operational three years after implementation without structured sustainability planning, compared with 78% when such planning is in place. Named metric owners, fallback paths for late feeds and recalibration triggers close that gap.


