How to Assess Data Quality: A Practical Guide for Teams
|
6
min read

You can feel data quality slip long before anyone files a ticket. The dashboard refreshed, the pipeline said success, and the numbers still don't line up with finance, sales, or what the business expected to see. That's usually the moment teams realize the problem isn't whether data arrived, it's whether the data is safe to trust.
Most teams start with freshness checks and null rates because they're easy to automate. Those checks matter, but they don't tell you whether a column changed meaning overnight, whether a source started duplicating records, or whether a clean-looking dataset is still wrong for the decision it supports. That's why assessing data quality has to be treated as a diagnostic workflow, not a status light, and why a failed report can still come from a “successful” load.
Table of Contents
Why Most Data Quality Checks Miss the Real Problem
A typical morning starts with a green pipeline and a red Slack thread. The load finished, the warehouse tables are populated, and the revenue dashboard looks fine at a glance, until someone notices the total is off because a source changed a column type or a business rule stopped matching the new format. The pipeline didn't fail, but the decision layer did.
That gap is exactly why pipeline success and data quality are not the same thing. A completed job only proves that bytes moved, not that the records still mean what they meant yesterday. If your checks stop at freshness and null counts, you'll miss accuracy issues, cross-table contradictions, and schema drift that breaks downstream reporting without warning.
Practical rule: if a metric can be wrong while still looking present, it needs a quality check that goes beyond existence.
Teams get burned when they confuse observability with quality assessment. Observability tells you something changed in the flow, while assessment asks whether the data is still fit for use. The difference matters in regulated environments and in AI workflows, where technically clean data can still be operationally unsafe.
The best internal mental model is simple, present data is not trustworthy data. That's the line your alerts need to defend. If you're mapping the gap between noisy dashboards and actionable controls, this data-rich and information-poor framing is a useful companion, because it captures the exact failure mode many teams live with every day.
Defining Critical Datasets and Quality Dimensions
Start by deciding what matters before writing a single check. Not every table deserves the same scrutiny, and not every field carries the same risk. The right scope is the intersection of business impact and downstream dependency, so the first question is always, “What breaks if this value is wrong?”
For a regulated estate, I'd scope the dataset around critical workflows first, then identify the attributes that actually control those workflows. That usually means identifiers, timestamps, foreign keys, status fields, regulatory codes, and any value that rolls into a KPI, report, or model. Once those are named, define the six dimensions as measurable requirements, not abstract ideals.
Dimension | What it measures | Typical threshold style | Failure example |
|---|---|---|---|
Completeness | Required values are present | Tight on mandatory fields, looser on optional text | A required customer ID is missing |
Uniqueness | Records are not duplicated | Usually zero tolerance on key fields | The same transaction lands twice |
Consistency | Values don't contradict across systems or tables | Cross-source reconciliation checks | Order status differs between warehouse and billing |
Validity | Values conform to allowed formats, ranges, or rules | Hard pass or fail on defined patterns | A tax identifier has the wrong format |
Accuracy | Values match trusted reference data or reality | Reconciliation against authoritative sources | A product code exists, but points to the wrong item |
Timeliness | Data is fresh enough for its intended use | Freshness windows or delivery expectations | A daily file arrives after the reporting cutoff |
The trap is collapsing all of that into one score. A dataset can be nearly complete and still be unusable if the valid values are wrong or stale. That's why thresholds should be risk-weighted, with zero tolerance for something like an invalid regulatory identifier and some flexibility for a nonessential descriptive field.
A good scope document fits on one page. If it can't say which tables matter, which fields are critical, and why each dimension is being checked, the program will drift into checkbox theater.
If you need a practical way to identify critical fields and tie them to ownership, critical data elements is the right starting point. For teams building the scope with governance and engineering together, that alignment saves a lot of downstream debate.
Running the Staged Assessment Methodology
The cleanest way to assess data quality is to sequence the work, not improvise it. The order matters because each stage feeds the next, and skipping one turns the whole process into guesswork. Start with profiling, then define rules, then set thresholds, then run queries and inspect the results.

Profile before you prescribe
Profile the dataset first. Look at null rates, duplicate rates, value ranges, formats, and referential relationships, because those patterns tell you where the actual defects live. Without that baseline, you'll end up writing rules against assumptions instead of evidence.
Then translate requirements into tests that are specific to the dimension you're measuring. A date field needs a format rule and a range rule. A foreign key needs a referential check. A regulatory code may need a strict pattern plus a source-of-truth reconciliation.
Set thresholds that reflect risk
Warning and failure thresholds should not be the same thing. A field that supports a dashboard might tolerate a small defect rate, while a field that drives compliance reporting usually shouldn't. That distinction is where too many programs fail, because they treat every defect as equal.
Calculate results at the record, field, table, and domain level, then trend them over time. A single pass says almost nothing. A deteriorating defect rate tells you a source changed, a contract broke, or an upstream team changed behavior. That's where the methodology becomes operational instead of decorative.
The point is to catch the ugly case early, the one where a dataset is 99% complete but still materially wrong. If you need a reference for the terminology around this approach, data quality assessment definition is a helpful companion.
Sampling, Validation, and Honest Reporting
A result without context is a liability. If you sampled 100 records, you should never report the metric as if it came from a full population scan, because the uncertainty is part of the finding. Retain the numerator, denominator, observation window, population definition, and sampling method for every metric, then report confidence intervals when the result is estimated from a sample, as NIST's measurement guidance emphasizes in its treatment of uncertainty (NIST SP 800-55).

Report the shape, not just the score
A completeness estimate from 100 sampled records is not the same thing as the same percentage from 100,000 records. The first can be useful, but it's much less stable and much easier to misread. Track mean, standard deviation, quantiles, and missingness by segment so you can see where the problem clusters.
That segmentation matters because aggregate scores hide local failure. A table can look fine overall while one country, one source system, or one customer segment is collapsing. If you don't preserve the breakdown, you'll miss the operational root cause and waste time arguing over the headline number.
Don't confuse the common failure modes
Validity is not accuracy. A value can match the right format and still be wrong. Late data is not missing data either, and automated imputation can make completeness look better while damaging traceability.
That's why the report should state uncertainty, not hide it. A good quality result tells you what was checked, how it was checked, how confident you should be, and which parts of the population need attention.
For teams building the capture side of this workflow, browse data capture blocks is a useful reference for thinking about input discipline and structure, especially when source systems are messy. The operational issue is usually not the math, it's getting trustworthy input in the first place.
You can also map the checks to explicit rules and review logic with data validation rules, checks and continuous data quality, which is where reporting stops being abstract and starts supporting real remediation.
Choosing the Right Mix of Tools and Automation
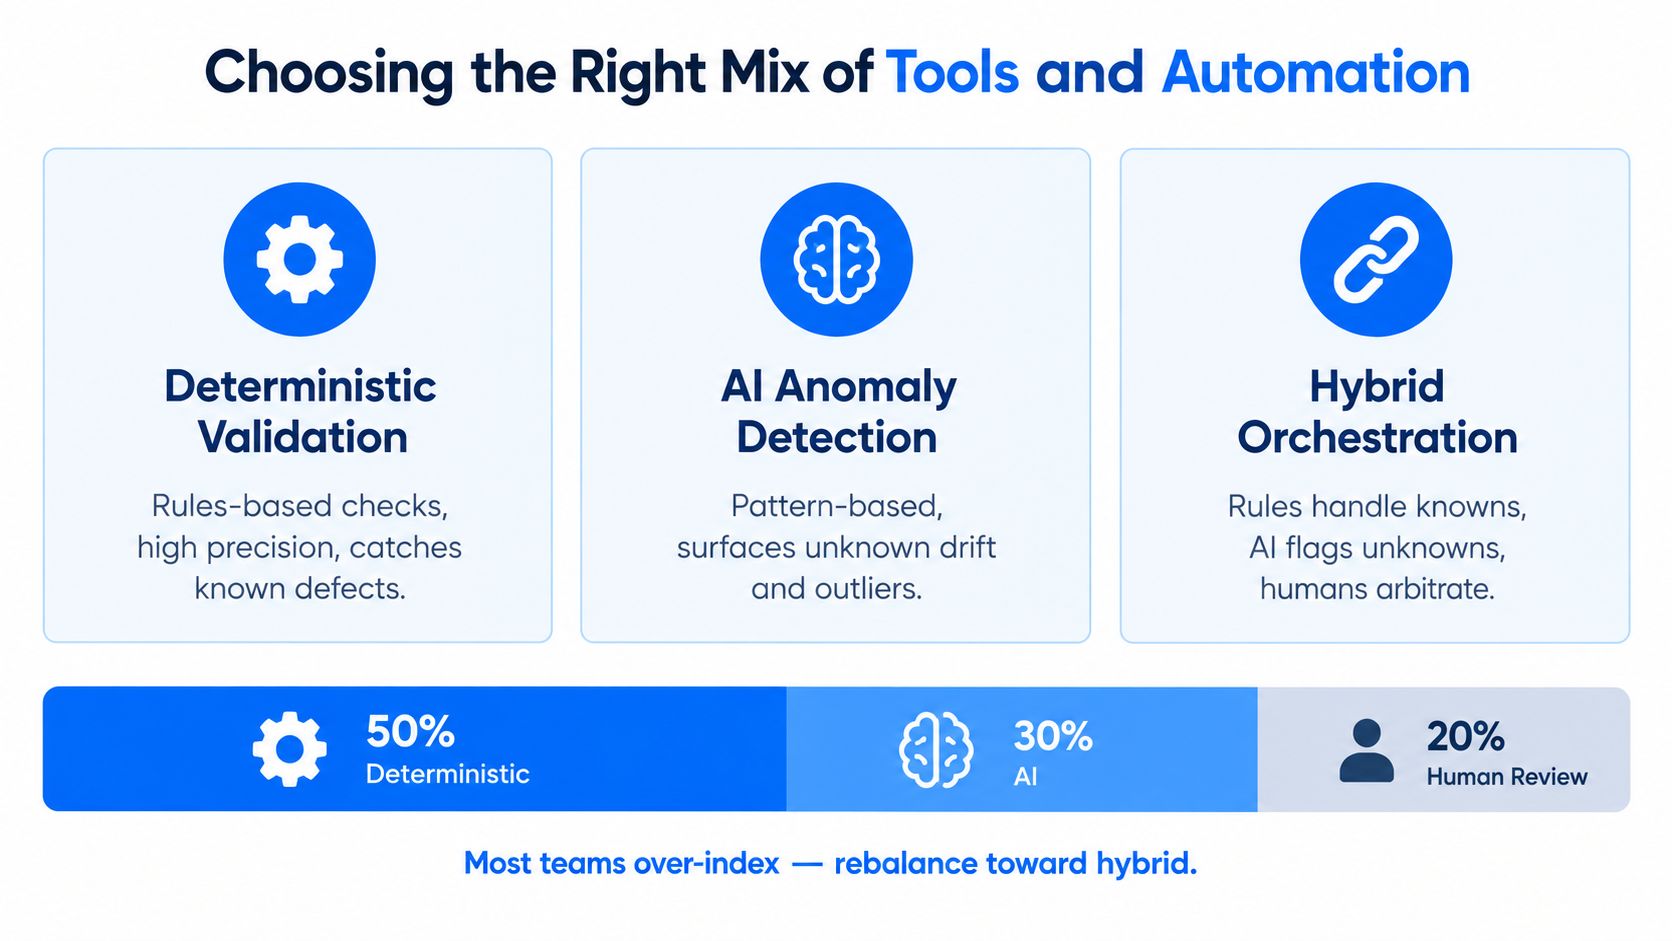
Good programs don't bet everything on one kind of signal. Deterministic validation catches known defects, AI-driven anomaly detection catches unfamiliar patterns, and schema plus timeliness checks catch silent failures before they spread. Use all three, but assign each one to the problem it handles best.
Match the signal to the failure mode
Rule-based validation is the right tool when the requirement is explicit and auditable. If a tax code must follow a format, or a foreign key must exist, write the rule and make the outcome reproducible. That's the evidence auditors want, and it's the fastest way to stop known defects from entering the estate.
AI or statistical anomaly detection belongs where the problem is behavioral drift. A pattern shift in volume, distribution, or timing may not violate a hard rule, but it can still indicate a source change, an upstream process issue, or a broken assumption. Learned baselines outperform static checks in these cases, because the rule set can't anticipate every new failure mode.
Don't ignore structural and delivery monitoring
Schema changes and timeliness checks deserve their own place in the stack. A column type change, an added field, or a delayed delivery can break downstream consumers before any row-level rule fires. These checks are basic, but they save a lot of production pain.
The trade-off is governance and placement. In-database execution reduces data movement and keeps the control closer to the data, which matters in regulated environments. Modular adoption also helps, because teams need to start with one critical path and expand instead of buying a giant platform they never fully operationalize.
You don't need a single silver-bullet tool. You need a stack that matches the risk profile of the data, the compliance burden on the team, and the kind of failures your business encounters. If you're comparing vendors or shaping an internal standard, data quality tools is a practical anchor for that evaluation.
When Clean Data Is Not the Same as Safe Data
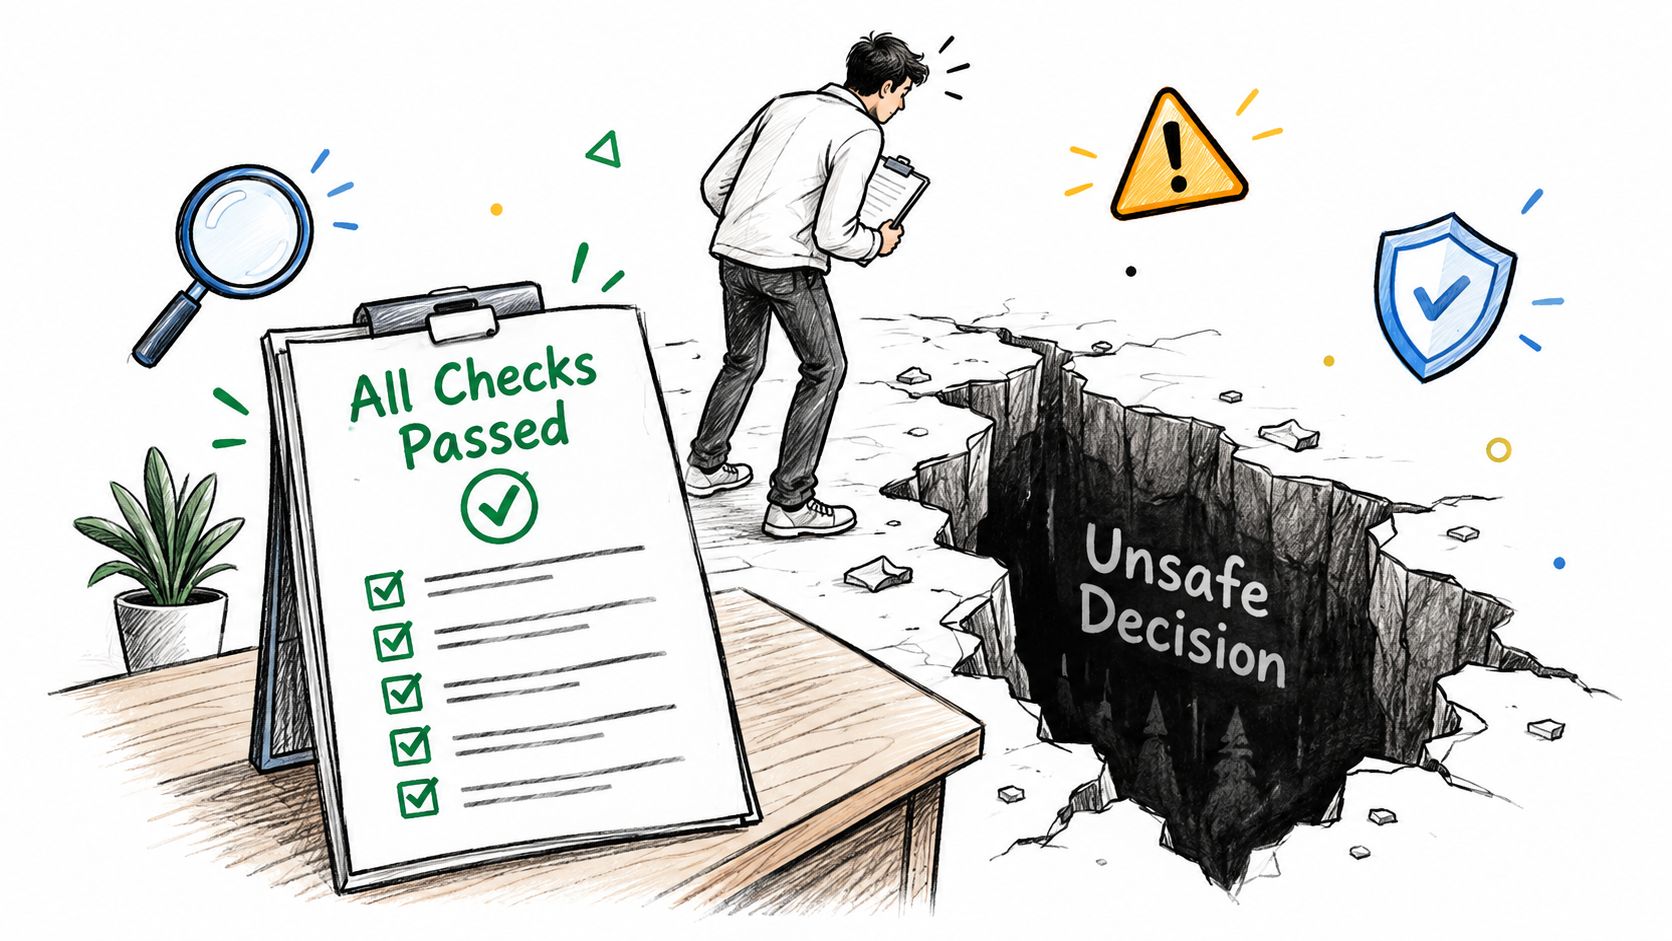
A dataset can pass every conventional check and still be unsafe for the decision it powers. That becomes obvious fast in AI work, because the question isn't only whether the data is clean, it's whether it's relevant, representative, and appropriate for the group being affected. Article 10 of the EU AI Act requires high-risk training, validation, and testing data to be relevant, sufficiently representative, as complete and error-free as possible, and statistically appropriate for the affected groups and contexts (EU AI Act Article 10).
Technical cleanliness does not prove fitness for use
The standard six-dimension model stops short here. You can have complete, valid, unique data that still underrepresents a minority group, misses a relevant geography, or reflects an outdated operating context. That dataset may look technically sound and still be operationally unsafe.
The practical fix is to add subgroup coverage, distribution shift, and intended-use documentation to the assessment record. In healthcare, finance, telecom, and public services, that's not a theoretical concern. Aggregate quality scores can look acceptable while individual group coverage or error rates remain unacceptable.
Treat representativeness as an operational requirement
Representativeness has to become measurable, or it becomes hand-waving. Teams need explicit thresholds for subgroup coverage, clear rules for when drift is a legitimate population change, and a record of why the dataset is fit for a particular decision. That's the only way to separate a genuinely changing population from harmful sampling bias.
This is also where ownership matters. Someone has to own the call on whether the data still matches the use case, not just whether the checks passed. If the dataset is clean but not suitable, the right answer is to stop the workflow, not celebrate the dashboard.
Reporting Results and Operationalizing the Workflow
The report should tell stakeholders what was checked, what failed, how confident the team is in the result, and who owns the next action. Include scope, dimensions tested, thresholds, segment breakdowns, results with uncertainty, remediation status, and a clear owner for each unresolved issue. If you need a practical reference for operational documentation patterns, the how to guides from Trupeer Inc. are a useful model for making process steps readable without overcomplicating them.
Keep the workflow repeatable
The most reliable programs turn assessment into a calendar, not a one-off project. Schedule recurring assessments, version rules and thresholds, alert on degradation, and review outcomes with stakeholders on a regular cadence. That lines up with ISO 8000's governance model, where standards are reviewed every five years and quality control is part of ongoing management, not a single certification event (ISO 8000-1:2022).
Checklist for the runbook: scope critical datasets, profile the data, define the rules, set warning and failure thresholds, run the queries, trend the results, report uncertainty, and reassess on a calendar.
Avoid vanity dashboards. Avoid alert floods. Both create the same outcome, people stop trusting the program. A quality workflow only works when the signals are specific enough to action and stable enough to support audit, engineering, and analytics at the same time.
If you want a platform that runs inside your own environment and combines record-level validation, timeliness monitoring, schema tracking, and anomaly detection, digna is one option to evaluate for this kind of operating model. Visit digna to see how its data quality and observability approach fits critical datasets, regulated estates, and AI-ready workflows.
For the learned-baseline side of this stack, see how the digna Data Anomalies module flags shifts in volume, distribution and timing that no hand-written rule anticipated.
Frequently asked questions
How do you assess data quality step by step?
Assess data quality in a fixed sequence: scope critical datasets, profile the data, define rules per dimension, set warning and failure thresholds, run the queries and trend the results. Profiling comes first because null rates, duplicates and value ranges show where defects actually live, so rules are built on evidence rather than assumptions.
What are the six dimensions used to measure data quality?
The six dimensions are completeness, uniqueness, consistency, validity, accuracy and timeliness. Each should be a measurable requirement with its own threshold style, for example zero tolerance on duplicate key fields or a freshness window for a daily file that must arrive before the reporting cutoff.
Why can a successful pipeline still deliver bad data?
A completed job only proves that bytes moved, not that the records still mean what they meant yesterday. A source can change a column type or start duplicating records while the load stays green, so checks limited to freshness and null counts miss accuracy issues, cross-table contradictions and schema drift.
How should sampled data quality results be reported?
Sampled results should always carry their uncertainty. Keep the numerator, denominator, observation window, population definition and sampling method for every metric, and report confidence intervals, since a completeness estimate from 100 sampled records is far less stable than the same percentage from 100,000 records.
Is clean data always safe to use for AI?
No, clean data can still be unsafe if it underrepresents a group, misses a geography or reflects an outdated context. Article 10 of the EU AI Act requires high-risk training data to be relevant and sufficiently representative, so assessments should add subgroup coverage, distribution shift and intended-use documentation.


