Modern Workload Analysis on Teradata Vantage with digna: AI-Driven Optimization for CPU, IO, and Cost Efficiency
|
7
min read

Teradata Vantage remains one of the most important platforms for large-scale enterprise analytics because it is powerful, scalable, and proven. But as workloads grow in complexity, teams face an ongoing challenge:
How do you continuously monitor CPU, IO, skewness, and workload trends without manual checks, dozens of SQL queries, or post-incident firefighting?
This is where digna provides a step-change improvement.
By reading Teradata’s DBC system tables, converting them into intelligent time-series metrics, and applying AI-based anomaly detection, digna gives engineering teams a real-time, automated view of workload behavior without exporting data and without maintaining rules manually.
This article breaks down how digna enhances Teradata Workload Management using AI, how it detects CPU/IO anomalies, and how organizations can use digna to reduce risks, improve stability, and lower costs.
Why digna is a Natural Fit for Teradata Workload Monitoring
Teradata remains one of the most stable and trusted analytics platforms. digna complements Teradata’s reliability by providing:
AI-based trend learning
No thresholds. No rules. digna automatically learns what “normal” CPU, IO, perm usage, and workload patterns look like.
Real-time anomaly detection
As soon as a job deviates from expected values, digna flags it—before it becomes a system-wide issue.
End-to-end workload visibility
All insights are generated inside Teradata, using:
DBC tables
AMPCPUTime
IO histograms
Perm usage
Skew metrics
QryLog data
DBQL tables
Alerts where teams work
Email, Slack, Jira, and module-based notifications ensure problems are never missed.
Zero data movement
All calculations run inside the database—only metrics leave the system.
How digna Learns Teradata Workload Behavior
digna starts by collecting operational metrics directly from Teradata through SQL queries executed inside your environment. Nothing leaves your system except the calculated metrics themselves. But this is only the beginning — the real intelligence happens when digna turns these raw signals into evolving behavioral profiles.
Instead of learning inside the database, digna routes these metrics to the digna AI Engine, where models continuously adapt to how your Teradata system behaves over time. This allows digna to understand not just individual data points, but patterns: how CPU grows during the business day, how IO behaves during nightly batches, and how workloads fluctuate across weeks or months.
Unlike traditional workload tools that require rule configuration, the platform automatically learns daily, weekly, and monthly seasonality. For example:
Higher CPU usage every Monday
Extra IO load on the 10th day of each month
Month-end spikes that are normal for your organization
By recognizing your natural operational rhythms, digna can precisely separate expected cycles from true anomalies. This is how digna avoids false alarms, focuses attention on meaningful deviations, and gives you a continuously adapting understanding of workload health.
AMPCPUTime Trend Learning
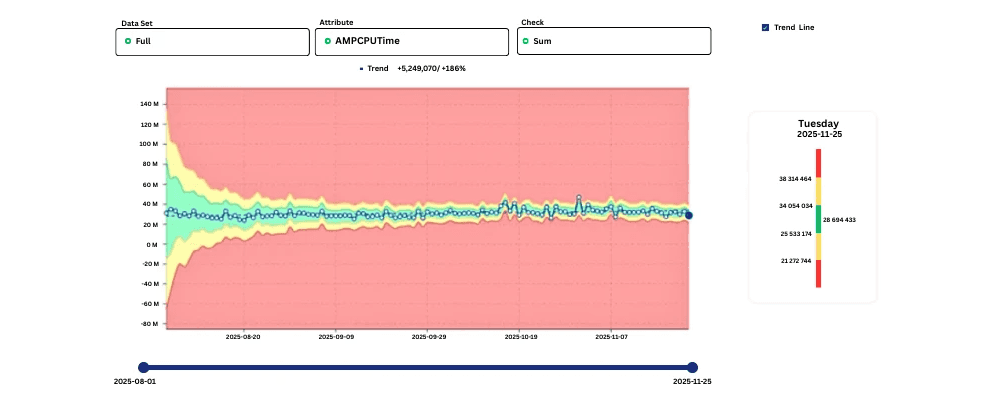
One of the most powerful examples is how digna learns AMPCPUTime for the entire Teradata system.
At first, the accepted (green) range is wide because digna is still observing variability. Over time, the more stable the consumption, the narrower the green area gets. This tighter band means digna understands exactly what “healthy” CPU looks like—so it can flag real anomalies with high precision.
Key value: digna reduces CPU-related escalations and helps teams anticipate growing workloads before they cause incidents.
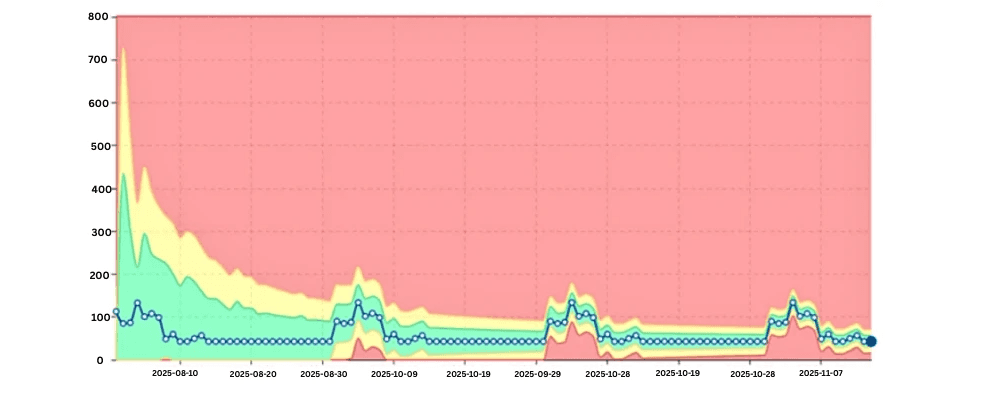
Detecting IO Outliers Early
IO spikes are some of the earliest indicators of problematic workloads.
In the example you’ll add here, digna identifies a job that suddenly exhibits IO far outside its normal pattern—even though CPU may appear normal.
This early detection allows teams to investigate:
Data distribution changes
Table scans
Skewed joins
Unexpected data growth
Unoptimized workload logic
Key value: digna helps teams avoid IO bottlenecks that slow down the entire system.
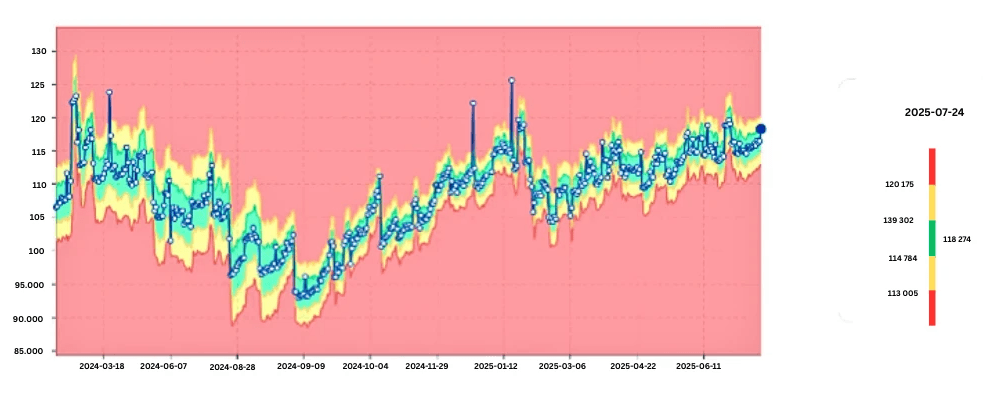
Identifying Unstable CPU Consumers
Not all jobs behave consistently. Some show unexpected volatility in CPU usage that, over time, leads to cluster instability.
The image below shows how digna highlights these anomalies.
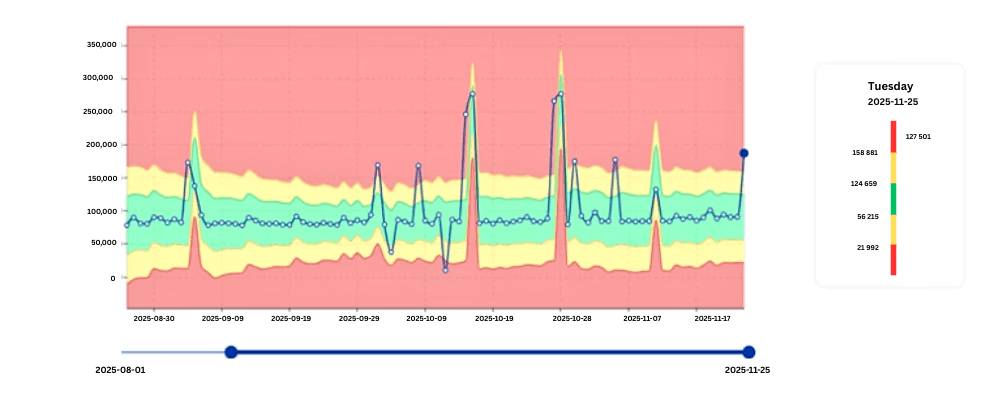
Volatile CPU workloads often indicate:
Bad query plans
Data model changes
Parameter-sensitive optimizations
Drift in table sizes
Skew in joins or aggregations
With digna, these patterns are detected long before they become a major incident.
Key value: digna surfaces noisy workloads early, enabling CPU optimization that directly reduces licensing and infrastructure costs.
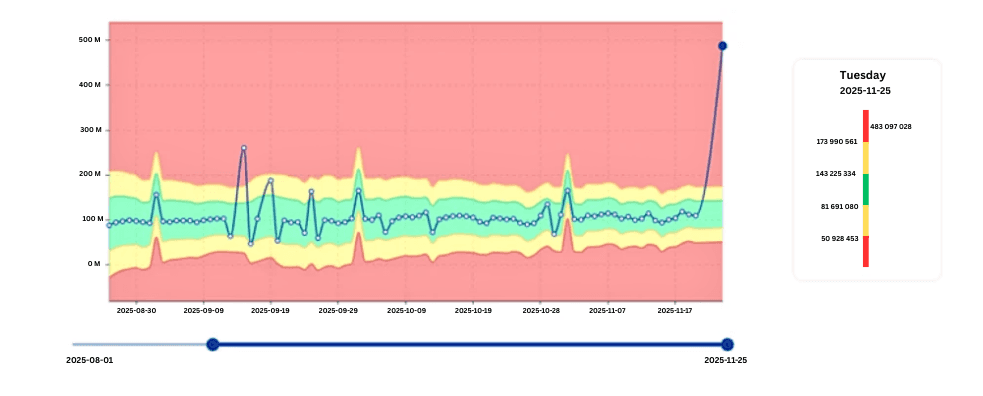
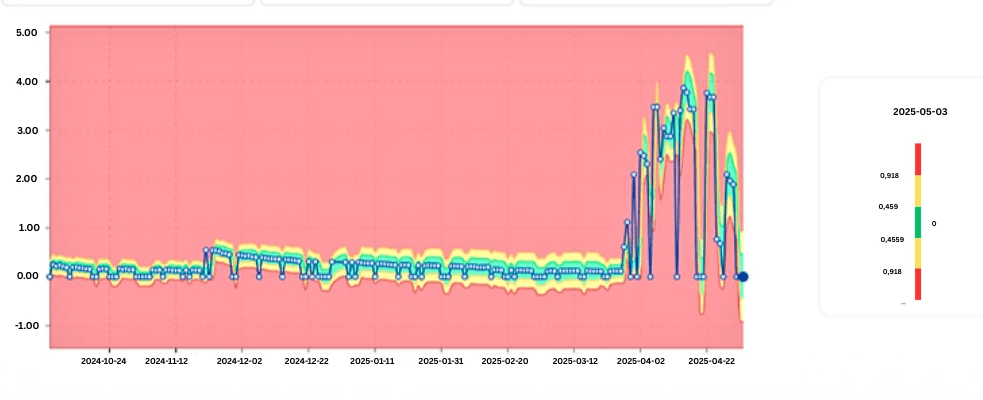
Detecting Sudden CPU Instability in Critical Jobs
Sometimes CPU consumption is stable for months—and suddenly becomes erratic.
This is exactly the type of workload digna is built to catch.
These changes often result from:
Data migration
New demographics or distributions
ETL logic modifications
Schema drift
Poor index maintenance
digna immediately flags such patterns, marking these workloads as high-priority for analysis.
Business impact: Early detection prevents CPU surges that can degrade performance across hundreds of users and workloads.
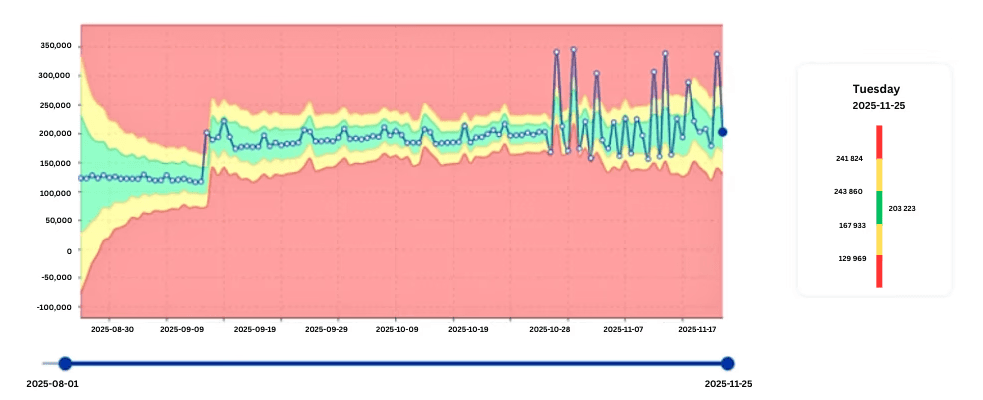
Recognizing and Respecting Seasonal Patterns
Not all spikes are anomalies.
Some workloads naturally change:
Month-end closing
Weekly billing cycles
Monday reporting
Quarter-start data loads
End-of-day aggregations
The image here shows how digna learns seasonal patterns automatically.
Instead of alerting incorrectly, digna understands:
When certain workloads should spike
How steep the spike should be
What patterns repeat over time
Key value: digna eliminates false positives by distinguishing anomalies from natural seasonality.
Monitoring Database Growth with Perm Usage Trends
Perm usage is a foundational metric for Teradata capacity management. digna:
Learns the normal size trajectory
Flags sudden increases
Identifies abnormal table growth
Detects storage consumption spikes
This helps prevent:
Space errors
Unexpected full-table scans
Runaway ELT workloads
Key value: digna gives teams time to react before storage consumption affects performance.
Skew Detection: Identifying Uneven Data Distribution
Skew is one of the most common—and costly—performance problems in Teradata.
Skew occurs when data is not evenly distributed across AMPs, causing:
Bottlenecks
Long CPU cycles
Slow joins
Performance inconsistencies
digna automatically analyzes skewness trends over time to show:
When a table becomes skewed
Whether skew is worsening
Which AMPs are affected
Whether recent data changes caused new skew
Key value: digna pinpoints skew-related degradation before it impacts performance across the platform.
digna Converts All DBC Metrics into Time-Series Data
This is the core enabler for everything described above. By converting DBC table metrics into time-series, digna can:
AI Capabilities
Learn CPU patterns
Detect IO anomalies
Model seasonal fluctuations
Track job-level volatility
Detect slow data drift
Monitor long-term system capacity
Observability Capabilities
Compare workloads across days
Track query performance changes
Provide historical trends
Identify regressions
Monitor growth patterns
Alerting & Integrations
Email
Slack
Jira
Webhooks
Module-level notifications
Key value: digna’s time-series engine transforms raw Teradata metadata into actionable insights.
Real-World Impact: More Stability, Lower Costs, Fewer Escalations
Based on how teams use digna today, the platform delivers:
Fewer escalation meetings: Because anomalies are detected before problems escalate.
Greater predictability: Stable workloads = predictable resource usage = easier cost control.
Reduced CPU and IO consumption: Through early identification of inefficient workloads.
Stronger collaboration with business teams: Problems are fixed before business users notice anything.
Less firefighting for engineering teams: AI handles the monitoring so the team can focus on high-value tasks.
Conclusion
Teradata Vantage provides the foundation for enterprise data and analytics. digna elevates this foundation by adding an automated AI-monitoring layer that transforms raw system metrics into real-time operational intelligence.
By continuously analyzing CPU, IO, skew, perm usage, and job behavior, digna enables engineering teams to:
Improve performance
Prevent downtime
Reduce cloud/on-prem costs
Work proactively instead of reactively
This is the next generation of Teradata Workload Analysis—AI-driven, automated, and built for enterprise scale.
Watch our demo and explore AI-Driven Optimization for CPU, IO, and Cost Efficiency on your Teradata environment or contact us.


