Data Completeness Checks a Practical Guide for Modern Teams
|
6
min read

You can have a warehouse that looks healthy on paper and still ship a broken number to finance before lunch. A daily load lands, dashboards refresh, and nobody notices that one required field is suddenly empty, one partition didn't arrive, or one source changed shape just enough to slip past a casual row-count spot check. That's how trust starts leaking, long before anyone opens a war room.
Data completeness checks are the guardrail between raw ingestion and decisions that people are willing to defend. The tricky part is that completeness isn't just “are there nulls,” it's also “did the right records arrive on time, in the right place, and with the fields the business needs.” That's why the strongest approach treats completeness as a fitness-for-use question, not a cosmetic metric.
Table of Contents
Why Completeness Failures Break Trust Before Anyone Notices
A finance team I'd expect to see in any large warehouse setup knows this pattern well. The dashboard doesn't explode, it just stops matching the source system after a daily load, and the first clue is a comparison check against last week's totals. Someone rechecks the model, someone else re-runs the report, and then the problem appears. A column dropped out of the feed, but the pipeline still “succeeded.”
That kind of miss is exactly why official statistical quality guidance treats completeness as a first-line control. The Scottish Government recommends checking for missing values, verifying the expected number of data entries, confirming all variables are present, and comparing totals and row or column sums against each other and against prior years before publication, then testing anomalies against historical data and other published sources to see whether the change is real or just an error (Scottish Government statistical quality guidance). In plain warehouse terms, this is a reconciliation job, not just a null hunt.
A team that only checks whether a column contains nulls can miss silent row loss, duplicated entries, or a load that's late but not technically empty. That's why a completeness failure often shows up as stakeholder escalation first and a root-cause investigation second. By the time the report is rebuilt, the damage is already social as much as technical.
Practical rule: if a dashboard drift can be mistaken for a business change, you need completeness checks on both record flow and field presence, not just one or the other.
If you're evaluating tooling around this problem, it helps to compare how different products handle operational data checks. A useful place to start is to evaluate government contractor software, since public-sector reporting environments tend to expose the same completeness failure modes that enterprise warehouses do, only with less room for ambiguity.
What Data Completeness Checks Verify
A useful starting point is the simplest metric. Completeness is often expressed as the share of non-missing values in a field or record, calculated as Completeness = (Number of Non-Null Values / Total Number of Values) × 100%. That formula helps because it makes completeness comparable across tables, systems, and time periods, and it gives you one language for a field, a row, or an entire dataset (completeness metric definition).
A warehouse team usually feels the metric only after something downstream breaks. A daily orders feed can look healthy at the column level, while a few missing keys make joins fail, dashboards miscount, and audit trails lose continuity. A customer table may still be usable for billing even if one enrichment field is empty, because billing only needs a narrower slice of the record. That is why completeness checks are really about fitness for use, not about forcing every cell to be filled.
Attribute-Level and Record-Level Views
Completeness has at least two layers that are worth separating. Attribute-level completeness asks whether a specific column is populated. Record-level completeness asks whether a row contains every field the use case needs. A column can look fine on average and still leave a handful of critical rows unusable downstream.
That distinction matters most during ingestion and warehouse loading. If customer_id, order_date, or status is missing in an orders table, the pipeline may still land rows, but the model can no longer support joins, dashboards, or audit review with confidence. IBM's guidance on data testing methods points in the same direction, completeness should focus on critical data elements, because not every field has the same operational value (IBM data testing methods).
Once you define the use case, the check becomes much clearer. You decide which fields are required, which ones are optional enrichment, and which rows must never arrive half-loaded. In practice, that means completeness rules follow the business process first and the schema second.
A warehouse can be incomplete for analytics and still complete enough for control reporting. That difference is what turns completeness into a decision about timeliness and SLA coverage, especially when a late load is more damaging than a sparse but on-time one.
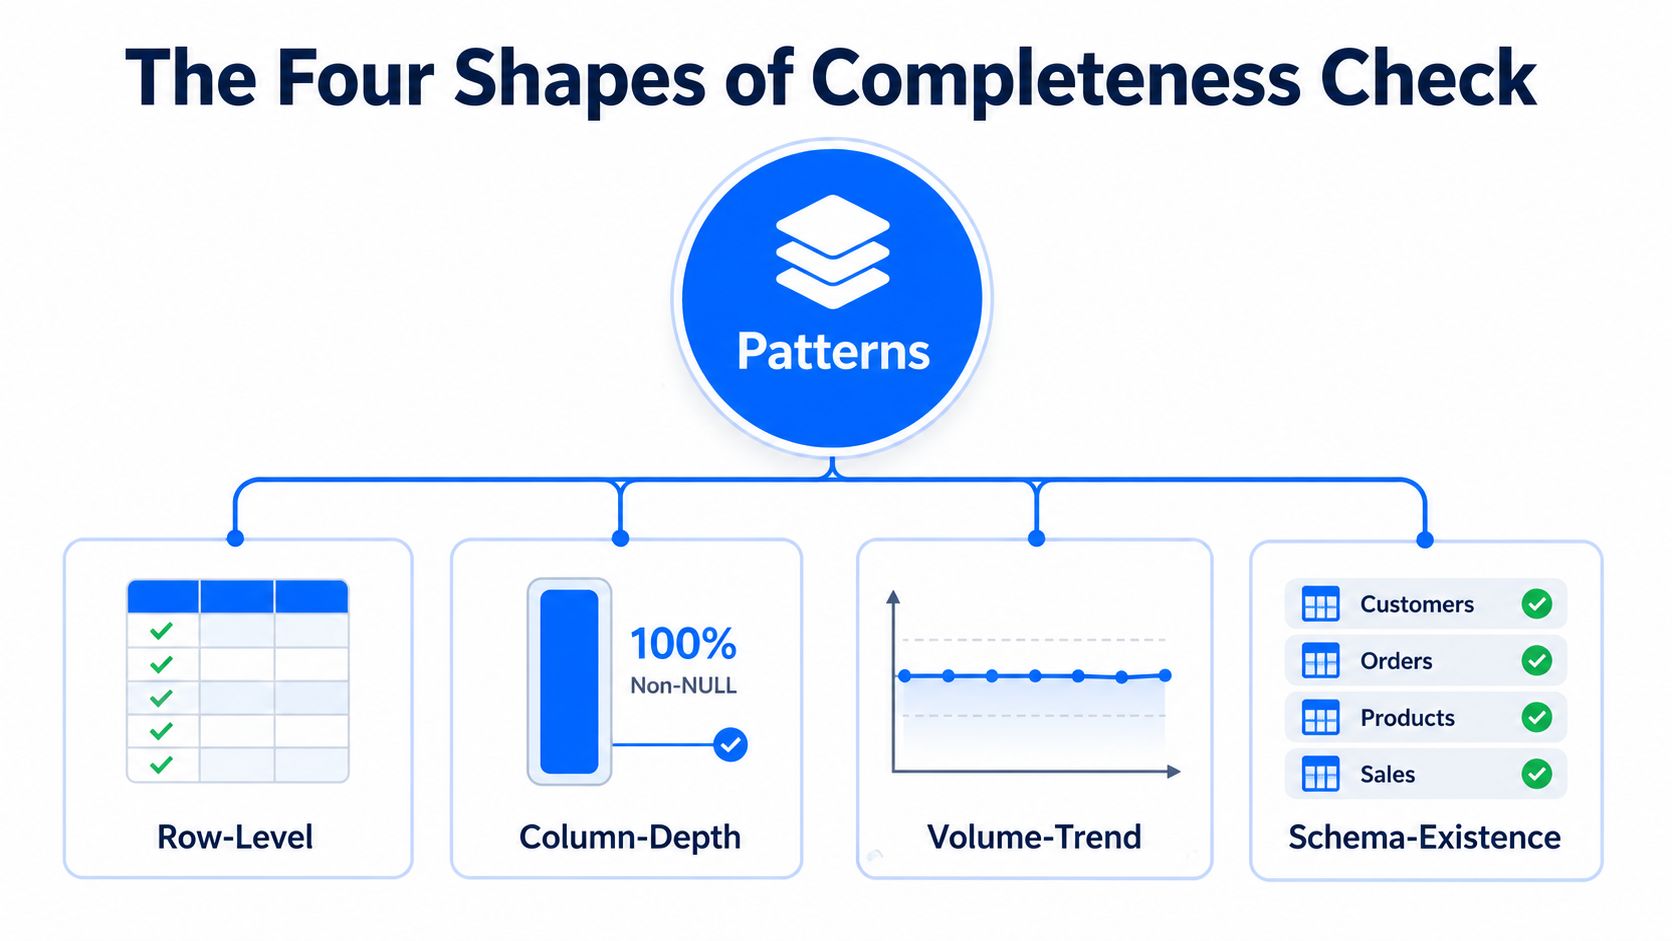
The Four Shapes of a Completeness Check You Will Run
A completeness check should match the failure you are trying to catch. A retail model with one expected row per store needs a different check from a customer dimension with required attributes, and both are different from a daily batch that never arrived. The mistake is to treat one pattern as if it covers every gap.
Row, Column, Batch, and Relationship Checks
Row-level checks verify that every expected entity is present. If the source says there should be one record per active customer, the warehouse should contain that full population, not a near match. This pattern catches silent row loss and load truncation, but it will not tell you whether a field inside each row is empty.
Column-level checks look for required attributes being populated. If customer_id or order_date is missing in a fact table, the row may still exist while the downstream model becomes unreliable. This pattern is strong for mandatory fields, weaker for source-to-target loss.
Incremental or partition-level checks compare a batch against the expected delta. They are useful for daily files, hourly streams, or partitioned tables where the biggest risk is a missing slice. A partition check catches a skipped file, but it will not detect that one column was corrupted inside the file.
Referential checks confirm that foreign keys still resolve. A fact row with a customer_id that no longer exists in the dimension is complete in the narrow row-count sense, but incomplete in the relational sense. CDC and warehouse teams often discover these after a schema change or a late-arriving dimension batch.
The CDC and observability angle matters because completeness problems usually overlap with other failure modes. Monte Carlo's framing of attribute-level and record-level completeness is useful because it separates column gaps from row gaps (Monte Carlo completeness overview). Adverity's source-to-target view is equally practical, since it treats completeness as verifying that all anticipated data has moved from source to target (Adverity completeness check). For teams that need a concrete source-to-target comparison, data reconciliation in the warehouse gives that check a direct operational shape.
A warehouse can be incomplete for analytics and still complete enough for control reporting. That makes completeness a fitness-for-use decision tied to timeliness and SLA coverage. A late load can hurt more than a sparse load that arrived on time, because downstream jobs may have already missed their window.
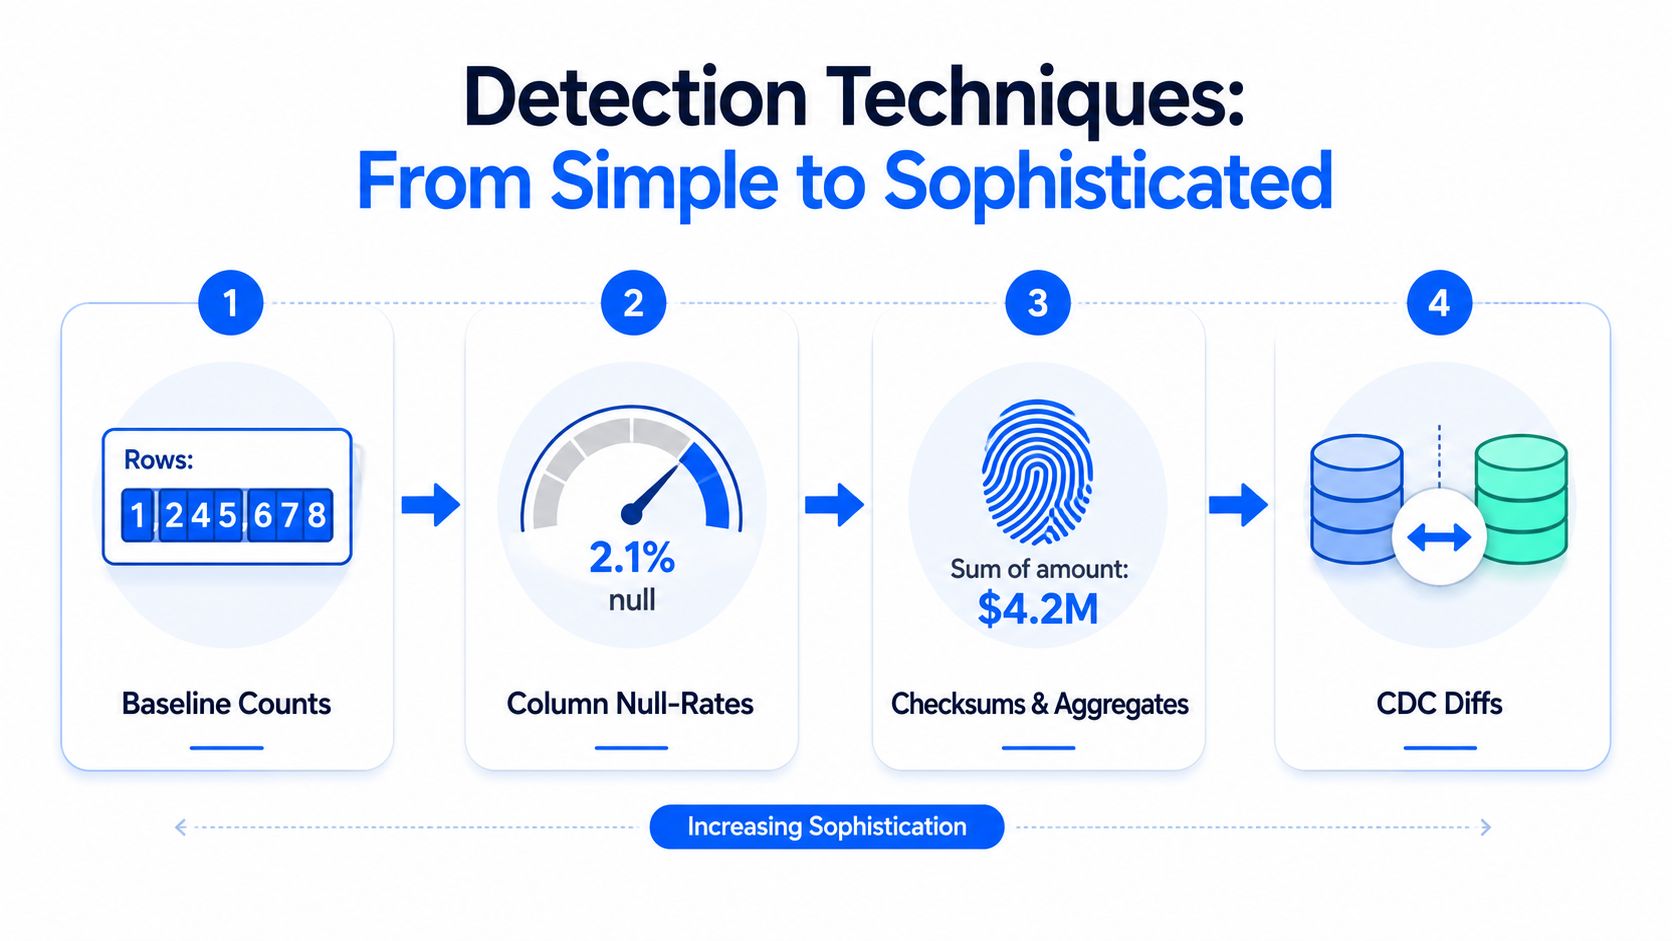
Detection Techniques From Simple Counts to CDC Diffs
You don't need a giant framework to start. Teams begin with row counts and null-rates, then add stronger controls as the data gets more valuable or more fragile. The point is to stack techniques so each one catches a different class of miss.
Start With the Baseline
A baseline check is usually the first line of defense.
Those checks are cheap, easy to explain, and easy to automate. They catch obvious record loss and obvious missing fields, which is why they're still worth doing even in mature warehouses.
Add Aggregates, Watermarks, and Diffs
When row counts are too blunt, add aggregates and checksums.
That pattern catches situations where the row count looks fine but the payload changed in transit. For incremental models, a watermark is often the most telling signal.
If the watermark stops advancing, the pipeline is stalled even if yesterday's counts still look normal. For source systems that emit change events, CDC diffs are stronger because you compare what arrived in the warehouse with what the source emitted.
One useful internal reference for that source-to-target pattern is the write-up on reconciliation meaning, because completeness and reconciliation are often operational siblings.
Timeliness belongs in this stack too. A dataset can be structurally present but still incomplete for an operational decision if it arrives after the SLA window. That's why late data shouldn't be treated as a side note. It's often the same failure class wearing a different mask.
If the business needs the data by 8 a.m., a perfectly populated table at 11 a.m. is still incomplete for the decision it was meant to support.
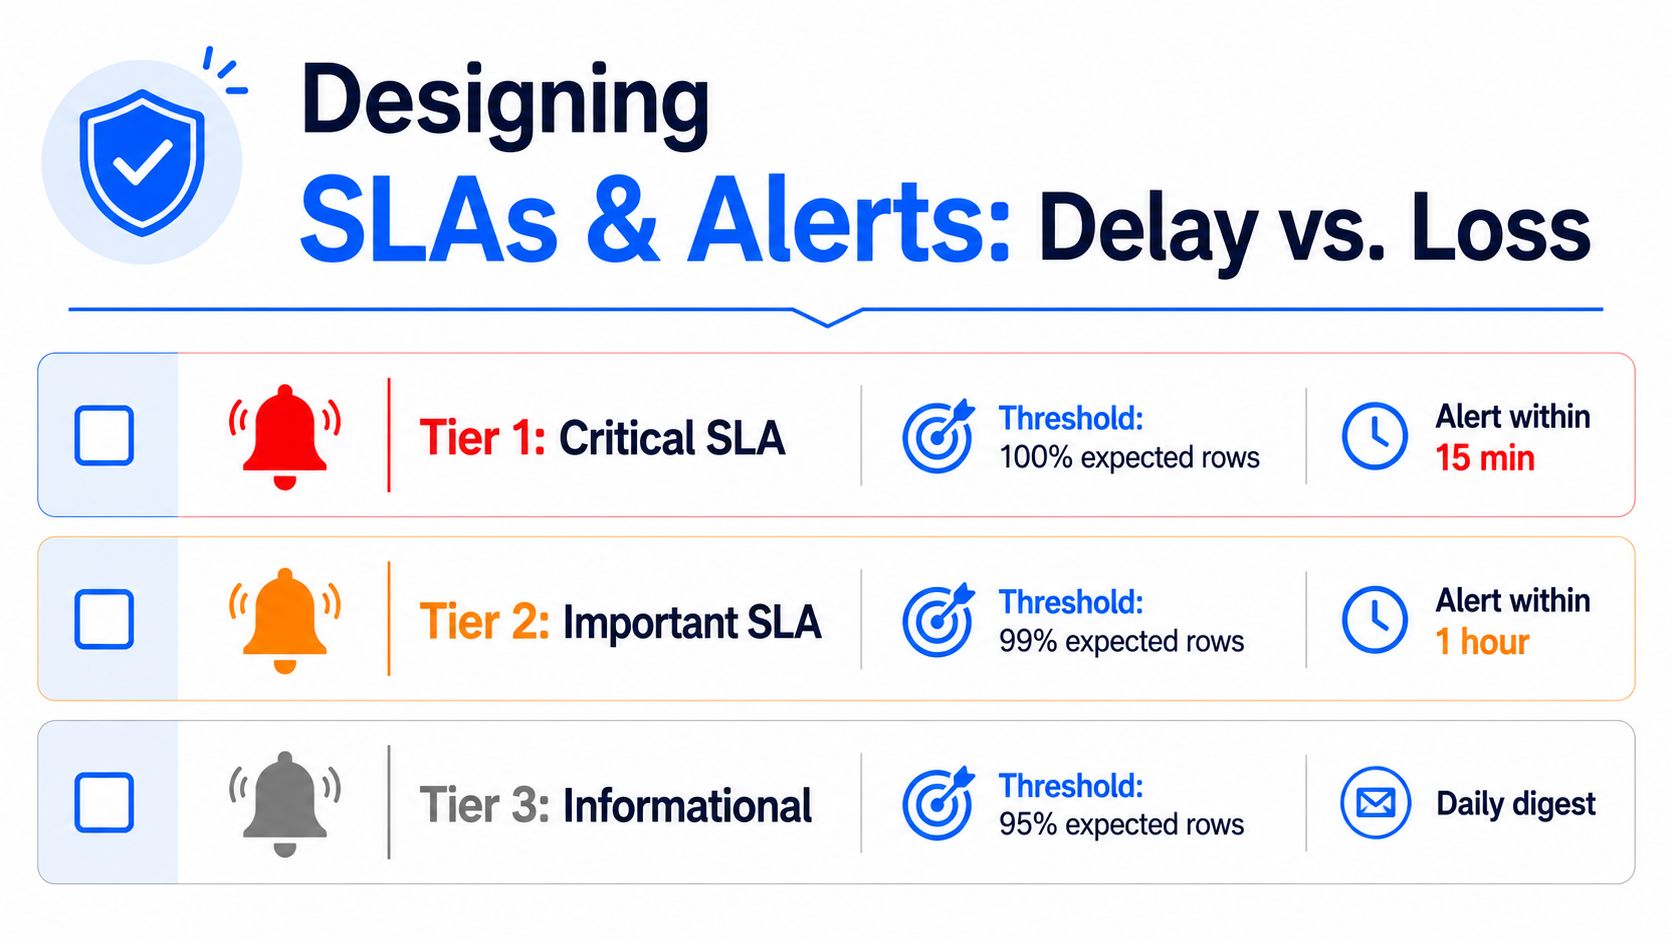
Designing SLAs and Alerts That Distinguish Delay From Loss
A warehouse can be full and still miss its deadline. A batch lands, the row count looks healthy, and the dashboard stays green, but the business team needed that table before the morning cutoff. SLA design has to separate delay from loss before an alert reaches the pager, because those two failures call for different responses.
Tiering gives you a practical way to do that. Tier 1 should cover the fields that drive hard decisions, where missing values mean the data is not fit for use. Tier 2 works for operational columns where a small gap matters, but does not always justify an immediate page. Tier 3 fits enrichment fields that are better watched for drift than escalated on every change. The CDC's worksheet approach fits this pattern well, since it starts with the minimum and core items that matter most for the use case, then expands to extended fields only when they affect the decision (CDC data quality worksheet).
Baselines need to come from the source itself. A drop in event volume can be normal for one feed and a real problem for another, so a warehouse-wide threshold usually hides more than it reveals. A nightly file that is steady for months needs a tighter expectation than an API that naturally swings with user activity. The Scottish Government guidance makes the same point in different words, analysts should compare a change against prior patterns and other reference points before calling it real (Scottish Government statistical quality guidance).
A simple routing model keeps the response aligned with the business impact.
Critical tables: page the on-call owner right away.
Operational tables: send an alert to the data channel and open a ticket.
Enrichment tables: send a digest and review the trend in the weekly governance meeting.
The execution model matters too. If the checks run in the customer's database, the team can compare freshness, schema drift, and record-level completeness against the same source of truth instead of stitching together separate jobs and dashboards. digna does that kind of in-database observability, combining historical baselines with validation and monitoring in one interface (digna observability overview). That setup changes the operational picture, because a late feed, a missing partition, and a real schema break can be evaluated in the same place before anyone decides whether to page, ticket, or wait.
Investigating and Remediating a Failed Completeness Check
An orders fact table can pass row counts and still fail where it matters. I've seen the pattern most clearly when the table had all the rows but a referential check against the customers dimension started failing after a late-arriving batch updated some keys. The numbers looked fine at first glance, but the join was no longer trustworthy.
The first move is scope. Check which partitions failed, which upstream sources fed them, and whether the issue is isolated to one day or spread across a wider window. Then compare arrival times against the expected delivery pattern, because a missing or late batch often explains the symptom faster than a deep schema dive.
The second move is to separate transient gaps from structural ones. A transient gap looks like delayed delivery, backfill lag, or an upstream outage. A structural gap usually points to a schema change, a broken default, a routing issue, or a transformation rule that no longer matches the source.
In one incident, the root cause was a schema change that introduced a new status code without a default handling path. The fix wasn't just “rerun the job.” The team had to decide whether to backfill from CDC logs, accept the gap with a documented exception, or block downstream consumers until the customer dimension was consistent again. The right answer depends on whether the downstream decision can tolerate partial data.
A simple triage flow helps:
Confirm the failure shape. Is it row loss, field loss, or referential loss?
Check upstream timing. Did the source arrive late or not at all?
Inspect historical behavior. Is this unusual for this source or normal variance?
Choose the remediation. Backfill, suppress, block, or document.
That workflow is faster when your warehouse already stores lineage, freshness, and check history in a way operators can inspect without jumping between five tools.
How an In-Database Observability Platform Reshapes the Picture
A lot of teams still run completeness checks as scheduled SQL, view the results in BI, and route alerts through chat. That works until the number of pipelines grows and the checks start competing with product work. An in-database observability platform changes the operational shape by executing where the data already lives and learning from historical metrics instead of forcing every check to be hand-tuned.
That distinction matters for two reasons. First, customer data stays inside the customer's environment when the platform executes in-database, which reduces data movement and keeps sensitive records in private cloud or on-prem setups. Second, the platform can combine observability signals like anomaly detection, timeliness, and schema tracking with data quality validation rules in one place, instead of asking engineers to stitch together separate tools for each layer.
The practical result is a smaller detection stack. Instead of dozens of scheduled jobs, you get a tighter set of always-on inspections that watch for missing arrivals, schema drift, and unexpected behavior against learned baselines. That's a better fit when the warehouse is large, the sources are volatile, and the business needs a fast answer to whether a gap is a delay or a real loss.
For teams that want to keep the controls close to the data, the digna platform overview shows the model clearly. It's not a replacement for good warehouse design, and it won't rescue a weak ownership model, but it does compress the distance between detection, triage, and response.

A One-Week Completeness Checklist for Your Pipelines
Start with two critical data elements per pipeline, then define one attribute-level and one record-level check for each. That prevents the classic mistake of monitoring every field equally and missing the ones that break controls.
Add a watermark or CDC diff next. That catches silent batch loss and stalled incremental loads, which row counts alone can miss. If the pipeline is batch-based, compare arrival times to the expected schedule so a late feed doesn't trigger the same response as a missing one.
Set tiered SLAs after that. Give the most important tables hard thresholds and fast routing, then keep enrichment fields on trend monitoring so you don't page people for noise.
Schedule a weekly review where operators triage anomalies, adjust thresholds, and document exceptions. That's the point where completeness becomes a maintained control instead of a one-time rule.
Move | Failure it prevents | Smallest implementation |
|---|---|---|
Pick two critical data elements | Missing fields that break controls | One null check per field |
Add record-level completeness | Partially loaded rows | Required-field presence check |
Layer watermark or CDC diff | Silent row loss | Compare max timestamp or CDC keys |
Set tiered SLAs | Alert fatigue | Route critical vs informational alerts |
Review weekly | Stale thresholds | Short anomaly review meeting |
Completeness is not a number you hit, it's a fitness-for-use decision you make and revise.
digna helps teams run data completeness checks where the data already lives, then pair them with anomaly, timeliness, and schema monitoring in one controlled environment. If you want to tighten warehouse trust without scattering checks across scripts and dashboards, visit digna and see how in-database observability can fit into your pipeline review process.


