Disparate Sources of Data: A Practical Integration Guide
|
7
min read
You've probably lived this already. A Monday standup starts with one person saying the CRM says last quarter was strong, finance says the margin story looks different, and the product warehouse shows a third number entirely. Nobody's lying, but the room still goes quiet because each report is describing a slightly different version of the business.
That's what makes disparate sources of data so frustrating. The breakage rarely starts with a dramatic outage, it starts with tiny decisions, a timestamp interpreted one way in one pipeline, a refund rule updated in another, or an “active customer” definition that drifted just enough to warp the dashboard. If you've inherited a reporting stack that grew through past initiatives, mergers, vendor swaps, and “temporary” fixes that never left, you already know how normal this feels.
Table of Contents
When Your Reports Stop Agreeing
A finance lead walks in with a spreadsheet, a product analyst opens the warehouse dashboard, and the CRM team points to their own revenue view. All three numbers look reasonable at first glance, which makes the disagreement worse, not better. The team doesn't get a clean failure signal, it gets three plausible stories that can't all be true at once.
That's usually the moment people blame the warehouse, the BI layer, or the last ETL job they touched. The cause is often upstream. One pipeline may have converted timestamps in local time, another may have applied a new refund policy, and a third may still be counting an “active customer” by a definition nobody documented after the last launch.
This is why data reconciliation is less about “making reports match” and more about tracing which system owns which version of reality. A useful starting point is a simple mental model: every source has its own rules, and those rules can diverge without any single team intending to cause trouble. For a plain-language definition of that reconciliation problem, see digna's data reconciliation overview.
Practical rule: if three reports disagree, don't start by rewriting the dashboard. Start by asking which field, rule, or timestamp changed first.
The confusion is so common because modern data stacks are built from accumulated history, not from one clean architecture diagram. That means the same business event can be represented in a CRM, a finance system, a warehouse, and a support tool, each with its own cadence and its own vocabulary. Once that happens, “the number” stops being one number and becomes a negotiation across systems.
What Disparate Sources of Data Really Means
“Disparate” sounds like a format problem, but that's only the first layer. One source might arrive as JSON, another as CSV, another as parquet, and a vendor export may be locked inside its own structure. Even at that level, the shape of the data already changes how you ingest, parse, and validate it.
The next layer is cadence. A nightly batch file, a streaming event feed, and a manually maintained spreadsheet all behave differently in a pipeline. If you treat them the same, the freshest source can still be the least trustworthy because it lands at the wrong time, with the wrong expectations attached to it.
Then comes the layer most guides skip, semantics. Two systems can both have a column called customer_id, but one may be the system-of-record primary key while the other is a marketing identifier that was anonymized for campaign reporting. The labels match, the meaning doesn't, and that's where naïve joins mislead people.

The stack of mismatches
A good way to think about disparate sources of data is as a stack. Format differences sit at the bottom, system boundaries sit above that, and semantic differences sit at the top where the business meaning lives. Each layer compounds the one below it, which is why a join can look technically successful and still be analytically wrong.
When teams search for a better discovery process across warehouses, APIs, and legacy tools, they usually need a way to surface those layers early. A practical starting point is data discovery guidance from digna, because source inventory and meaning checks need to happen before transformations harden bad assumptions.
A dataset can be perfectly formatted and still be wrong for the question you're asking.
That's the core misunderstanding. People often assume data integration is mostly about moving bytes from one place to another. In practice, it's about lining up format, cadence, system design, and business meaning so the final view doesn't just load successfully, it tells the truth.
Four Practical Challenges You Will Hit First
The first integration problems show up fast, and they usually look mundane. A Stripe webhook payload arrives as nested JSON while a legacy ERP still emits fixed-width nightly files. The shape mismatch is obvious, but the cost is the constant schema inference and the human time spent deciding which field is authoritative.
The four failure modes that surface early
Challenge | What It Looks Like | Typical Symptom |
|---|---|---|
Format heterogeneity | Nested JSON on one side, fixed-width exports on the other | Load jobs break or infer the wrong schema |
Cadence mismatch | Real-time tickets mixed with weekly survey files | Dashboards age silently and confuse users |
Quality variance | Third-party enrichment beside incomplete first-party clickstream | Nulls, duplicates, and unstable aggregates |
Semantic conflict | “Country” means ISO code in one system and free text in another | Joins succeed, but the KPI is wrong |
Cadence mismatch is the one that fools teams hardest. Support tickets can stream in near real time while customer satisfaction surveys arrive in a weekly CSV, which means any “last 24 hours” view can be incomplete without looking broken. If the analyst doesn't know the lag profile of each source, they'll mistake freshness differences for business changes.
Quality variance is the quiet killer. Third-party enrichment can sit next to first-party clickstream data with missing sessions, duplicate identifiers, or inconsistent records, and the merged output can still look clean enough to pass a casual scan. That kind of instability is exactly why source quality has to be treated as part of the design, not as cleanup work after the fact.
Semantic conflict is the hardest one because it hides behind familiar field names. A source that uses country for ISO codes, another that stores free text, and a third that keeps a stale abbreviation are all “right” inside their own systems. The moment you compare them, the business meaning fractures.
For teams trying to understand how structural drift turns into broken pipelines, schema drift guidance from digna helps frame the problem as an operational one, not just a modeling annoyance.
If the field name looks familiar, slow down. Familiar names are where semantic bugs hide.
That's why integration projects stall so often. The first issues are not exotic, they're ordinary and repeated, and they force teams to choose between speed and trust before the shape of the stack is even settled.
Integration Strategies Worth Choosing Between
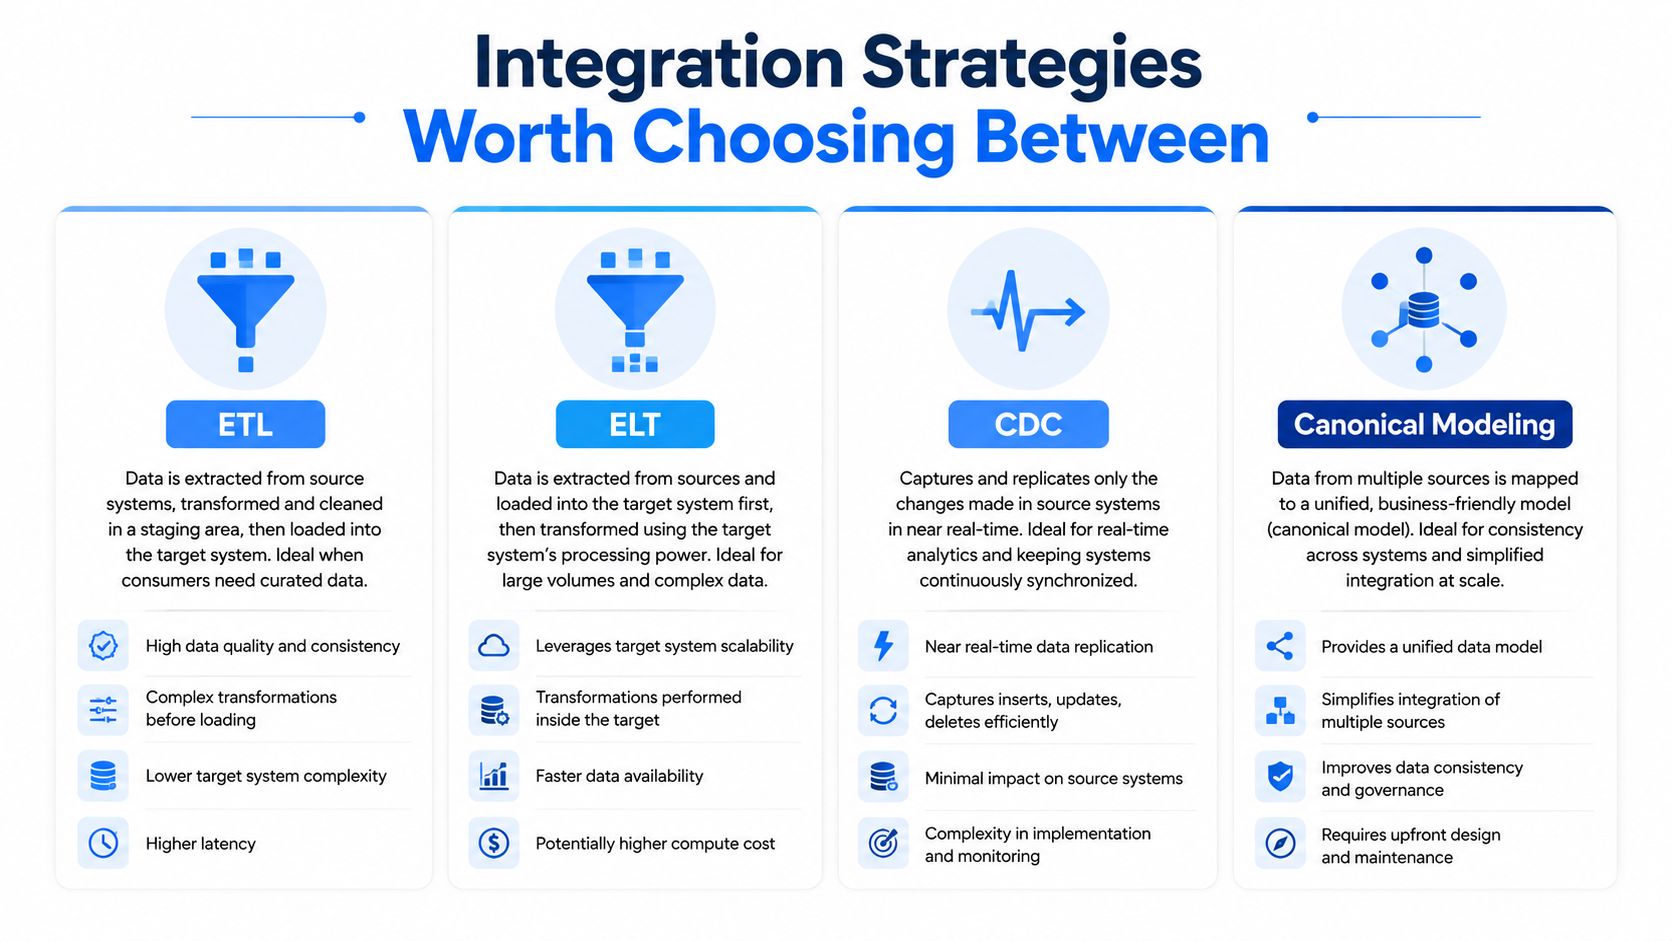
ETL, ELT, CDC, and canonical modeling solve different problems, and they're easy to misuse when people treat them like ideology. ETL works when consumers need shaped, curated data and the source systems are stable enough that you can transform before load without constant rework. It's a good fit for legacy consumers, compliance feeds, and reporting layers that should only see vetted structures.
ELT makes more sense when the warehouse is fast and analysts want raw fidelity first, transformation second. That lets teams preserve source detail and revisit logic later without re-pulling the data. It's especially useful when business questions change faster than the source systems do.
CDC belongs in the operational lane. When downstream systems have to reflect source changes quickly, change data capture keeps the lag small enough that product, support, or finance workflows can stay aligned with what just happened. The tradeoff is that CDC can move uncertainty faster, so it still needs validation on arrival.
Canonical modeling solves a different problem altogether, agreement. If sales, product, and finance all need the same definition of customer or product before any downstream work begins, a canonical model gives them one shared contract. It's slower up front, but it prevents every team from inventing its own truth downstream.
The smartest stacks usually mix these patterns. A team might land CDC into a staging zone, use ELT inside the warehouse, feed a canonical model into BI, and still use ETL to shape exports for a legacy system. That's not inconsistency, it's fit-for-purpose architecture.
If you're comparing integration options for analytics and privacy-sensitive use cases, a privacy-first BI solution can be useful context because the integration pattern and the consumption layer usually have to be designed together.
For warehouse-centric projects, digna's data warehouse integration page is a useful reference point for how the loading and serving layers connect in practice.
The right integration strategy is the one that matches the consumer, the latency requirement, and the amount of trust you can enforce at the boundary.
A lot of teams lose weeks arguing over which pattern is "modern." That argument misses the point. The key question is which pattern keeps the semantic contract clear enough that downstream teams can use the data without reverse-engineering it.
Harmonization and Validation That Hold Up
Harmonization starts with deduplication, but not the simplistic kind that assumes exact keys already exist. Independent systems rarely share perfect identifiers, so blocking keys and probabilistic matching often become necessary just to determine which records probably refer to the same entity. That step should happen before merge logic hardens duplicate counts into fake certainty.
Normalize the meaning before the number
Once records are aligned, normalize the unit layer. Currencies, timezones, measurement systems, and fiscal calendars all create invisible mismatches when teams assume a value means the same thing everywhere. A revenue number in local time and a revenue number in UTC can both be correct and still not be comparable.
Semantic reconciliation comes next. Mapping tables and authoritative definitions matter here, because field names often hide business-rule differences that no type check will catch. A clean column name doesn't help if one source treats “customer” as an account, another as a user, and a third as a billing entity.
The same principle shows up in “golden record” work, where teams try to decide which version of a customer, product, or location should carry forward. If you want another practical framing of that problem, the BatchData golden record approach is a useful external reference for how a shared record layer changes downstream consistency.
Validation should sit on top of harmonization, not after it. Schema checks belong at the boundary, referential integrity checks belong between systems, business rules like non-negative quantities belong in the pipeline, and row-level reconciliation should compare control totals from each source. For a structured way to think about those checks, digna's validation rules guide is relevant because validation has to travel with the data, not wait for a dashboard to complain.
Where validation belongs
Validation at the end is too late. By the time the dashboard looks wrong, the context that would explain the failure has already aged out.
The strongest pattern is to validate at every handoff, because each handoff still has the source context, the owner, and the original expectation. That makes remediation faster and arguments shorter. It also stops teams from treating merged data as trustworthy just because it survived a load job.
Monitoring as an Early Warning System
Monitoring only helps if it catches the cause before the report turns into a mystery. The cleanest way to do that is to track timeliness, anomalies, and schema changes together, not as separate queues. If a source lands late, the dashboard is already aging, even if the numbers still look polished.
Timeliness monitoring is the first line of defense because freshness problems often start upstream and spread downstream without a visible break. If an SLA slips, the team needs to know before business users start making decisions off stale data. That matters most where a late-arriving source can alter a KPI without changing the shape of the chart.
Anomaly detection covers a different class of failure. Volume shifts, distribution shifts, and null-rate spikes can reveal a broken filter, a missing join, or a bad upstream deployment long before someone notices a revenue dip. That's the value of watching the behavior of the source, not just the outcome in the dashboard.
Schema tracking closes the loop. Column additions, type changes, and nullability drift are the quiet structural changes that break downstream consumers after a pipeline seems to be “working.” For data systems that need to react to changing classification and protection requirements, NIST notes that monitoring should catch changes in the asset itself and trigger revised controls when needed, which is why schema tracking belongs in the operational loop, not just in documentation.
A practical monitoring view is one dashboard grouped by source, with lineage pointers attached to every alert. That lets an on-call engineer trace a late file, a volume anomaly, or a schema change back to the origin system without jumping between tools. The best teams stop asking, “Which report is wrong?” and start asking, “Which source changed first?”
Monitoring signals and what they catch
Signal Category | What It Tracks | Failure Caught Early |
|---|---|---|
Timeliness | Arrival delay, missing loads, early arrivals | Stale dashboards and silent lag |
Anomaly detection | Volume, distribution, null-rate shifts | Broken filters, missing joins, upstream breaks |
Schema tracking | Added columns, type changes, nullability drift | Pipeline failures from structural change |
The difference between reactive and proactive monitoring is timing. Reactive teams hear about the problem after users complain. Proactive teams catch the cause while it's still small, and that saves both trust and incident time.
A Working Checklist for Your Next Integration Project
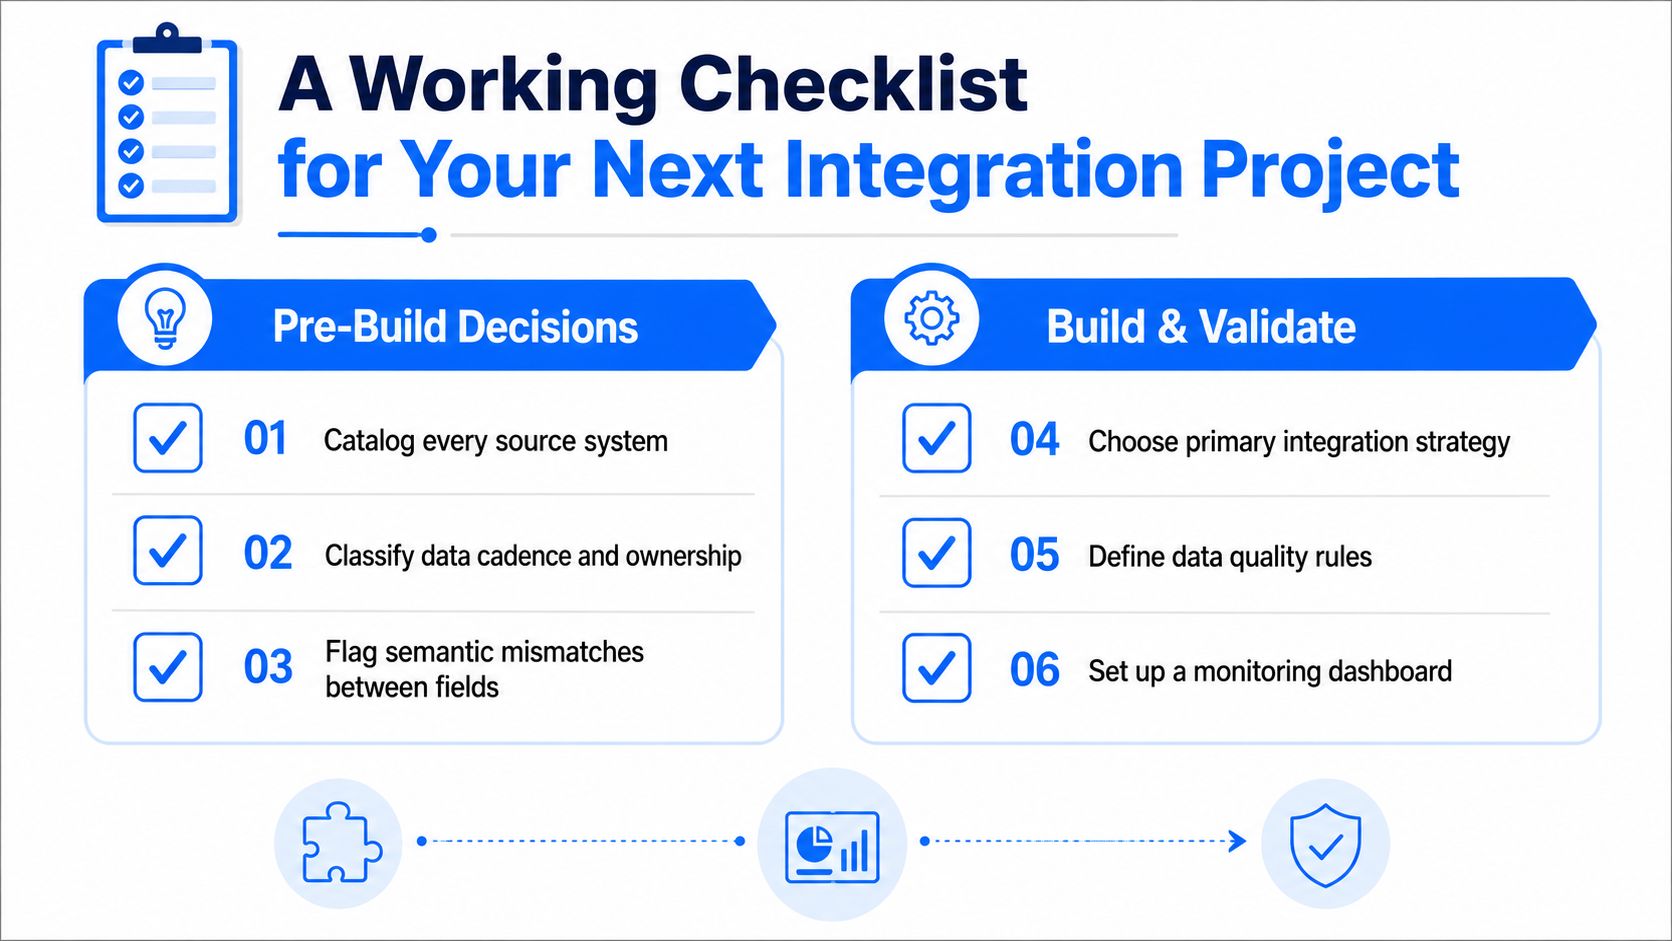
Start before you write the first transform. Catalog every source, classify its cadence, and identify the owner who can answer schema and meaning questions quickly. Flag semantic collisions early, especially for fields like customer, revenue, country, and product.
Pre-build decisions
Catalog every source system, so you don't discover a hidden spreadsheet after launch.
Classify cadence and ownership, so late files and unclear handoffs don't become surprise incidents.
Flag semantic mismatches, so teams don't reuse the same field name for different business meanings.
Build and validate
Choose the primary integration pattern, ETL, ELT, or CDC, based on the consumer and latency need.
Document the canonical model first, so transforms don't encode competing definitions.
Set validation thresholds and freshness alerts, so bad loads fail fast instead of leaking into BI.
Add schema-drift monitors and row-count checks, so dropped sources and structural changes show up before users do.
If you need a concrete sequence, run a one-day source audit, draft the canonical schema on a whiteboard, and wire one observability check into the highest-traffic pipeline. That's enough to stop the first round of silent failures without waiting for a committee to bless the architecture.
If your team is dealing with mismatched reports, semantic drift, or pipelines that only fail after the dashboard is already wrong, digna gives you a way to monitor timeliness, validation, schema changes, and anomalies inside your own environment. Visit digna to see how that fits into a real integration stack, and use it as a starting point for building data your teams can trust.
Frequently asked questions
What does "disparate sources" actually mean?
More than a format problem. Format is only the first layer; underneath sit different definitions, different update cadences and different ideas of which system owns which version of reality, and those are what make reports disagree.
Where should you start when three reports disagree?
Not by rewriting the dashboard. Start by asking which field, rule or timestamp changed first, because reconciliation is less about making reports match and more about tracing which system owns which version of reality.
Why do modern stacks produce this problem?
Because they are built from accumulated history rather than from one clean architecture diagram. Each system arrived to solve a specific problem at a specific time, and the overlaps between them were rarely designed deliberately.
Who typically gets blamed first?
The warehouse, the BI layer or the last ETL job someone touched. That reflex is understandable and usually wrong, since the disagreement normally began further upstream in a definition rather than in the layer where it became visible.
What does harmonization require beyond mapping?
Agreement on ownership. Mapping fields between systems handles the mechanical part, while deciding which system is authoritative for each concept is the part that stops the same argument recurring every quarter.


