DBT Semantic Layer Guide: Architecture, Benefits & 2026
|
6
min read

You know the meeting. Finance has one revenue number in the board deck, marketing has another in Tableau, and the product team is staring at a third version in Power BI. Everyone is looking at the same company, the same month, and somehow three dashboards are telling three different stories. That's the moment the dbt semantic layer stops being a nice architecture idea and starts looking like a basic requirement for trust.
At its best, a semantic layer gives your team one governed definition of a metric, then lets many tools consume it without re-creating the logic in each place. dbt describes that approach as a unified, business-friendly representation of data and a centralized repository for metric logic so consumers can access consistent, governed data across multiple endpoints semantic layer introduction. The hard part isn't the definition itself. It's making sure that definition survives the messy reality of production data, tool sprawl, and changing business rules.
Table of Contents
Why Three Dashboards Show Three Different Revenue Numbers
The disagreement usually starts in a room, not in a diagram. A CFO asks why the monthly recurring revenue number in one dashboard doesn't match the one in another, and three analysts start tracing the logic back through separate toolchains. One report excludes refunds, another counts them later, and a third is slicing by a different date field entirely. Nobody is lying. The definitions just drifted apart.
The real problem is duplicated logic
That drift happens because each analytics surface tends to reimplement the business rule in its own way. A BI tool gets one expression, an embedded app gets another, and a quick SQL query in a notebook becomes the “temporary” version that somehow sticks around for months. Once that starts, the company isn't really measuring revenue anymore, it's measuring every team's local interpretation of revenue.
dbt's framing is useful because it treats this as a governance problem, not a convenience feature. It describes the semantic layer as a framework for creating a unified, business-friendly representation of data and a centralized repository for metric logic so consumers can access consistent, governed data across multiple endpoints semantic layer introduction. That's the point, one definition should feed many consumers without forcing every consumer to own the math.
Practical rule: If two dashboards disagree and both are technically “correct,” the root cause is usually duplicated metric logic, not a bad chart.
What this does and doesn't solve
A semantic layer doesn't magically fix messy source tables or sloppy model design. It does something narrower and more valuable, it makes metric logic centrally defined so the same business question can be answered consistently in BI tools, apps, and APIs. That consistency matters because the same metric definition can serve multiple endpoints without each one re-implementing joins, filters, and time logic from scratch.
It also changes the conversation inside analytics teams. Instead of asking, “Which dashboard is right?” you can ask, “Which definition is approved?” That sounds small, but it's the difference between endless reconciliation and a data product people can trust. The catch is operational, the semantic layer reduces duplication only after your team is disciplined enough to maintain one source of truth.
How the dbt Semantic Layer Is Actually Built
The three parts that keep metric logic honest
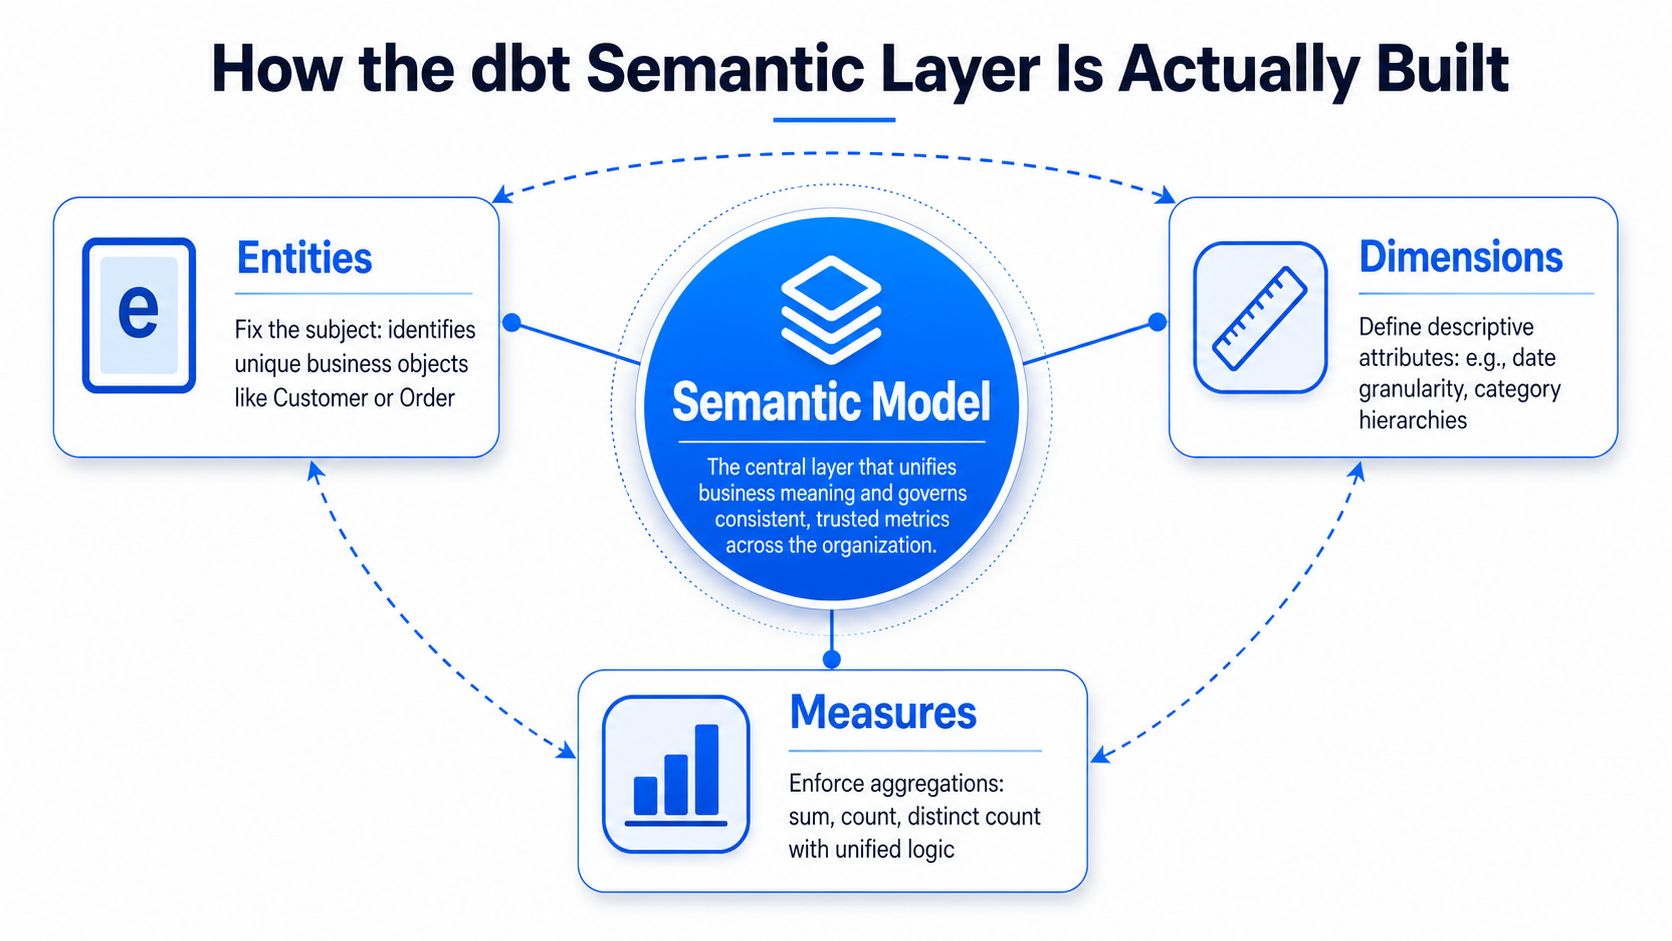
dbt's documentation breaks semantic models into three named components, entities, dimensions, and measures semantic model components. Each one exists to keep a different kind of mistake out of the metric definition.
Entities define relationships and grain. In plain English, they say what object a row represents and how this model connects to others. Dimensions are the fields people use to slice, dice, group, and filter results. Measures are the quantitative values that are meant to be aggregated. That separation matters because it forces you to think about identity, description, and calculation as different problems instead of jamming them into one loose expression.
Why MetricFlow matters
The dbt Semantic Layer is not just a metadata catalog sitting beside your warehouse. dbt describes it as a query-construction layer that takes governed metric definitions and generates warehouse SQL, including join logic, before the query is executed architecture docs. MetricFlow is the engine doing that work in dbt Labs' architecture after dbt Labs acquired Transform in early 2023, and it's the piece that turns a request like “monthly active customers” into actual SQL.
That distinction is easy to miss. A catalog tells you what exists. The semantic layer tells the warehouse how to compute it. It resolves the joins, applies the right time grain, and emits optimized SQL so the consuming tool doesn't need to know the model's internals.
A simple walkthrough
Say someone asks for monthly_active_customers in Tableau, an API, or an embedded dashboard. The consumer doesn't need to know where customer identifiers live, which table holds activity events, or how the time window is defined. MetricFlow takes the metric request, looks up the semantic model, resolves the necessary join path, and generates the warehouse query that returns the number.
That is why the semantic layer feels different from hand-built SQL views. The logic sits in one place, but the consumption surface can vary. In practice, that means a BI developer, an app engineer, and an analyst can all use the same metric definition without carrying separate copies of the calculation. The win is not just reuse. It's controlled reuse.
dbt Semantic Layer vs LookML vs BI-Tool Semantic Layers
Where the logic lives changes everything
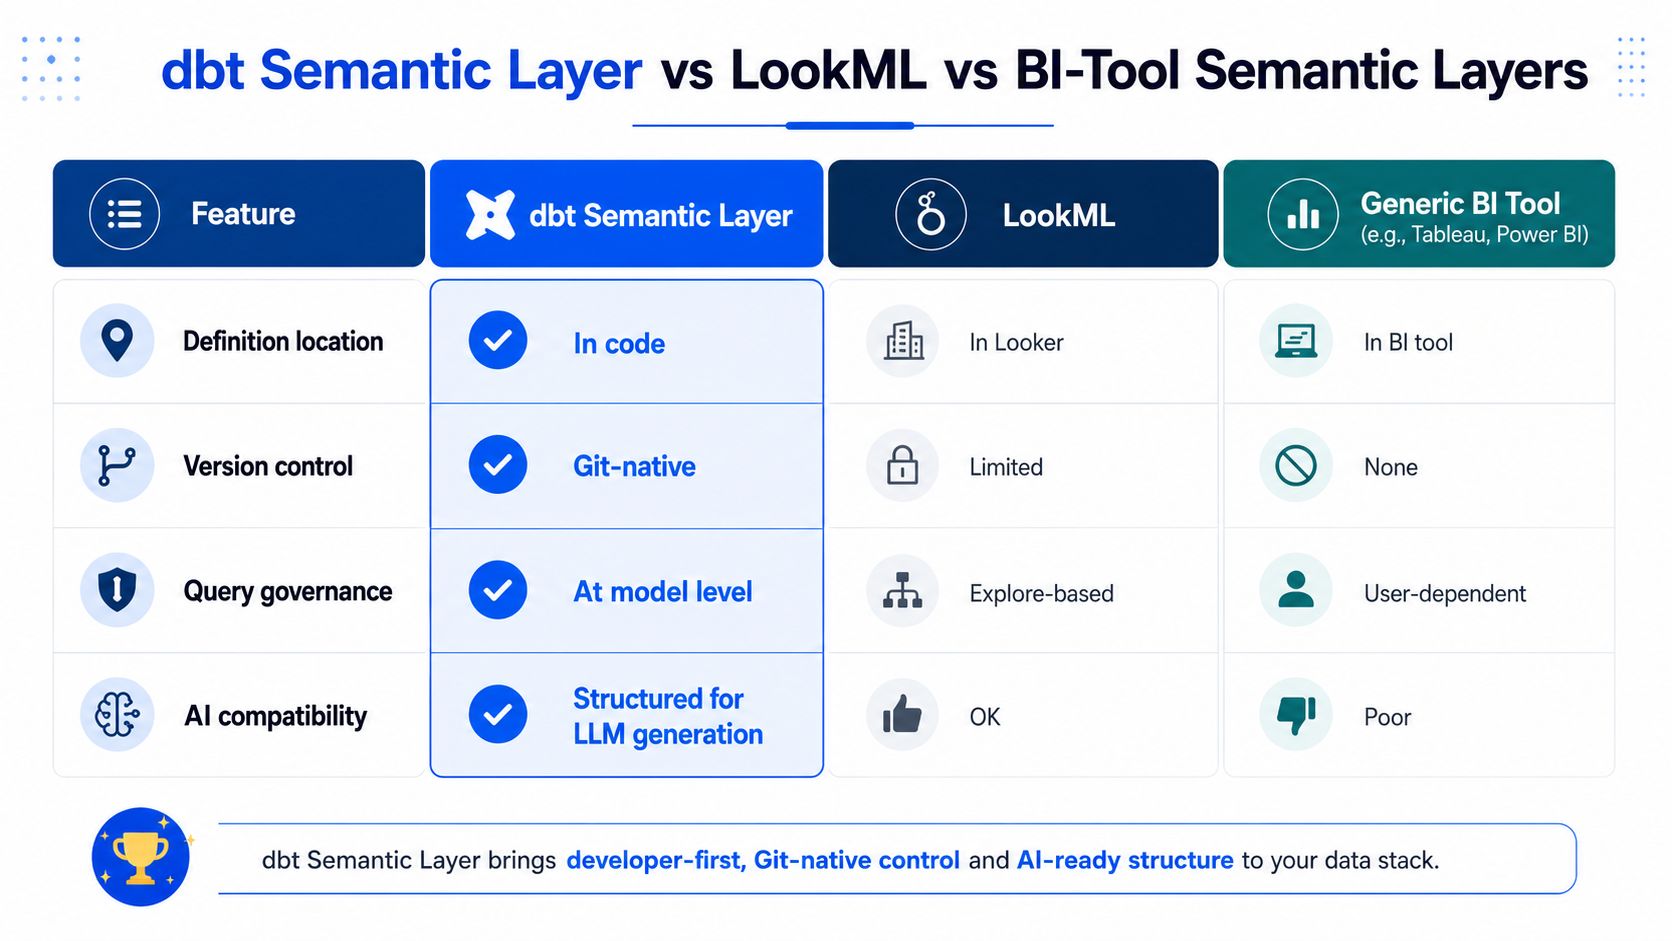
The simplest way to compare these layers is to ask one question, where does the metric definition live? In dbt, it lives in code alongside your models, which makes it part of the same version-controlled workflow as the rest of your transformation layer. In LookML, it lives inside Looker's modeling layer. In a generic BI tool, it usually lives inside that tool's own data model or calculation system.
That location decision affects governance. dbt's Semantic Layer is designed to be Git-native, which means changes go through pull requests, peer review, and deploy jobs just like the rest of the project. BI-tool semantic layers are convenient when a team only cares about one interface, but they tie governance to that interface. If the organization later wants the same metric in an API, an embedded app, or a different BI tool, the model often has to be rethought or duplicated.
What each layer is good at
LookML is strong when Looker is the center of gravity. It gives teams a semantic modeling environment inside that platform, and many teams like the speed of staying inside one product. Generic BI layers are fine for ad hoc calculations and local reporting convenience, especially when the business only needs one surface.
dbt's approach is different because it sits underneath the consumers. That means the same definition can power Tableau, Mode, an API, or an embedded dashboard without changing the metric logic for each endpoint. dbt's architecture documentation says the layer generates SQL, including join logic, before execution, so one semantic model can serve BI, API, and other consumers architecture docs.
A good rule of thumb, if governance needs to outlive the dashboard, keep the definition out of the dashboard.
The tradeoff to keep in mind
The main benefit of dbt's model is decoupling. The main cost is that teams have to take modeling discipline seriously, because a centralized layer can't rescue inconsistent definitions that were never standardized in the first place. BI-tool layers can feel easier at the start because they're close to the consumer, but that convenience often creates a stronger lock-in to one interface and a weaker story for metric reuse.
Why AI and LLM Querying Need a Semantic Layer
Natural language is not a metric definition
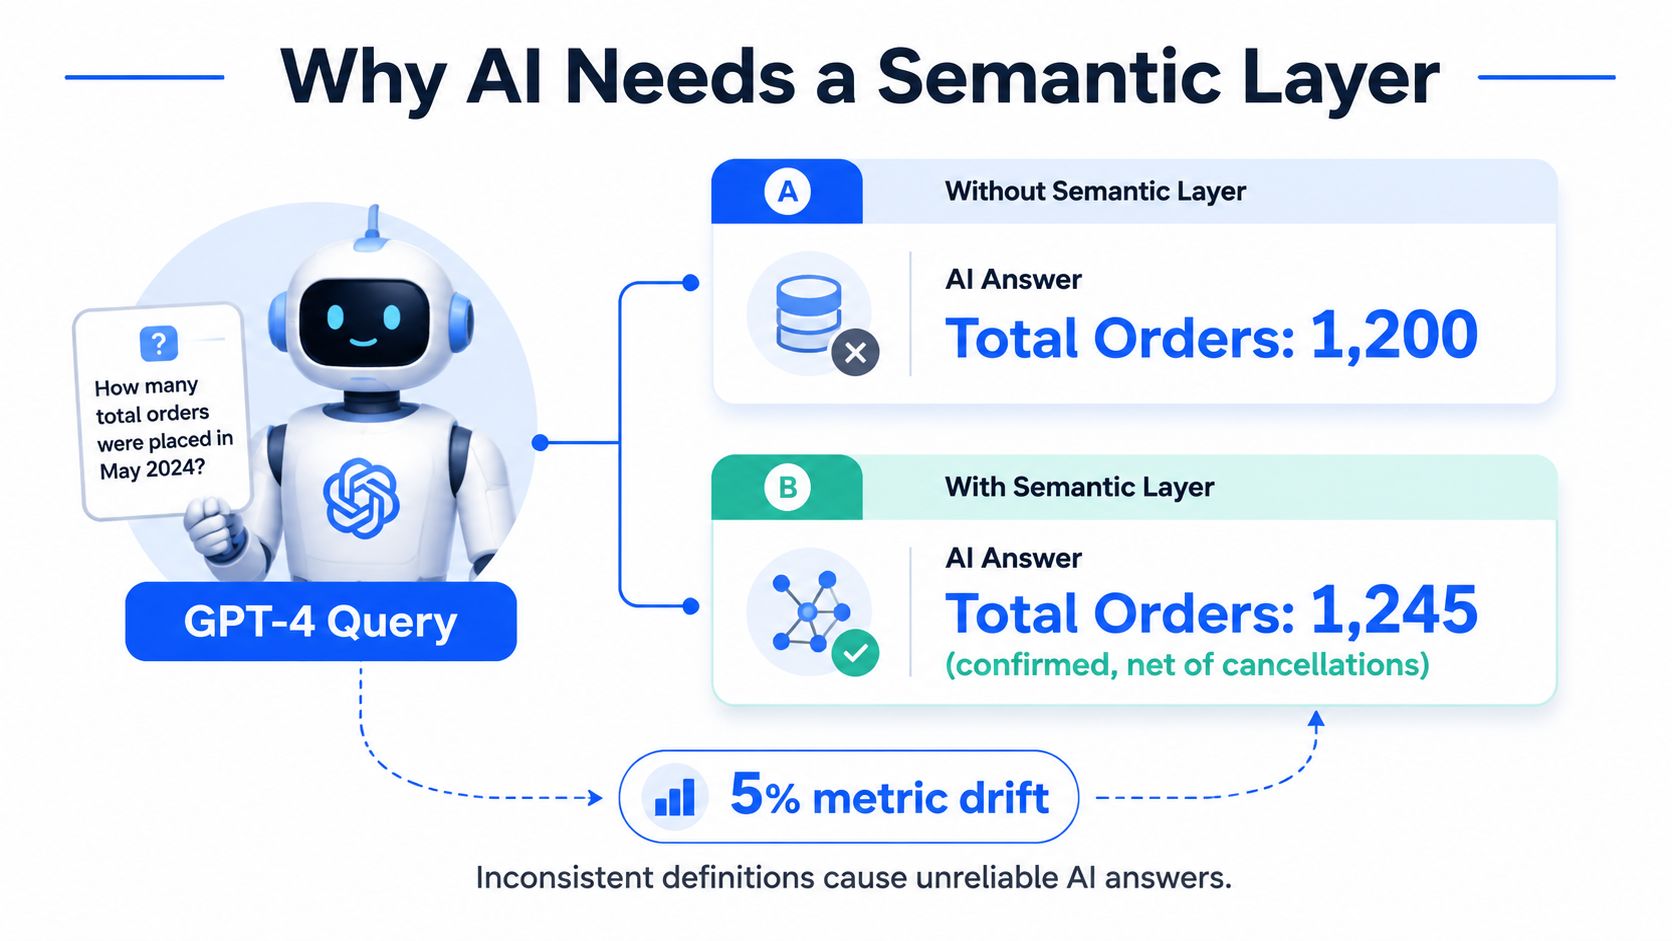
LLMs are now analytics consumers, which sounds useful until you remember how easily they can confuse similar columns, incompatible date fields, or ambiguous business terms. dbt documented an experiment where GPT-4 answering enterprise natural-language questions over SQL databases achieved 16.7% accuracy, while a knowledge-graph representation raised accuracy to 54.2%, a gain of 37.5 percentage points and more than 3x improvement. dbt also reported that the semantic-layer approach reached 83% accuracy on a subset of eight addressable questions LLM data interface experiment.
Those numbers matter because they show the shape of the problem. An LLM free-texting SQL against a warehouse can be clever and still be wrong in exactly the ways finance teams hate most. A governed metrics interface gives the model a constrained path to the answer.
Why governed metrics help AI behave
An LLM that can call a semantic layer does not need to infer the business meaning of every column. It asks for a metric, gets a governed definition, and uses that definition consistently across responses. That makes the assistant less of an improviser and more of a controlled query front end.
The operational takeaway is simple. If AI is going to tell leaders what the number is, then the number needs a definition stronger than a prompt. The semantic layer becomes the contract between human intent and machine execution.
That's also why this matters beyond chatbots. Any system that translates plain English into analytics queries benefits when the metric logic is centralized and explicit. The less the model has to guess, the less room there is for drift.
Setting Up the dbt Semantic Layer in Practice
Start with the warehouse and the YAML
A practical rollout starts with the warehouse, because dbt's setup guidance requires a previously successful dbt run on a supported warehouse such as Snowflake, BigQuery, Databricks, or Redshift setup guidance. From there, metric definitions live in YAML alongside the dbt model YAML, which keeps the semantic layer inside the same project structure as the rest of your transformations. That placement matters because it ties metric logic to the same review, versioning, and deployment habits your team already uses for models.
The workflow is intentionally controlled. You commit the change, get another team member's sign-off on the pull request, create a deploy job, and run it to publish the new semantic model and its documentation. That level of friction is appropriate for a layer that will feed dashboards, scheduled reporting, and downstream applications. A metric definition is not a sketch on a whiteboard, it is part of the production contract.
Migrate like a practitioner, not like a demo
dbt recommends a phased migration pattern, start with a narrow, high-value data product, create a parallel version, then switch external tools to the Semantic Layer artifacts once they have been audited. A phased rollout lowers risk because you are comparing one governed path against another before anyone depends on the new result.
A customer-facing retention metric is a good example. If the current dashboard is stable but cluttered, duplicate just that one metric path, compare outputs, and only then cut consumers over. The point is to keep the blast radius small while you confirm the semantic model matches business expectations. That is the same reason teams often compare outputs across layers before they trust the new one in production.
For teams deciding how people will consume the new metric surface, the interface choice matters too. If you are weighing a conversational front end against classic reporting, a comparison of AI chat tools for WordPress blogs can help you judge whether that layer should sit on top of governed metrics or remain limited to lighter reporting workflows compare AI chat tools for WordPress blogs.
Keep the implementation loop tight
The implementation loop should feel familiar to any analytics engineer. Define the semantic model, test it, review it, deploy it, then verify it with real downstream queries. If the process feels slower than quick dashboard editing, that is normal. A semantic layer carries more responsibility than a single chart, so the checks have to catch naming mistakes, measure logic gaps, and mismatches between intent and output before they spread.
That same discipline applies to freshness and source reliability. A model can be perfectly defined and still sit on top of stale or broken inputs, so source checks need to be part of the rollout plan. For teams tightening that part of the stack, this guide to dbt source freshness is a useful companion when you want freshness checks feeding into the same trust model.
Making Metrics Trustworthy with Observability and Validation
A defined metric can still be wrong in production
Defining a metric once doesn't stop the data feeding it from drifting. Tables arrive late, schemas change, a column flips type, or a source starts violating a rule that used to hold. When that happens, the semantic layer can still generate correct SQL against incorrect inputs, which means the output number is neatly computed and still misleading.
That's where observability and validation become the trust layer around the semantic layer. Anomaly detection flags unexpected changes in underlying tables. Timeliness monitoring checks whether data arrived when it was supposed to. Schema tracking catches added or removed columns and type changes before they break compilation. Record-level validation checks the business rules and audit requirements that make a metric defensible in front of a stakeholder.
Why the runtime matters as much as the definition
If the semantic layer is the contract for metric logic, observability is the alarm system for the inputs to that contract. Without it, teams find out about problems only when a dashboard looks off or a finance analyst sends a screenshot. With it, teams can see trends, patterns, and statistical signals before the issue becomes a dispute.
That's also where an in-database execution model matters. digna, for example, keeps analysis inside the customer environment, which means data stays in the warehouse or private environment while the platform surfaces trends, timeliness, and schema changes through a unified interface. That architecture is useful because it gives engineering and business users the same operational picture without pushing production data out of the customer-controlled boundary.
Practical rule: Trust comes from two layers, the metric definition and the monitoring around the data that feeds it.
What good validation closes
Validation closes the gap between “the metric compiled” and “the metric can be trusted.” It catches silent shifts before they become a rewrite of the definition or a debate about ownership. If a pipeline starts delivering late records, or a source table changes shape, the number in the dashboard should fail loudly enough for the team to respond.
For teams building on top of the dbt semantic layer, this is the operational discipline. The semantic model gives you one definition. Observability and validation tell you whether the inputs still deserve to be measured that way. For a deeper look at that operating model, see digna's data observability approach.
The Hidden Costs and Adoption Reality Nobody Mentions
The strongest public material on semantic layers usually highlights consistency and self-service. The part it doesn't emphasize enough is the work required to get a mature organization there. If you already have many dashboards, ad hoc queries, and informal metric definitions, the migration isn't just a modeling exercise. It's a coordination problem.
What teams usually underestimate
The first hidden cost is engineering time. A mature metric layer already exists somewhere, even if it's spread across BI formulas and analyst notebooks. Moving that logic into dbt means re-expressing old behavior, comparing outputs, and deciding which version is authoritative. That's not a theoretical cleanup task, it's real production work.
The second hidden cost is governance overhead. If you run the old and new metric paths side by side, someone has to audit differences, manage stakeholder expectations, and handle the rollback plan if a downstream consumer breaks. The third cost is social. Analysts who are used to editing calculations directly in BI tools may see the semantic layer as an extra abstraction before they feel the benefits.
When the abstraction adds complexity first
A semantic layer can feel heavier, not lighter, when your organization hasn't standardized dimensions or model boundaries yet. In that environment, centralization doesn't remove confusion, it exposes it. That's not a flaw in the concept. It just means the layer is forcing you to name the inconsistency you already had.
A contrarian read is useful here. The semantic layer reduces metric drift only after a team has already done the modeling discipline required to support it. If the stack is full of ad hoc measures, inconsistent date logic, and one-off dashboard formulas, the first weeks can be more complex than the old status quo.
The right question isn't whether centralized metric logic is good. It is. The right question is how much cleanup your organization needs before that centralization pays back in trust, reuse, and lower reconciliation overhead.
A Practical First 30 Days with the dbt Semantic Layer

Week one through week four
Week 1, audit the current metrics. Inventory the existing definitions, find duplicates, and mark where the same business term has conflicting logic. Pick one high-value pilot that matters to more than one consumer, but isn't so broad that a mismatch will stall the rollout.
Week 2, define the core semantic models. Start small, with two or three high-priority business entities, and write the entities, dimensions, and measures in YAML. Keep the model boundary clean so the first version is understandable to the people who'll have to maintain it.
Week 3, validate with stakeholders. Compare the new outputs with the current dashboard or API response and get business users to confirm the numbers. Don't treat sign-off as a formality, because this is the moment hidden definition differences usually surface.
Week 4, deploy and monitor. Turn on the semantic layer for one BI consumer and one API consumer, then watch query behavior and usage. Add monitoring so each new metric is checked for anomalies, timeliness, schema changes, and rule violations from day one.
The mistakes that slow teams down
The first mistake is over-modeling the pilot. Teams often try to replace the entire BI layer in one pass, which makes debugging impossible. The second mistake is skipping peer review, which turns the metric layer into another place where one person's assumptions become production truth. The third mistake is forgetting to monitor the data feeding the metric, which means the number can look stable even after the source has gone wrong.
Keep the first rollout narrow enough that you can explain every field, every join, and every consumer who relies on it.
A good first month isn't about perfect coverage. It's about proving that one governed metric can move from definition to dashboard without drifting on the way. If you can do that with a small, real use case, you've earned the right to expand the layer carefully.
If you're ready to harden your metric definitions and make them trustworthy in production, start by mapping one business-critical metric from source table to dashboard, then add observability around it before you scale. For teams that want to pair governed metrics with rigorous anomaly detection, schema tracking, timeliness checks, and record-level validation, digna is a practical place to begin.
For the record-level rule checks that keep a governed metric defensible once production data starts drifting, see how digna Data Validation enforces business rules on the tables feeding it.
Frequently asked questions
Why do different dashboards show different revenue numbers?
Different dashboards usually disagree because each tool reimplements the same business rule in its own way. In the article's example, one report excludes refunds, another counts them later, and a third slices by a different date field, so three definitions drift apart even though nobody is technically wrong.
What are the main components of a dbt semantic model?
A dbt semantic model has three named components: entities, dimensions and measures. Entities define relationships and grain, dimensions are the fields used to slice, group and filter results, and measures are the quantitative values meant to be aggregated. Separating them forces teams to treat identity, description and calculation as distinct problems.
What does MetricFlow do in the dbt Semantic Layer?
MetricFlow is the query-construction engine that turns a governed metric request into warehouse SQL. Given a request such as monthly_active_customers, it looks up the semantic model, resolves the join path, applies the right time grain and generates the query, so Tableau, an API or an embedded dashboard never needs the model's internals.
How does a semantic layer improve LLM accuracy on business questions?
In a dbt experiment, GPT-4 answering natural-language questions directly over SQL databases reached only 16.7% accuracy, while the semantic-layer approach hit 83% on a subset of eight addressable questions. Governed metrics give the model a constrained path to the answer instead of forcing it to guess the meaning of every column.
How should a team roll out the dbt Semantic Layer in the first 30 days?
Spread the rollout over four weeks. Week 1 audits existing metrics and picks one pilot, week 2 defines two or three core entities in YAML, week 3 validates outputs with stakeholders, and week 4 deploys to one BI consumer and one API consumer with monitoring for anomalies, timeliness and schema changes.


