Data Warehouse Monitoring: A Complete Guide for 2026
|
0
min read

Monday morning hits hard when the executive dashboard opens on stale numbers, a delayed revenue table, and a Slack thread asking why the KPI total doesn't match finance. That's the operational reality behind data warehouse monitoring, the work that keeps teams from discovering problems only after business users have already made decisions on bad data.
The gap between expectation and reality is still wide. A 2023 joint research summary reported that only 7% of data teams resolve issues before users feel the impact, 39% spend between 20% and 40% of their time fixing pipelines, 51% need a few hours to resolve a single incident, and 36% need a few days or more source study on data observability operations. Those numbers explain why monitoring is no longer a nice layer on top of the warehouse, it's part of keeping the business running.

The shift is visible across the market too. A 2026 industry survey found that only 22% of organizations see data observability as critical, another 32% call it very important, and just over one-third report actual adoption industry survey on observability maturity. That gap tells the story, because most enterprises still need stronger visibility into freshness, quality, and failure patterns before analytics and AI can be trusted.
Table of Contents
Why Data Warehouse Monitoring Matters Now
A warehouse can look healthy from the outside and still fail in ways that affect the business. Finance sees a clean dashboard, sales sees a normal trendline, then someone notices that yesterday's refresh never landed or a schema change broke a downstream model. By the time those issues surface, teams are already spending their morning reconciling systems instead of using the data.
The cost of waiting for users to notice
The worst warehouse incidents usually do not fail loudly. A table can refresh late, a column can change type, or a pipeline can partially succeed and still leave business users looking at stale output. Monitoring matters because it catches those conditions before they turn into trust problems across the organization.
Older operating models depended on manual checks and tribal knowledge. That approach breaks down once dozens of domains, stakeholders, and pipelines depend on the same warehouse.
Practical rule: if a person has to open a dashboard to see whether the warehouse is healthy, the warehouse is already too hard to manage.
Why observability has become operational discipline
The 2023 research summary makes the trade-off clear. Teams are still reacting after impact rather than preventing it. When engineers spend a large share of their time repairing pipelines and still need hours or days to resolve incidents, the problem is no longer a one-off bug. It is the operating pattern.
That is why mature monitoring programs focus on early detection, clear ownership, and fast routing. They do not just ask whether a job ran. They ask whether the right data arrived on time, whether the structure changed, whether quality degraded, and whether business KPIs still make sense.
For teams trying to tighten that loop, a practical starting point is digna's data warehouse best practices. It helps separate “we have alerts” from “we know what to do when the warehouse drifts.”
A useful monitoring program also has to fit real operational trade-offs. Too many alerts and teams ignore them. Too few checks and the first sign of trouble comes from a frustrated analyst or a bad decision already in motion. The right balance combines traditional validation with anomaly detection, including in-database approaches that keep checks close to the data and reduce the lag between failure and detection.
The payoff is trust. Once the warehouse is monitored with intent, data engineers spend less time firefighting surprises, analysts spend less time validating extracts by hand, and executives stop asking which version of the number is correct. That is what makes the warehouse usable at enterprise scale.
Core Components of Data Warehouse Monitoring
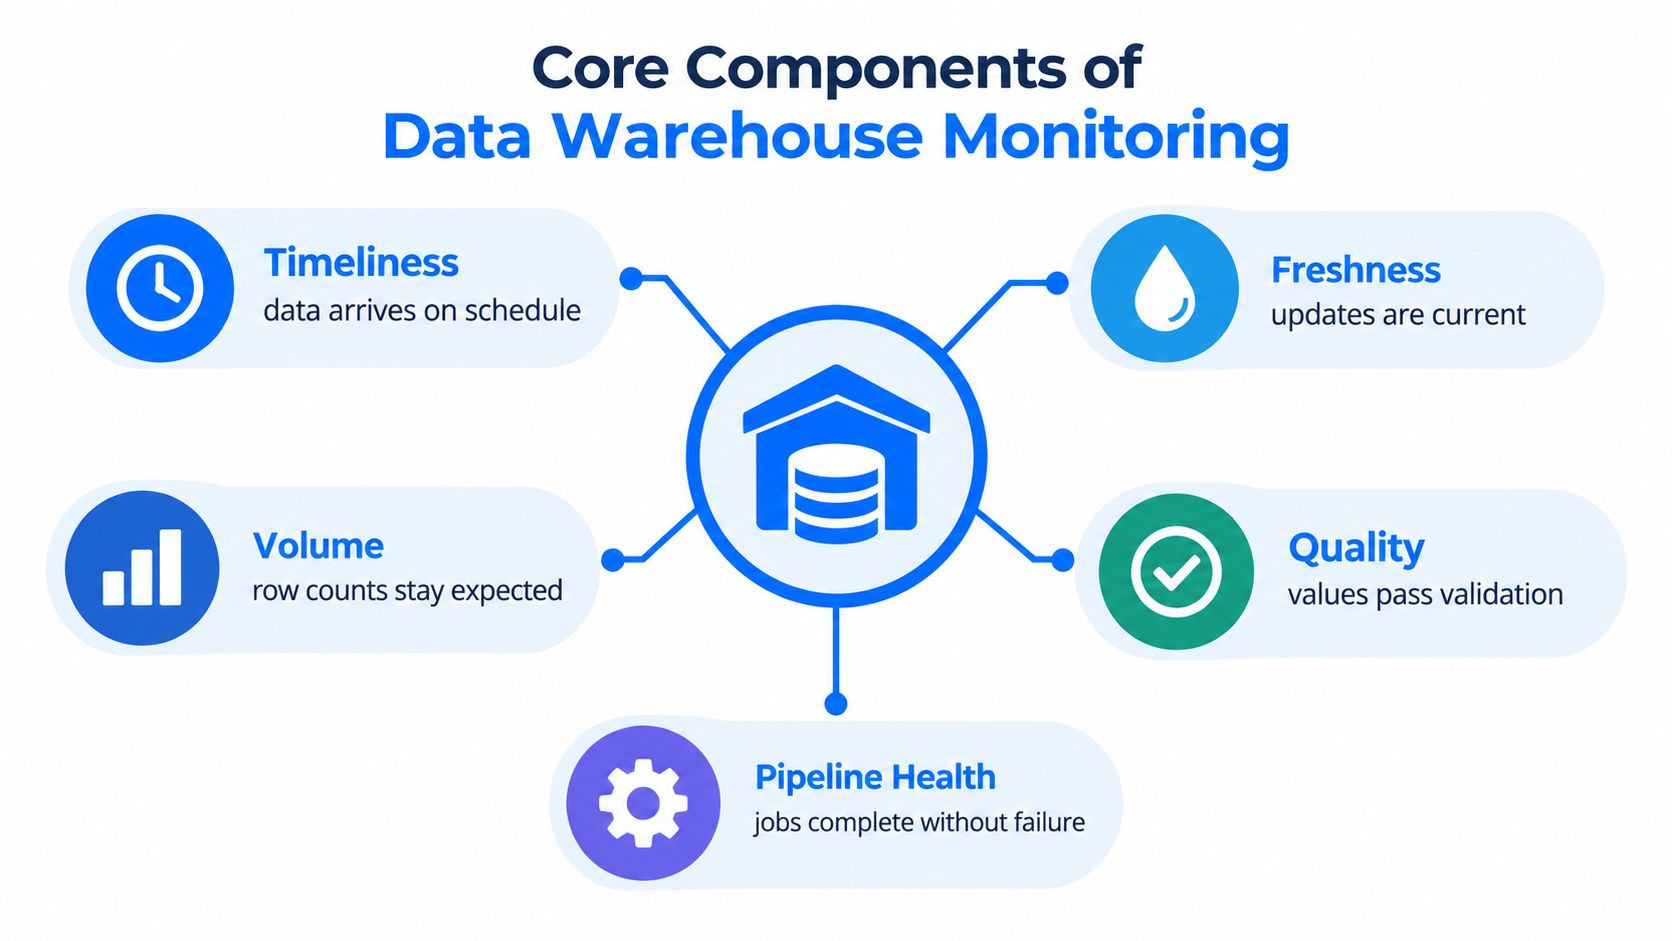
Monitoring only works when it covers the right layers of risk. A warehouse can load on time and still contain bad records. It can also look fresh while a field change quietly breaks downstream models. Strong monitoring connects those failure modes instead of treating them as separate tools.
Timeliness and freshness are related, but not the same
Timeliness monitoring checks whether updates arrive when expected. The practical test is simple, compare actual update timing with a schedule or SLA, then alert when the gap grows too large. A common example is an hourly table that triggers when its update gap exceeds about 2 hours timeliness monitoring guidance.
Freshness is the age of the latest record. Timeliness asks whether the load happened on time. Freshness asks how current the data is right now. Teams often blur the two, and that creates false confidence. A job can run on schedule and still load old records. A delayed job can still produce current data once it lands.
Schema and quality monitoring catch quieter failures
Schema drift is one of the easiest ways to break downstream consumers without an obvious incident. Structural changes like column additions, removals, type changes, renamed fields, and constraint changes can break dashboards, marts, and models without warning if they are not captured and communicated. For teams that need a practical reference point, digna's data warehouse best practices is a useful starting place for thinking about change control around warehouse structure. The goal is not just to detect the change, but to make sure downstream owners know what changed before they ship broken assumptions.
Quality monitoring lives at the record level. It should validate data against business rules and include checks for completeness, accuracy, consistency, and timeliness data quality incident guidance. Neutral guidance also recommends measurable thresholds like null values below 0.1% and duplicate customer IDs equal to 0 per month so quality does not stay subjective.
When monitoring is vague, teams argue about severity. When it is measurable, they can act.
Performance and pipeline health keep the system usable
Performance monitoring is the part many teams postpone until users complain. It watches resource consumption, query latency, and throughput so the warehouse does not become slow enough to be functionally broken. That matters because a warehouse that technically works but answers too slowly still fails the business.
Pipeline health connects all the other signals. If jobs fail, retry endlessly, or start taking longer in ways nobody notices, every other layer gets noisier. Teams that monitor pipeline health alongside data quality and freshness get earlier warning and less blame-shifting between platform and analytics groups.
For teams that need a practical operating model rather than a theory, digna's data warehouse integration approach shows how monitoring can sit close to the warehouse instead of being bolted on as a separate system.
Traditional Rules Versus AI-Driven Observability
Static rules still matter, but they're not enough on their own. Hard-coded thresholds are good at catching known failure modes, especially when the business rule is clear and the tolerance is fixed. They struggle when data changes shape, patterns drift, or anomalies show up in ways nobody anticipated.
What static rules do well and where they break
Rule-based monitoring is straightforward. If a job runs late, if nulls exceed a threshold, if a critical column disappears, the alert fires. That makes it easy to explain, easy to audit, and useful for compliance-driven checks.
The downside is maintenance. Every new dataset, edge case, or business rule adds another threshold to tune. In large estates, alert volume becomes a problem of its own, because people stop trusting notifications once too many of them are routine or low value.
How AI-driven observability changes the workload
AI-driven observability takes a different path. Instead of asking engineers to define every threshold up front, it learns baseline behavior for each dataset and flags deviations from that expected pattern. That makes it useful for drift, subtle anomalies, and conditions that don't fit a neat rule.
The trade-off is maturity. AI-driven methods need enough history to learn from, and they still need tuning when usage patterns shift. They're strongest when they're paired with targeted rules for known business logic, while the AI layer handles broad anomaly detection and prioritization.
A useful way to think about it is this.
Area | Static rules | AI-driven observability |
|---|---|---|
Detection | Known failure modes | Unexpected drift and anomalies |
Noise | Can be precise, but gets noisy at scale | Can reduce manual threshold sprawl, but still needs tuning |
Maintenance | Ongoing rule upkeep | Baseline management and model tuning |
For broader operational context, IT performance monitoring trends offers a useful parallel in how monitoring teams reduce noise while keeping attention on meaningful signals.
The best production setups usually blend both. Use deterministic rules for the controls that must never be ambiguous, then layer AI-driven detection on top where the warehouse behaves more like a living system than a fixed checklist. For teams evaluating methods, digna's comparison of AI-powered quality checks and traditional methods is a practical reference point.
Key Metrics Every Team Should Monitor
A monitoring program gets real when it tracks metrics people can act on. The point is not to measure everything. The point is to measure the things that tell you whether the warehouse is feeding the business correctly.
Start with timeliness, quality, and performance
Timeliness metrics compare actual update timing against the expected schedule or SLA. If a batch job should run daily, you need a clear threshold for what counts as late enough to alert. The exact threshold depends on the business, but the important part is that the team agrees on it in advance, not after an incident.
Quality metrics turn business rules into checks. Use them to validate completeness, accuracy, consistency, and timeliness at the row level quality monitoring guidance. When thresholds are measurable, teams can decide whether a degradation is acceptable, temporary, or a real incident that needs triage.
Performance metrics should include query response time, pipeline throughput, and resource utilization. Slow queries and overworked pipelines are often the first sign that the warehouse is under pressure, especially during heavy reporting windows or after a new model launches.
Don't stop at technical health
Business metrics matter because they reveal problems that technical checks miss. Revenue, transaction counts, customer activity, and other operational KPIs can expose a warehouse issue faster than a job status page can. If a core business metric suddenly shifts while the external business hasn't changed, the warehouse deserves scrutiny.
That's also why freshness and timeliness should be treated separately. A table might be updated on schedule and still contain stale source values, or it might contain fresh values after a delay that users can't tolerate. Both conditions are useful signals, but they point to different root causes.
Good monitoring doesn't ask only whether data exists. It asks whether the business can trust it.
For teams trying to define these signals in a more structured way, digna's data timeliness metrics guidance is a practical reference. It helps connect schedule-based expectations to the operational reality of warehouse delivery.
A clean metric set also keeps incident review honest. If the team can see the timing, the quality, and the business impact together, it becomes much easier to separate a load issue from a modeling issue or a genuine business shift.
Implementation Patterns for Enterprise Monitoring
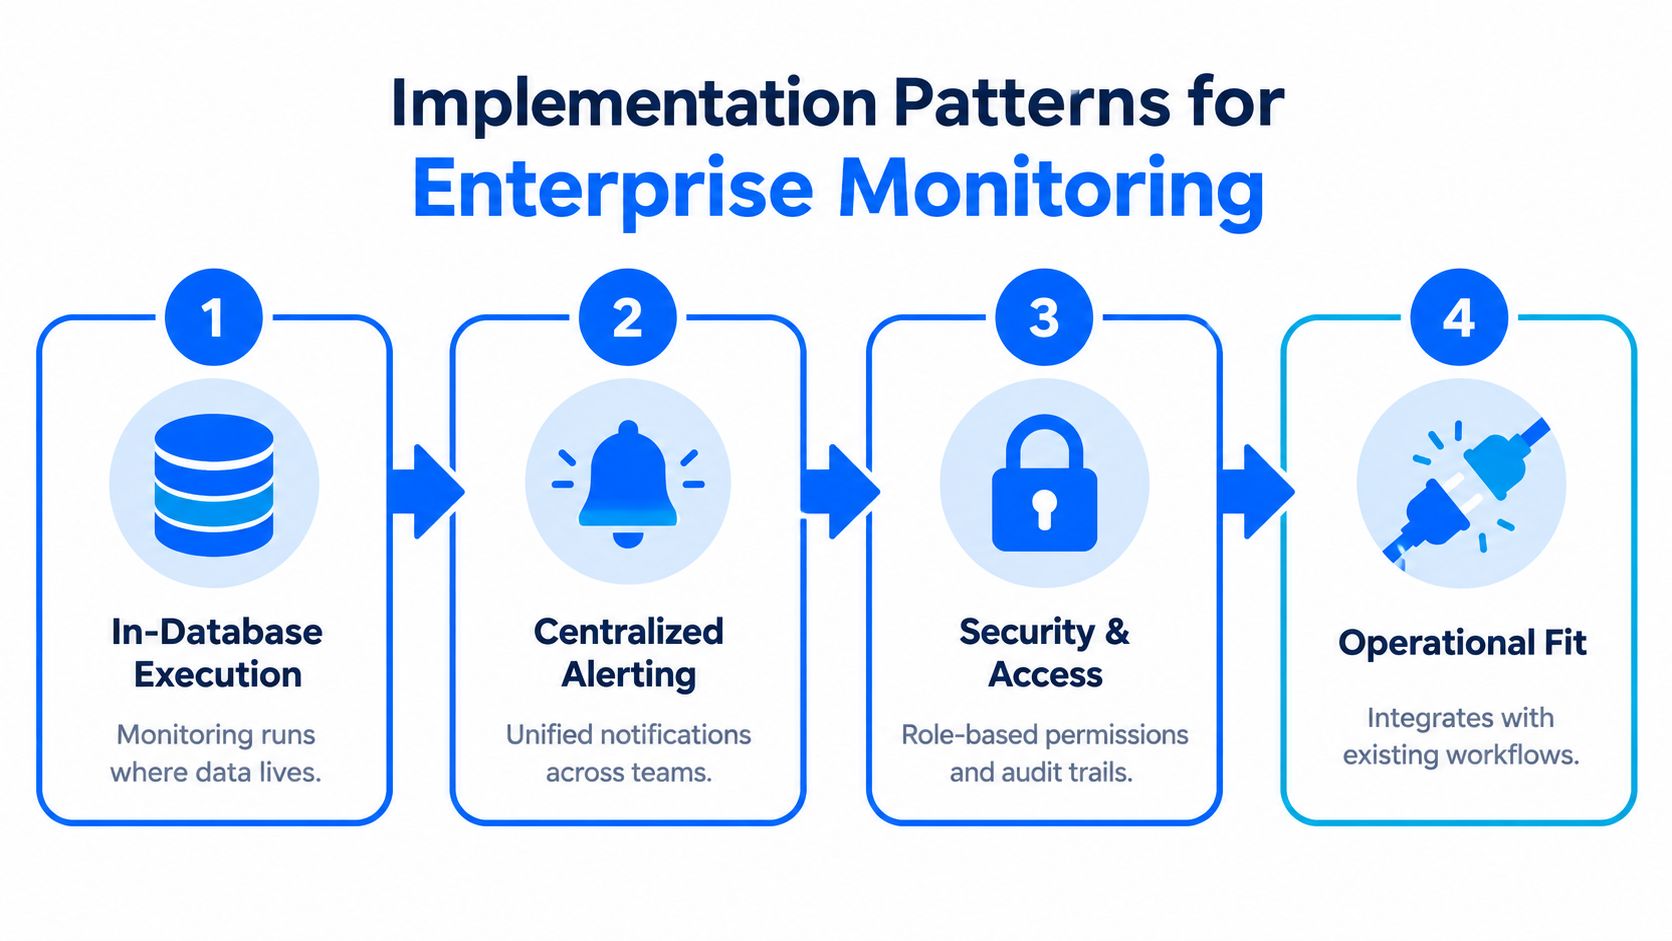
Enterprise monitoring fails when it creates more systems to manage than problems it prevents. The strongest deployment pattern keeps the checks close to the data, keeps sensitive information inside the customer environment, and keeps alerting understandable for the teams who need to act.
In-database execution is the safest operational default
Running checks inside the customer's own databases reduces data movement and fits security and governance requirements better than exporting everything to external systems. That matters in regulated environments, and it also matters in ordinary enterprises that don't want to move sensitive warehouse data around for monitoring.
Design matters more than branding here. An in-database model lets the monitoring layer inspect data where it lives, while still producing alerts, trends, and status updates that are visible to the right people. In practice, that usually means less friction with security teams and fewer surprises during reviews.
Centralized alerts need context, not just speed
Unified alerting works only if notifications are tied to the right owner and the right response path. A noisy incident stream doesn't help if the same message lands in five channels and nobody knows who owns the fix. The monitoring system has to route by dataset, domain, or failure type so the right person sees the right signal.
A pragmatic enterprise pattern looks like this.
In-database checks: keep the computations next to the warehouse to reduce movement and simplify governance.
Role-based access: limit who can see sensitive incident details.
Operational fit: plug into the orchestration and communication tools the team already uses.
Shared visibility: expose the same signal to engineers, analysts, and business users without forcing them into different versions of the truth.
For teams evaluating tools that support this model, digna's monitoring and reporting overview is relevant because it shows how alerting and reporting can sit on top of warehouse-native checks without turning into a separate data copy problem.
The goal is operational fit. If the monitoring layer interrupts every workflow, it won't survive contact with production. If it fits the way the warehouse team already works, it becomes part of the control plane instead of another dashboard nobody checks.
Building a Monitoring Culture for Long-Term Success
Monitoring tools don't create reliability by themselves. Teams do. The organizations that get this right treat observability as part of data operations, not as a one-time setup task handed to engineering after an incident.
Ownership and response need to be explicit
Each data domain needs a clear owner, and each alert type needs a known response path. If a schema change lands, the analytics engineer should know whether to update a model, notify a dashboard owner, or escalate to a platform team. If a quality rule fails, someone has to decide whether the issue is upstream data, a bad transform, or a business rule that needs revision.
Feedback loops matter just as much. Every incident should leave behind something useful, a better threshold, a cleaner rule, or a more accurate baseline. Without that loop, teams just repeat the same firefight with slightly different symptoms.
Review noise, train users, and keep the program alive
Regular review is where good monitoring programs stay healthy. Teams should revisit which alerts fired, which ones were useful, and which ones should be retired or tightened. If nobody ever revisits the signal set, alert fatigue will erode trust over time.
Training is the other half of the job. Engineers, analysts, and business users all need to understand what the alerts mean and what action they should take. A monitoring platform only works when people can interpret it without a meeting every time something changes.
A warehouse is reliable when the team can explain its failures quickly and prevent the same failure from returning.
That's also why observability has become a prerequisite for trustworthy analytics and AI. A model is only as dependable as the data feeding it, and a dashboard is only as useful as the pipeline behind it. Organizations that build a monitoring culture don't just reduce outages, they make decisions faster because fewer of those decisions need manual data checks first.
For teams ready to tighten data quality, freshness, schema tracking, and business monitoring in one operating model, digna provides an in-database observability platform that fits inside the customer's own environment. Visit it if you want a practical way to monitor warehouse behavior without exporting sensitive data out of your stack.