10 Data Warehouse Best Practices for 2026
|
5
min read

Your warehouse probably looks healthy on paper. Loads complete. Dashboards refresh. SLA checks pass. Then a finance team member spots a revenue mismatch, a clinician questions a patient cohort, or an operations lead realizes the “latest” report is based on yesterday's data. Nothing exploded. The warehouse just stopped being trustworthy.
That's why old data warehouse best practices don't hold up on their own anymore. Stability still matters, but stable pipelines can deliver bad, late, or structurally changed data without immediate detection. Silent drift, delayed arrivals, and record-level defects now create more damage than obvious job failures because they reach decision-makers before engineers notice them.
The workloads have changed too. Warehouses feed BI, ML features, operational reporting, compliance reviews, and near real-time dashboards. Guidance still points to log-based Change Data Capture as the preferred method when transaction log access is available because it offers the lowest latency with minimal source-system impact, which matters when fact tables need current process metrics and dashboards can't tolerate stale data in sectors like finance, healthcare, and telecom (data warehousing CDC guidance). But ingestion speed alone doesn't solve trust.
The modern answer is observability inside the warehouse itself. Monitor quality continuously. Detect schema drift early. Learn expected arrival patterns. Validate records against business rules. Keep sensitive data in customer-controlled environments. That's how a warehouse becomes reliable in practice, not just available in theory.
Table of Contents
3. Establish Expected Data Arrival Patterns and Timeliness Monitoring
4. Implement AI-Powered Anomaly Detection Without Manual Rules
5. Centralize Data Quality and Observability Metrics in a Single Unified Platform
6. Enable Data Observability Within Customer-Controlled Environments
7. Establish Baseline Metrics and Historical Analytics for Root Cause Analysis
8. Enforce Record-Level Data Validation Rules for Business Logic and Compliance
9. Integrate Data Observability Into Enterprise Data Ecosystems and Pipeline Workflows
10. Build Data Literacy and Operational Responsibility Across Technical and Business Teams
1. Implement Continuous Data Quality Monitoring
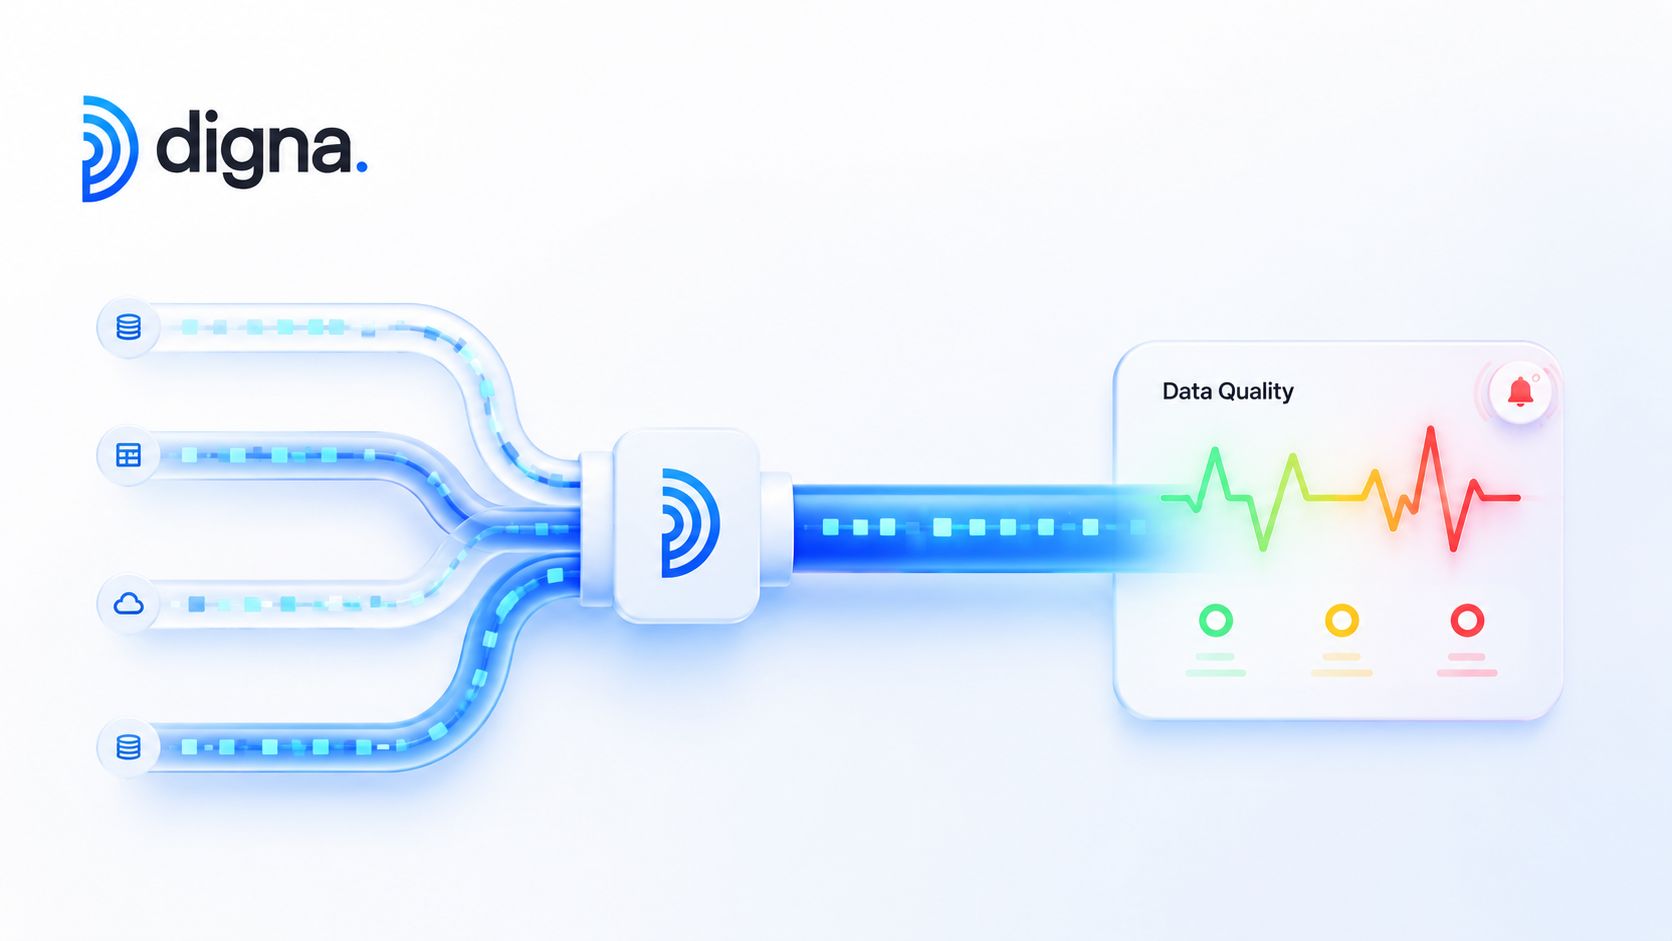
Periodic checks don't work once the warehouse feeds daily operations. If your team still profiles tables once a week or validates quality only after incidents, you're finding defects after the business already used the data. Continuous monitoring catches duplicate transactions, missing required fields, null spikes, and distribution shifts while they're still containable.
A bank closing its books each morning can't wait for an analyst to notice duplicate transaction rows in an afternoon reconciliation. A hospital can't assume patient records remain complete just because the load succeeded. An e-commerce team can't trust product or inventory feeds if category structures drift unnoticed overnight.
Monitor what breaks decisions first
Start with your highest-impact fact tables and the dimensions that drive joins, filtering, and reporting. Commonly, this means revenue, orders, claims, customer, product, and account-level entities. Watch completeness, uniqueness, validity, freshness, and distribution changes continuously, then tie each alert to an owner who can act.
The practical distinction between one-time cleanup and ongoing control matters. This distinction highlights the importance of data cleansing vs. data quality monitoring. Cleansing fixes known issues. Monitoring tells you when the same class of issue is happening again.
Practical rule: Don't start with hundreds of checks. Start with the tables executives ask about when numbers change.
A few habits make this sustainable:
Use business impact to prioritize: Revenue and compliance tables deserve coverage before low-value staging data.
Mix explicit rules with adaptive detection: Required-field checks catch hard failures. Pattern learning catches subtle drift.
Review thresholds on a schedule: Data patterns evolve with new products, markets, and reporting cycles.
Define escalation paths early: An alert with no owner becomes dashboard noise.
2. Deploy Schema Change Detection and Tracking
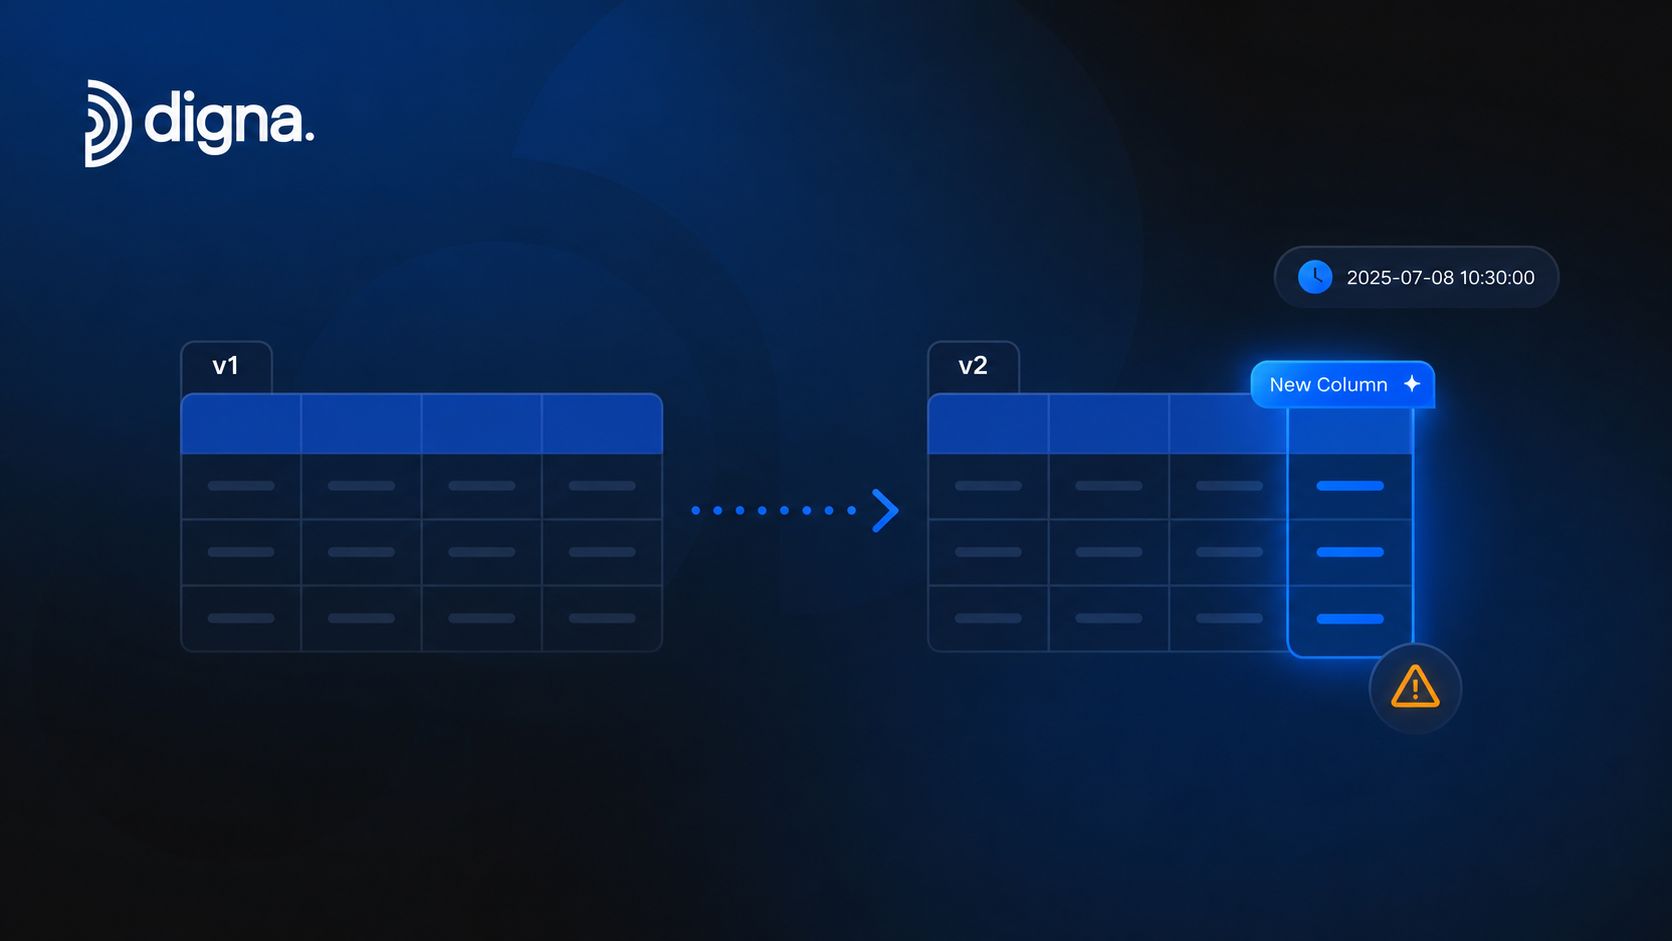
Most warehouse failures aren't dramatic. A source system adds a column, changes a data type, removes a field your dbt model expects, or shifts a constraint. The pipeline may still run, but the downstream logic starts producing partial or misleading outputs. That's schema drift, and it deserves the same operational attention as failed jobs.
This shows up constantly in SaaS integrations and third-party feeds. A vendor adds a new attribute to a usage export. A CRM API changes field nullability. A lake ingestion job lands semi-structured data with an evolved payload that your flattening model doesn't fully support. By the time someone notices, a dimensional model may already be wrong.
Treat schema drift as an operational event
Track column additions, removals, type changes, renamed fields, and constraint changes automatically. Pair that with a schema registry or version-controlled model definitions so expected changes are documented and unexpected drift is flagged immediately. That's the difference between controlled evolution and silent breakage.
A useful reference point is how structural changes break data pipelines. The core issue isn't just technical incompatibility. It's business ambiguity. When a field changes shape, analysts may still query it as if nothing happened.
Schema monitoring should sit next to quality and timeliness monitoring, not in a separate governance folder nobody opens.
What works in practice:
Separate planned from unplanned changes: Migrations should be announced, versioned, and time-bound.
Capture business impact with the change log: "Column type changed" isn't enough. Note which dashboards, marts, or models depend on it.
Alert downstream owners, not just platform engineers: BI developers and ML engineers need the same visibility.
Monitor raw and curated layers: Drift at ingestion often surfaces later in transformed models.
3. Establish Expected Data Arrival Patterns and Timeliness Monitoring
The 6:30 a.m. dashboard refresh completes on schedule, but the sales feed arrived 40 minutes late. Executives still walk into the revenue meeting with stale numbers, and the warehouse team gets blamed even though every pipeline step shows "success." That failure mode is common. Availability is not the same thing as usefulness.
Timeliness needs its own contract. A table can be complete, valid, and structurally correct, then still miss the decision window that gave it business value in the first place. I treat arrival expectations as part of observability, not as a scheduler detail buried in Airflow logs or warehouse job history.
The practical work starts with expected arrival patterns. Model them by dataset, cadence, and business deadline. A nightly finance load has a different tolerance than an operational customer status table replicated through CDC. Month-end close, market open, cutoff times for downstream APIs, and regional business calendars all change what "late" means.
Historical behavior helps, but static SLAs are usually too blunt. Stronger setups learn normal delivery windows from prior runs, then detect drift in arrival time, not just missing files. That is the same principle behind AI-based anomaly detection in data pipelines. Apply it to freshness and latency, not only row counts and value distributions.
A few implementation choices determine whether timeliness monitoring helps or just creates more alert noise:
Give new pipelines a baseline period: Observe a source long enough to learn weekday patterns, month-end variation, and known vendor delays before setting hard alerts.
Tie freshness checks to business impact: Alerting on a late reference table is different from blocking a downstream executive dashboard or regulated report.
Measure multiple timestamps: Capture source commit time, extraction time, load completion time, and model publish time so the team can isolate where latency entered.
Use in-database monitoring where possible: Freshness checks run closer to the data are easier to audit, cheaper to maintain, and easier to align with warehouse-level lineage and privacy controls.
Automate downstream response paths: Some late arrivals should trigger a warning. Others should pause dependent models, hold BI refreshes, or mark data as stale for consumers.
Privacy and deployment constraints matter here too. In regulated environments, teams often need observability logic to run inside the customer's environment rather than exporting operational metadata to another SaaS tool. That changes product selection and implementation design, especially if freshness metrics can expose sensitive operational activity.
Done well, timeliness monitoring answers three operational questions fast: what is late, how late is it relative to expectation, and who should act before stale data reaches a business process. That is a much higher standard than checking whether the job turned green.
4. Implement AI-Powered Anomaly Detection Without Manual Rules

Manual rules are useful, but they don't scale well across hundreds of tables and changing business patterns. Teams hard-code a threshold, forget why they chose it, then spend months tuning alerts that are either too noisy or too weak. That's one reason anomaly detection has become central to modern data warehouse best practices.
AI-driven anomaly detection learns normal behavior from historical patterns. It can flag a distribution shift in claim amounts, an unusual change in patient admissions, or a sudden break in regional transaction volume without waiting for someone to define every possible failure mode up front. That matters when data changes are subtle enough to avoid obvious validation errors.
Static thresholds age badly
A fixed threshold can't tell the difference between a holiday spike and a structural defect unless someone manually teaches it. Adaptive models handle that better, especially when you combine machine learning with statistical baselines and reviewer feedback. The best setups don't replace rules. They reduce the surface area of manual maintenance.
If you want a practical walkthrough of this approach, how AI detects anomalies in data pipelines is a useful framing. The operational value comes from learning normal shape, seasonality, and relationships between metrics rather than watching one metric in isolation.
Use anomaly detection where the patterns are rich enough to learn:
High-volume fact data: Orders, claims, events, and usage metrics generate enough history to model normal behavior.
Multi-dimensional metrics: Geography, product line, channel, or provider-level cuts often reveal issues aggregate checks miss.
Metrics with evolving seasonality: Healthcare demand, retail promotions, and market activity don't behave like flat baselines.
The best anomaly systems don't just say something changed. They help the on-call engineer see what changed, where, and when.
5. Centralize Data Quality and Observability Metrics in a Single Unified Platform
A common failure pattern looks like this. The data engineer checks pipeline logs, the analytics engineer checks dbt test results, the BI team checks dashboard freshness, and the governance team checks a separate scorecard. Everyone is working the same incident, but each team is looking at a different system with different definitions and timestamps.
That setup slows triage and creates avoidable debate. Teams spend the first part of an incident deciding which signal is authoritative instead of isolating the fault.
A single operating surface fixes that problem if it pulls the right signals together inside the warehouse environment and presents them with consistent definitions. Freshness, volume shifts, schema drift, failed validations, lineage impact, and downstream asset status should be visible in one place. That matters even more now that observability has moved beyond manual checks. AI-based anomaly detection only helps if its output sits next to the operational context needed to act on it.
One operating surface shortens incident response
Centralization is an architecture decision, not just a tooling preference. If anomaly alerts live in one product, schema events in another, and business-facing trust indicators in a dashboard no engineer uses, root cause analysis turns into a coordination exercise. In practice, that means longer outages, more Slack threads, and more duplicate investigation.
The better pattern is to make the warehouse the center of gravity for monitoring and decision-making. Compute already lives there. The data history needed for baselines already lives there. In-database observability also keeps metric calculation close to the source, which reduces lag and avoids copying operational metadata into yet another service.
A unified platform is most useful when one issue creates several symptoms across layers. A source table changes type. A transformation starts casting nulls. An anomaly model flags a regional drop in output. A dashboard refresh completes on time but serves incorrect numbers. If those events are correlated in one place, the on-call engineer can see the sequence quickly and decide whether to roll back, patch the model, or suppress a noisy downstream alert.
Look for four practical traits:
Shared metric definitions: Freshness, completeness, and incident severity mean the same thing across engineering, analytics, and business reporting.
Cross-layer context: Warehouse objects, transformations, pipelines, and downstream assets are visible together.
Different views for different users: Engineers need queryable diagnostics and lineage. Business stakeholders need plain-language status and impact summaries.
Flexible deployment: Private cloud, on-prem, and restricted network setups are still common, especially where privacy review blocks vendor-hosted monitoring.
digna fits this pattern when teams want anomaly detection, schema tracking, timeliness monitoring, validation results, and privacy-aware deployment in one interface instead of stitching together separate tools.
6. Enable Data Observability Within Customer-Controlled Environments
A warehouse incident in a regulated company often stalls in security review before anyone investigates the data issue itself. The blocker is usually deployment design. If observability depends on shipping metadata, query logs, or sampled records into a vendor-managed service, security and legal teams will treat it as a new data-sharing flow, because that is what it is.
Customer-controlled deployment changes that review path. Monitoring runs inside the warehouse, private cloud, or on-prem environment that already carries your access controls, audit policies, and residency boundaries. It also cuts out the extra movement required to compute freshness, schema, and anomaly signals somewhere else.
Privacy architecture is part of warehouse design
This matters most where observability touches regulated or commercially sensitive data. Finance teams need strict controls around account and transaction context. Healthcare teams cannot be casual about protected data appearing in support workflows. Government and telecom environments often add residency, network segmentation, and procurement constraints that rule out vendor-hosted monitoring before feature comparison even starts.
The design question is straightforward. Where does the analysis run, and who can access the inputs and results?
In practice, I look for observability systems that inherit the same operating model as the warehouse itself: role-based access, isolated execution, clear audit trails, and deployment options that fit private cloud or on-prem estates. AI-driven anomaly detection is still useful in these environments, but only if the model can evaluate data where it already lives. Otherwise, teams trade manual rule maintenance for a different risk surface.
A short vendor review checklist helps:
Ask for architecture diagrams: Confirm whether the product processes raw tables, sampled rows, query text, or only derived metrics.
Check execution location: Verify which checks run in-database and which still depend on a vendor control plane.
Review access boundaries: Observability services need least-privilege access, service-account scoping, and auditable permissions.
Confirm operations ownership: Customer-controlled deployment still needs patching, upgrades, key management, and disaster recovery plans.
The trade-off is real. Running observability in customer-controlled environments usually means more involvement from platform and security teams during setup. It can also limit plug-and-play features that rely on vendor-side data retention. For enterprises with strict privacy and compliance requirements, that is usually the right trade.
digna's in-database execution model is relevant here because analyses run inside customer environments, including private cloud and on-prem setups, without vendor access to production datasets.
7. Establish Baseline Metrics and Historical Analytics for Root Cause Analysis
An alert without history is just a symptom. You know something changed, but not whether it's a one-off spike, a recurring weekly pattern, fallout from a recent deployment, or the start of a larger degradation trend. Historical observability data turns reactive firefighting into informed diagnosis.
The warehouse itself should keep that context. Track metric trends over time, preserve historical baselines, and annotate known system or business events. Then when null rates spike or row counts dip, engineers can line that change up against release windows, source maintenance, traffic cycles, or seasonal business behavior.
History turns alerts into explanations
This is especially useful in enterprises with long business cycles. Retail teams need to distinguish promotional effects from defects. Healthcare teams need to separate seasonal care patterns from broken feeds. Financial services teams need to understand how month-end or market-driven volume differs from an ingestion anomaly.
I've found the most useful baseline views answer three questions fast: what changed, when did it start, and what else moved at the same time. That means correlating data-quality metrics with orchestration runtimes, warehouse resource pressure, and schema events.
A strong baseline practice usually includes:
Long enough history to capture seasonality: Short windows make normal variation look suspicious.
Event annotations: Mark deployments, source migrations, policy changes, and business events.
Relative context, not just raw metrics: A null count matters more when shown against historical range.
Cross-signal correlation: Late arrivals and schema changes often explain downstream quality anomalies.
Good root cause analysis starts before the incident, when you decide what history to retain and how to label it.
8. Enforce Record-Level Data Validation Rules for Business Logic and Compliance
High-level quality scores can look fine while individual rows violate critical rules. A table may be fresh, complete, and structurally valid, yet still contain records that break core business logic. That's why record-level validation belongs in modern data warehouse best practices, especially for regulated domains.
This gap is more common than many teams admit. Best-practice roundups often say "run data quality checks," but they rarely explain how to enforce user-defined, record-level rules inside the warehouse for audit readiness and compliance scenarios such as GDPR or HIPAA. The implementation detail is usually missing, even though enterprises in healthcare and finance need those controls mapped directly to warehouse schemas (data warehouse best practices discussion on the record-level validation gap).
Aggregate health scores aren't enough
Think in terms of explicit row-wise rules. Loan payments shouldn't exceed approved amounts. Claim records shouldn't fall outside policy coverage periods. A patient medication workflow may require documented allergy information before a specific downstream action is considered valid. These checks are business controls, not just technical tests.
That's where validity checker tools for modern data quality become useful. They support enforcement of rules that business owners can understand and auditors can review.
What works best operationally:
Start with damaging failures: Focus on rules that would cause financial, clinical, or compliance risk first.
Assign domain ownership: Finance should own finance rules. Claims should own claims rules.
Use report-only mode before hard enforcement: Validate the rule quality before you block data.
Document rationale and exception handling: Auditors care about why the rule exists and who can override it.
9. Integrate Data Observability Into Enterprise Data Ecosystems and Pipeline Workflows
At 6:45 a.m., the warehouse load finishes on schedule, dashboards refresh, and nobody sees the problem. An upstream source changed a field type overnight. The pipeline kept running. Finance is now reading a KPI built on unnoticed truncated values. That failure mode is common in enterprise stacks because observability is still treated as a separate screen, not part of execution control.
The fix is to wire observability into the systems that already decide what runs, what waits, and what gets blocked. Airflow, dbt, ingestion services, catalogs, CI checks, ticketing, and warehouse-native procedures should all receive the same trust signals. If freshness drops below tolerance, dependent jobs should pause. If schema drift breaks a model contract, the run should fail with context. If AI-based anomaly detection flags a suspicious volume shift, the load can move to quarantine for review instead of contaminating downstream tables.
This matters more in modern ELT environments because the warehouse is no longer just storage. It is also where transformations, quality checks, lineage, and access controls increasingly live. For many teams, the fastest path is in-database observability inside the customer-controlled environment, then pushing the outcome to orchestration and incident workflows. That reduces blind spots, keeps sensitive data in place, and shortens the path from detection to response. Tools such as digna fit this model because monitoring and anomaly detection can run close to the data instead of copying telemetry into another external system.
What works in practice is operational clarity:
Separate automated actions from approvals: Retries, backfills, quarantine steps, and refresh suppression should be automatic where risk is low. Publishing exceptions to regulated or executive-facing data should require named approval.
Attach observability to data products, not just pipelines: The key question is which dashboard, model, or business process is affected when a dataset loses trust.
Standardize metadata that machines can use: Ownership, lineage, SLAs, tags for sensitive fields, and downstream dependencies should be readable by orchestration and alerting tools.
Test the control path itself: Teams often monitor data and forget to monitor whether alerts, webhooks, or incident routes are still functioning.
Log every trust-based intervention: If a job was skipped, delayed, or quarantined because of a quality event, that action should be visible later for audit and post-incident review.
The implementation work is usually less about connectors and more about policy. Teams need agreement on thresholds, severity levels, and who has authority to stop or release data. Get that right, and observability stops being an after-the-fact diagnostic layer. It becomes part of how the warehouse governs itself under real operating conditions.
10. Build Data Literacy and Operational Responsibility Across Technical and Business Teams
A reliable warehouse isn't created by the platform team alone. Engineers can monitor pipelines all day, but if analysts and business owners don't understand what a freshness warning means or how a validation breach affects their decisions, the organization still makes bad calls with bad data.
Data literacy in this context isn't a training deck about metrics definitions. It's operational awareness. Business teams should know whether a report is current, whether a source is degraded, and whether a KPI is under quality review. Technical teams should know which defects matter to which business processes.
Shared visibility changes behavior
Readable dashboards and common language matter. A trader, care operations manager, or supply chain planner doesn't need warehouse internals. They do need a clear signal that a key dataset is late, structurally changed, or under active investigation. When people can see trust signals, they stop treating every dashboard as equally reliable.
A few habits improve this quickly:
Create named owners in each domain: Give finance, clinical, and operations teams a visible quality contact.
Review incidents with mixed audiences: Engineers explain cause. Business users explain impact.
Tie health to decisions: Show which reports, models, or workflows depend on each critical dataset.
Make reporting channels easy: Business users often spot semantic issues before data teams do.
A warehouse becomes trustworthy when business teams know when not to trust it, and know who is fixing it.
10-Point Data Warehouse Best Practices Comparison
Item | 🔄 Implementation complexity | ⚡ Resource requirements | ⭐ Expected outcomes | 📊 Ideal use cases | 💡 Key advantages / tips |
|---|---|---|---|---|---|
Implement Continuous Data Quality Monitoring | Medium–High: set up monitoring infra, rules, and maintenance | Moderate–High: monitoring tools, integrations, alerting, ops | Real‑time detection of quality issues; faster remediation; stakeholder confidence | Critical pipelines (finance, healthcare, e‑commerce) | Start with high‑impact tables; use statistical baselines; assign owners |
Deploy Schema Change Detection and Tracking | Medium: metadata integration and versioning | Low–Moderate: registry, CI/CD hooks, alerts | Prevents schema drift; audit trail; faster root‑cause identification | ETL‑heavy systems, SaaS integrations, evolving data feeds | Distinguish planned vs unexpected changes; maintain schema registry |
Establish Expected Data Arrival Patterns & Timeliness Monitoring | Medium: learn patterns, schedule comparisons | Moderate: historical logs, SLA config, alerting | Detects late/missing loads; enforces SLAs; prevents cascading failures | Batch reporting, financial reconciliation, near‑real‑time ops | Include business context; set SLAs per data source; allow learning period |
Implement AI‑Powered Anomaly Detection Without Manual Rules | High: model training, tuning, explainability work | High: historical data, compute, ML expertise | Detects novel multivariate anomalies; adaptive thresholds; reduced manual rules | High‑volume metrics, complex relationships, large monitoring scopes | Start with high‑impact metrics; incorporate domain feedback; track feature contributions |
Centralize Data Quality & Observability Metrics in a Unified Platform | Medium–High: migration, integrations, governance | High: platform cost, integration effort, training | Consistent authoritative view; reduced tool sprawl; holistic RCA | Large enterprises with many tools and stakeholders | Evaluate open APIs; plan phased migration; prioritize UX for non‑technical users |
Enable Data Observability Within Customer‑Controlled Environments | Medium: in‑environment deployment and ops | Moderate: on‑prem/private cloud resources, maintenance | Maintains data residency/compliance; no data movement; lower latency | Regulated industries (finance, healthcare, government) | Verify no external data export; plan patches and DR; confirm DB support |
Establish Baseline Metrics & Historical Analytics for RCA | Medium: long‑term collection and analytics | Moderate: storage, indexing, analytics tooling | Faster root‑cause analysis; seasonal pattern detection; context for alerts | Teams needing trend analysis and capacity planning | Retain 6–12+ months of history; annotate events; use statistical methods |
Enforce Record‑Level Data Validation Rules for Business Logic & Compliance | Medium: rule definition, governance, and testing | Moderate: rule engine, stewardship, testing environments | Ensures business rule compliance; audit trails; prevents invalid data flow | Regulatory domains and transactional systems (finance, insurance, healthcare) | Start with critical rules; use report‑only mode first; organize by steward |
Integrate Data Observability Into Enterprise Ecosystems & Pipeline Workflows | High: cross‑team coordination and deep integrations | High: integration dev, APIs, ownership, testing | Automated remediation and quarantine; reduced MTTR; correlated lineage | Complex pipelines, data mesh, orchestrated ETL/ELT environments | Start with critical path integrations; use industry standards (OpenMetadata) |
Build Data Literacy & Operational Responsibility Across Teams | Medium: change management, dashboards, training | Moderate: training programs, role‑based views, communication | Shared accountability; better trust in data; faster business impact detection | Organizations pursuing cultural change and data governance | Create data champions; tie quality to business KPIs; use storytelling and feedback loops |
From Best Practices to Daily Practice
These data warehouse best practices matter because the warehouse has moved from a reporting backend to an operational system of trust. It feeds executive dashboards, reconciliation processes, ML features, compliance reviews, and customer-facing decisions. That changes the standard. "The pipeline ran" is no longer enough.
The old model was reactive. Teams waited for a failed job, a broken dashboard, or a user complaint. Then they traced the issue backward through logs, transforms, and source systems. That approach still has a place for obvious failures, but it doesn't handle silent drift, late arrivals, schema changes, or row-level defects well enough. Those problems spread before anyone sees red on an infrastructure monitor.
A better operating model is proactive and in-database. Continuous quality monitoring catches issues before downstream trust erodes. Schema tracking spots structural changes while they're still manageable. Timeliness monitoring protects decision windows, not just refresh timestamps. Record-level validation enforces business logic where compliance and auditability require it. Historical analytics gives teams the context to explain incidents instead of guessing at them.
The architectural trade-offs are real. Full coverage creates more signals, so you need ownership and prioritization. Adaptive anomaly detection reduces manual rule maintenance, but it still needs review loops and context from domain experts. Customer-controlled deployment reduces privacy risk, but it requires operational discipline around access, upgrades, and recovery. None of that is a reason to avoid observability. It's a reason to design it deliberately.
This is also where modern platform choices matter. As noted earlier, cloud-native data warehouse adoption keeps accelerating, and enterprise teams are shifting toward architectures that centralize analytics while demanding stronger security, scalability, and operational visibility. Observability has to grow with that stack. It can't remain a collection of side tools and ad hoc SQL checks.
If you're improving a warehouse this year, start with the surfaces where trust breaks first. Pick critical fact tables. Define expected arrival behavior. Track structural changes. Add record-level rules where business logic matters. Expose health signals to the people who act on them. Then connect those signals to your orchestration and governance workflows.
That's how best practices become daily practice. The warehouse stops being something teams hope is right and becomes something they can verify. For organizations that want in-database monitoring, anomaly detection, timeliness tracking, schema tracking, and record-level validation inside customer-controlled environments, digna is one relevant option to evaluate.
If you want to operationalize these practices without exporting sensitive data to an external vendor environment, explore digna, a European data quality and observability platform built for anomaly detection, record-level validation, timeliness monitoring, and schema tracking inside customer-controlled warehouse, private cloud, and on-prem setups.