Data Trust Analytics Explained for Modern Data Teams
|
8
min read

A 2024 planning-insights survey found that 67% of organizations didn't completely trust the data used for decision-making, up from 55% the year before, a 12-point decline in confidence in a single annual cycle. Precisely's analysis of the survey captures the problem clearly: analytics teams are being asked to move faster while their evidence base remains difficult to verify.
That gap is the practical territory of data trust analytics. It connects data quality, observability, anomaly detection, lineage, and business context so teams can answer a more useful question than “Did the pipeline run?” They can ask, “Is this dataset reliable enough to support a decision or an AI output right now?”
Table of Contents
Why Data Trust Is the New Bottleneck for Analytics and AI
Why code confidence isn't data confidence
What Data Trust Analytics Actually Means
Trust is a composite signal
The Five Pillars That Produce Trust Signals
Freshness shows whether the data is current
Quality tests values and business rules
Volume catches silent completeness failures
Schema protects structural compatibility
Lineage identifies who and what is affected
How Detection Layers Combine Statistics, ML, and Human Review
Where machine learning adds value
Why people remain part of the system
Metrics That Turn Trust Into Something You Can Measure
Read the metrics together
Add decision context
From Observability to Decision Readiness for AI
Build scorecards around outputs
Operating Trust Inside Enterprise Constraints
Keep the control plane proportional
Assign ownership before adding alerts
Building a Trust Operating Model That Holds Up
Turn incidents into institutional knowledge
Review trust as a cross-functional practice
Why Data Trust Is the New Bottleneck for Analytics and AI
A finance leader opens a revenue dashboard before an executive meeting. The chart shows a sharp decline in regional sales, so the team delays a hiring plan and revises its forecast. Later, an engineer discovers that an upstream change caused part of the customer data to arrive late. The dashboard wasn't displaying a malicious fabrication. It was displaying data that had become incomplete without making the failure obvious.
That scenario is common because dashboards, machine learning models, and AI copilots inherit the conditions of their source data. Missing rows can reduce a metric. A stale partition can make a trend look current when it isn't. A broken join can remove customers from a segment. A renamed column can alter a transformation. Without usable lineage, nobody can quickly establish which reports, features, or decisions are affected.
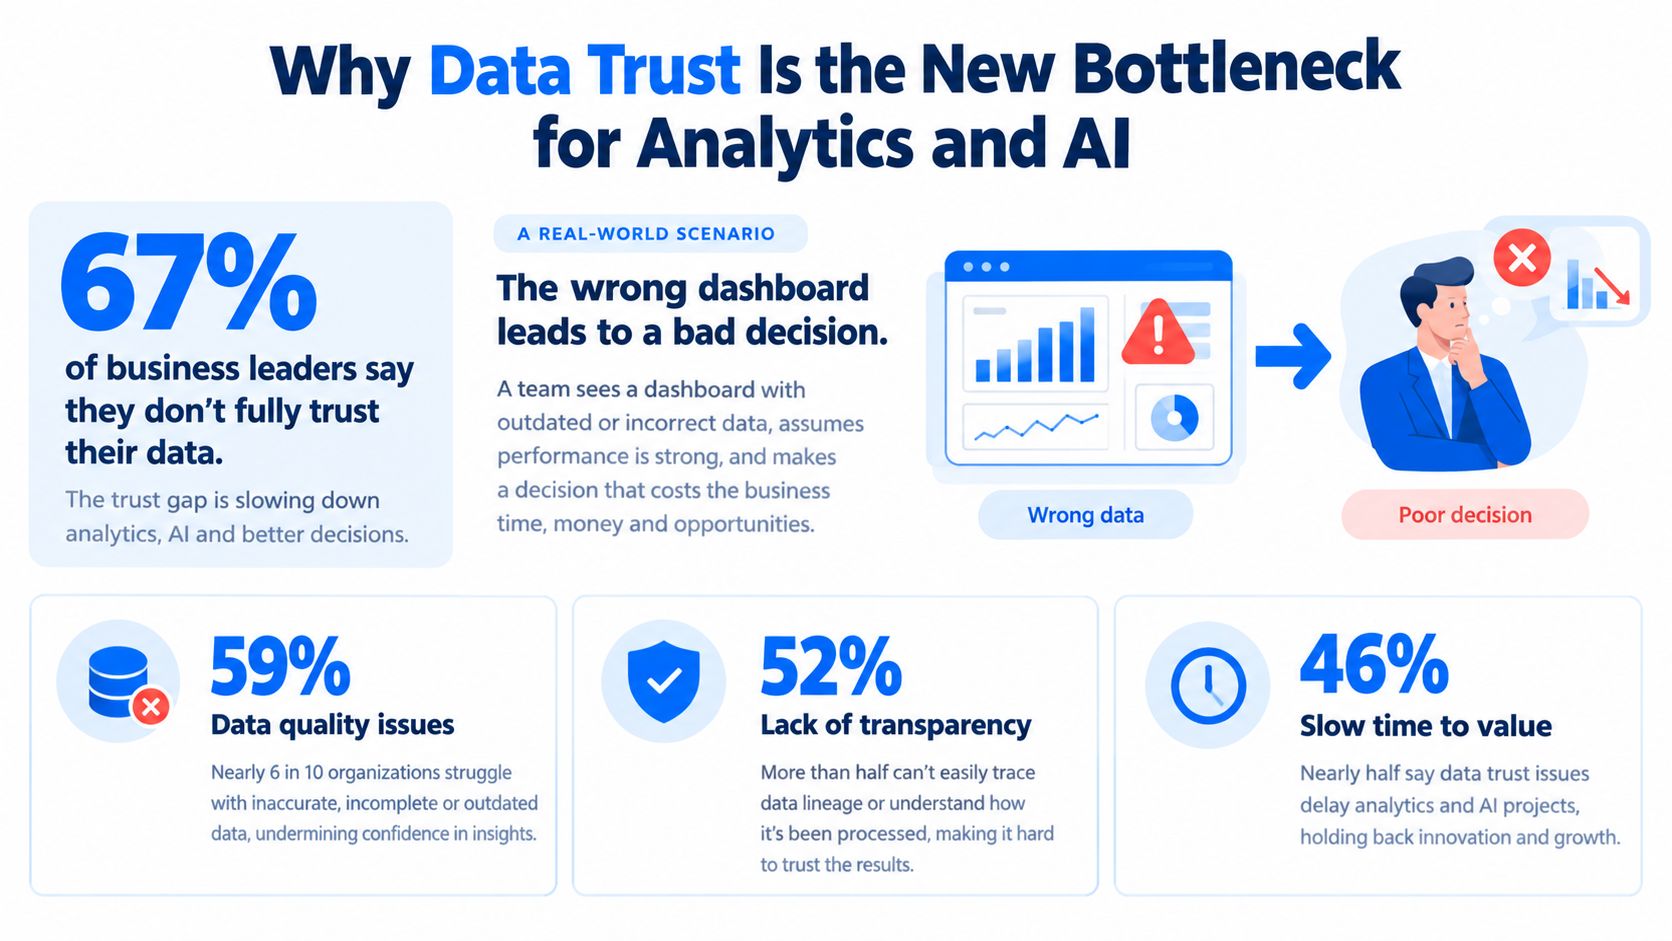
The enterprise cost extends beyond one incorrect chart. In a related industry report, 77% of IT decision-makers said they didn't completely trust their organization's data for accurate, timely, business-critical decisions, while 82% said employees had to rework completed analytics projects because of poor data quality. The same Precisely report links weak trust with operational friction, including data quality being the top barrier for 70% of respondents in organizations with low trust in decision-making data.
Why code confidence isn't data confidence
A model can pass its deployment tests and still produce unreliable recommendations if its feature tables have drifted. A SQL query can compile successfully while returning fewer rows because an upstream process stopped loading one source. Software correctness tells you that the code executed as designed. It doesn't prove that the inputs were complete, timely, stable, or suitable for the decision.
Data trust analytics supplies that missing evidence. It treats operational signals as part of analytical validity, then connects failures to affected assets and accountable owners. Teams looking at the impact of poor data quality on business decisions can use this distinction to move from correcting visible dashboard errors to preventing unreliable outputs from reaching decision-makers.
What Data Trust Analytics Actually Means
Start with the narrow definition. Data quality checks whether values and records satisfy known conditions, such as a required field being populated, a date falling within an allowed range, or a customer identifier being unique. Those checks are necessary, but they only cover what the team has thought to specify.
Data trust analytics expands the question. It combines quality evidence with freshness, volume, schema stability, lineage, ownership, and documented meaning. The consumer of the data needs to know not only whether a value looks valid, but whether the dataset is current, understood, traceable, and safe to use for a particular purpose.
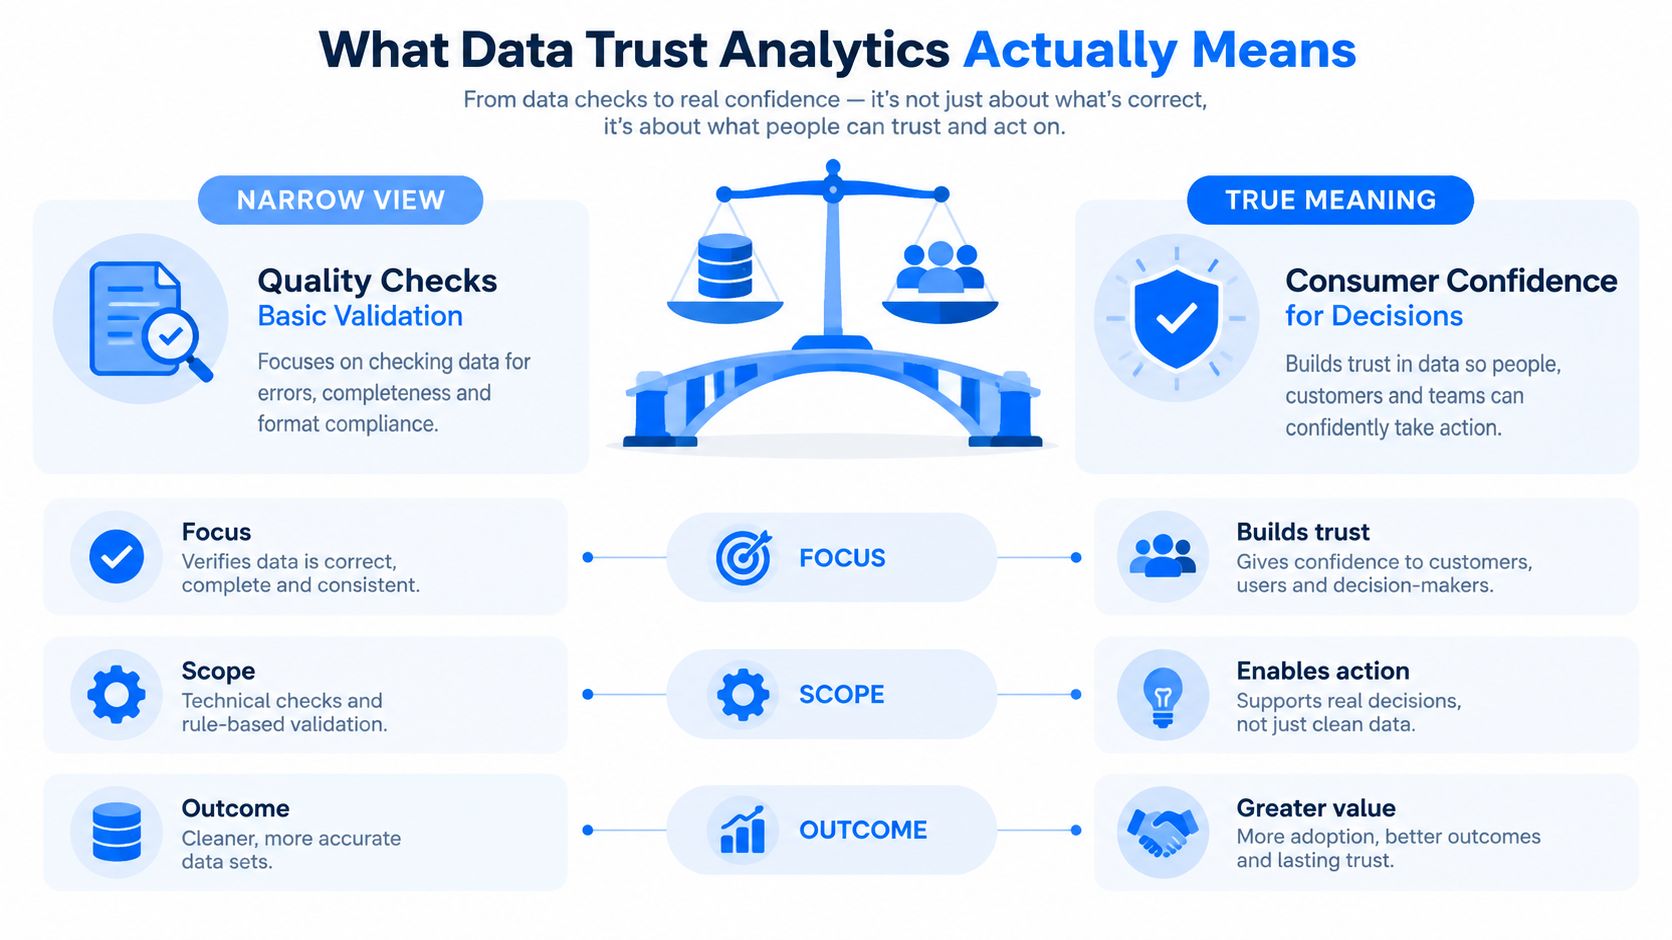
A useful distinction is:
Data quality asks: “Does this value meet the rule?”
Data trust analytics asks: “Would a decision-maker stake a recommendation on this dataset right now?”
That second question depends on context. A minor delay may be acceptable for a monthly planning report but unacceptable for an operational alert. A column can be technically valid yet semantically ambiguous. A model feature can pass null checks while losing its connection to the source system that explains its meaning.
Trust is a composite signal
Think of trust as a conclusion drawn from several evidence types:
Operational evidence: Did the data arrive when expected, and did the pipeline complete?
Statistical evidence: Do counts, distributions, averages, and missing-value patterns resemble their established behavior?
Structural evidence: Did columns, data types, and relationships remain compatible?
Contextual evidence: Is the dataset's purpose, owner, lineage, and business definition documented?
A data observability framework makes these signals visible, but visibility alone isn't the final outcome. The important step is translating observations into a confidence judgment for a specific dashboard, model, metric, or AI workflow.
The Five Pillars That Produce Trust Signals
A silent pipeline failure rarely announces itself with a red error. Suppose an upstream change-data-capture process drops rows for two days, but the job still reports success. Revenue dashboards begin to underreport, and a forecasting model receives an incomplete customer history. Each observability pillar reveals a different part of the incident.
The standard five pillars are freshness, quality, volume, schema, and lineage. They work together rather than as interchangeable labels. The dimensions of data quality provide a useful way to connect the individual checks to the broader question of whether downstream data remains fit for use.
Freshness shows whether the data is current
Freshness asks whether a dataset arrived within its expected schedule. A load that appears every morning but misses its normal delivery window should reduce confidence, even if the records already present pass validation. Timeliness monitoring can distinguish a delayed load from a missing load and can also identify an unexpected early delivery that may indicate a scheduling or partitioning problem.
Quality tests values and business rules
Quality checks inspect null rates, duplicates, invalid formats, referential relationships, and business constraints. In the dropped-row example, the remaining records might all have valid customer IDs, so record-level validation alone may miss the incident. Quality becomes more informative when it's interpreted alongside volume and historical behavior.
Volume catches silent completeness failures
Volume monitoring compares row counts or other size indicators with expected patterns. A sudden reduction can reveal a partial extract even when the pipeline emits no technical error. Volume doesn't explain the cause, but it gives the team an early signal that the dataset's completeness deserves investigation.
Schema protects structural compatibility
Schema tracking detects additions, removals, renames, and type changes. A renamed column may break a downstream transformation immediately, or it may be mapped incorrectly and produce plausible but misleading results. Structural compatibility is part of trust because consumers depend on both the values and the shape of the data.
Lineage identifies who and what is affected
Lineage connects the source table to transformations, dashboards, features, models, and business metrics. When the row drop is detected, lineage helps the team identify which revenue reports and forecasts need review. Ownership then turns that map into action by routing the incident to the people responsible for the source and affected products.
No single pillar can certify decision readiness. Trust emerges when signals are correlated, interpreted in context, and delivered to accountable owners.
How Detection Layers Combine Statistics, ML, and Human Review
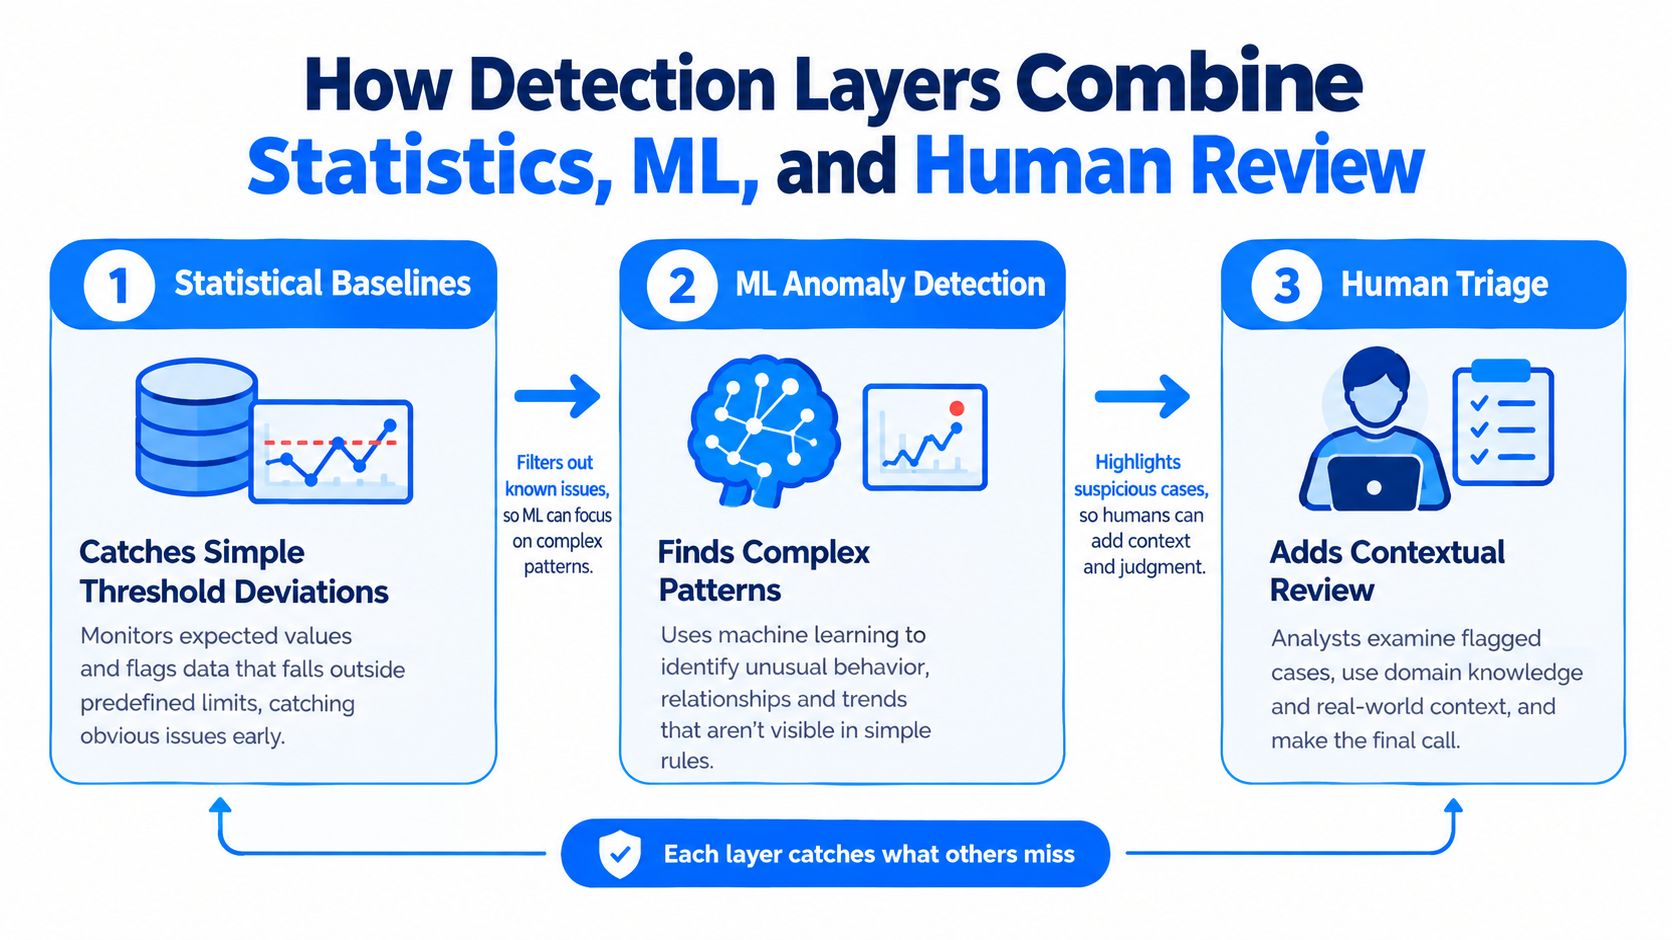
Detection works best as a layered system because each layer answers a different question. Statistical baselines catch clear failures cheaply and explainably. Machine learning identifies behavior that fixed rules may miss. Human review supplies the business context needed to decide whether an alert represents an incident, a planned change, or harmless variation.
Start with baselines for freshness, volume, null rates, averages, and other core measures. A threshold can flag a missing delivery, while a rolling statistic can show a meaningful departure from recent behavior. These controls are easy to explain during incident review, so they remain useful even after a team adds more advanced detection.
Where machine learning adds value
Static rules become less reliable when data follows seasonal, weekday, release-cycle, or customer-segment patterns. A learned distribution or seasonal model can identify an unusual pattern that remains within a broad fixed threshold, an approach grounded in statistical pattern recognition. A pipeline may pass its minimum-row-count rule while producing a distribution that differs sharply from its established profile.
For high-volume operational data, University of Amsterdam research describes a consensus-based unsupervised approach that combines multiple models, rules of thumb, iterative hyper-parameter tuning, and a domain expert in the loop. The study's method supports a practical design principle: no single detector should be responsible for every anomaly type.
Why people remain part of the system
A pipeline can pass fixed freshness and volume checks yet trigger a learned model because a key metric dips in an unfamiliar way. An analyst checks the deployment calendar and confirms that a planned promotion caused the change. Marking the event as expected prevents similar alerts from becoming recurring noise and gives the detection process better context.
A separate data-quality framework recommends profiling each arriving batch, retaining historical profiles, and feeding the resulting time series into anomaly models. The cited profiling approach treats drift as a measurable sequence rather than a one-time inspection.
Practical rule: Use rules for known failure modes, models for changing behavior, and people for business context.
Metrics That Turn Trust Into Something You Can Measure
Trust becomes manageable when teams express it through metrics they can report, alert on, and improve. A dashboard that says “data looks healthy” is difficult to defend. A scorecard that shows freshness performance, unresolved anomalies, schema recovery time, and lineage coverage gives engineers and stakeholders a shared operating language.
The metrics below are starting points, not universal targets. A critical payment dataset should have stricter expectations than an exploratory table. Define the benchmark with the owners and consumers who understand the consequences of failure.
Metric | Definition | Target Benchmark | Source Pillar |
|---|---|---|---|
Freshness SLO | Share of expected updates delivered within the agreed cadence | Set by the dataset's decision use and delivery expectation | Freshness |
Anomaly rate | Detected anomalous events relative to the monitored table population and observation period | Low enough to preserve attention, with confirmed incidents tracked separately from accepted events | Quality, volume, freshness |
Schema-change MTTR | Mean time from an unauthorized or incompatible schema change to resolution | Short enough to protect downstream publication and model use | Schema |
Lineage coverage | Share of downstream assets connected to an owned and monitored upstream source | Complete coverage for critical reports, features, and models | Lineage |
Read the metrics together
A strong freshness result doesn't compensate for poor lineage. A low anomaly rate may mean stable data, or it may mean the detector is too conservative. Schema-change MTTR can look healthy while teams remain unable to identify all affected dashboards.
For that reason, publish metric context with the number itself. Record the monitored asset set, the decision use, exclusions, accepted anomalies, and ownership status. A guide to measuring reliability can help teams turn operational observations into a reliability conversation that business stakeholders understand.
Add decision context
Each scorecard should answer three questions:
What was measured? Name the table, feature set, metric, or model input.
What changed? Show the current signal against its historical baseline and agreed expectation.
What action follows? Identify the owner, escalation path, and publication or inference decision.
That structure prevents teams from treating trust as a decorative dashboard label. It makes confidence reviewable.
From Observability to Decision Readiness for AI
Observability produces evidence, but it doesn't automatically tell a model owner whether an AI system should run today. A platform may show healthy pipeline execution while the feature data remains difficult to trace, unusually distributed, or affected by unresolved anomalies.
The gap is measurable in enterprise sentiment. 58% of organizations said they had implemented or optimized data observability programs, yet 42% still didn't trust their AI or machine learning model outputs, according to recent reporting on enterprise AI trust. Observability can therefore coexist with distrust when teams monitor infrastructure without proving that downstream inputs are decision-ready.
Build scorecards around outputs
A trust scorecard should bind evidence to a specific consumer. For example, a feature table might show acceptable freshness but only 60% lineage coverage and three unresolved anomalies. Those figures are scenario values, not general benchmarks, but they demonstrate why a generic green pipeline status can be misleading.
The model promotion process can apply explicit gates:
Freshness gate: Required inputs arrived within their expected windows.
Quality gate: Critical validation rules passed, with exceptions documented.
Schema gate: No incompatible structural changes remain unresolved.
Lineage gate: The model owner can trace critical features to monitored sources.
Incident gate: Open anomalies have an assigned owner and a documented decision.
A scorecard shouldn't hide uncertainty behind one composite number. It should show the evidence behind the decision, the risk owner's approval, and the conditions under which the output must be withheld or reviewed.
That evidence can also appear in model documentation. Executives, regulators, analysts, and engineers need more than a model metric. They need a defensible explanation of whether the data supporting the output was current, stable, validated, and traceable at the time of use.
Operating Trust Inside Enterprise Constraints
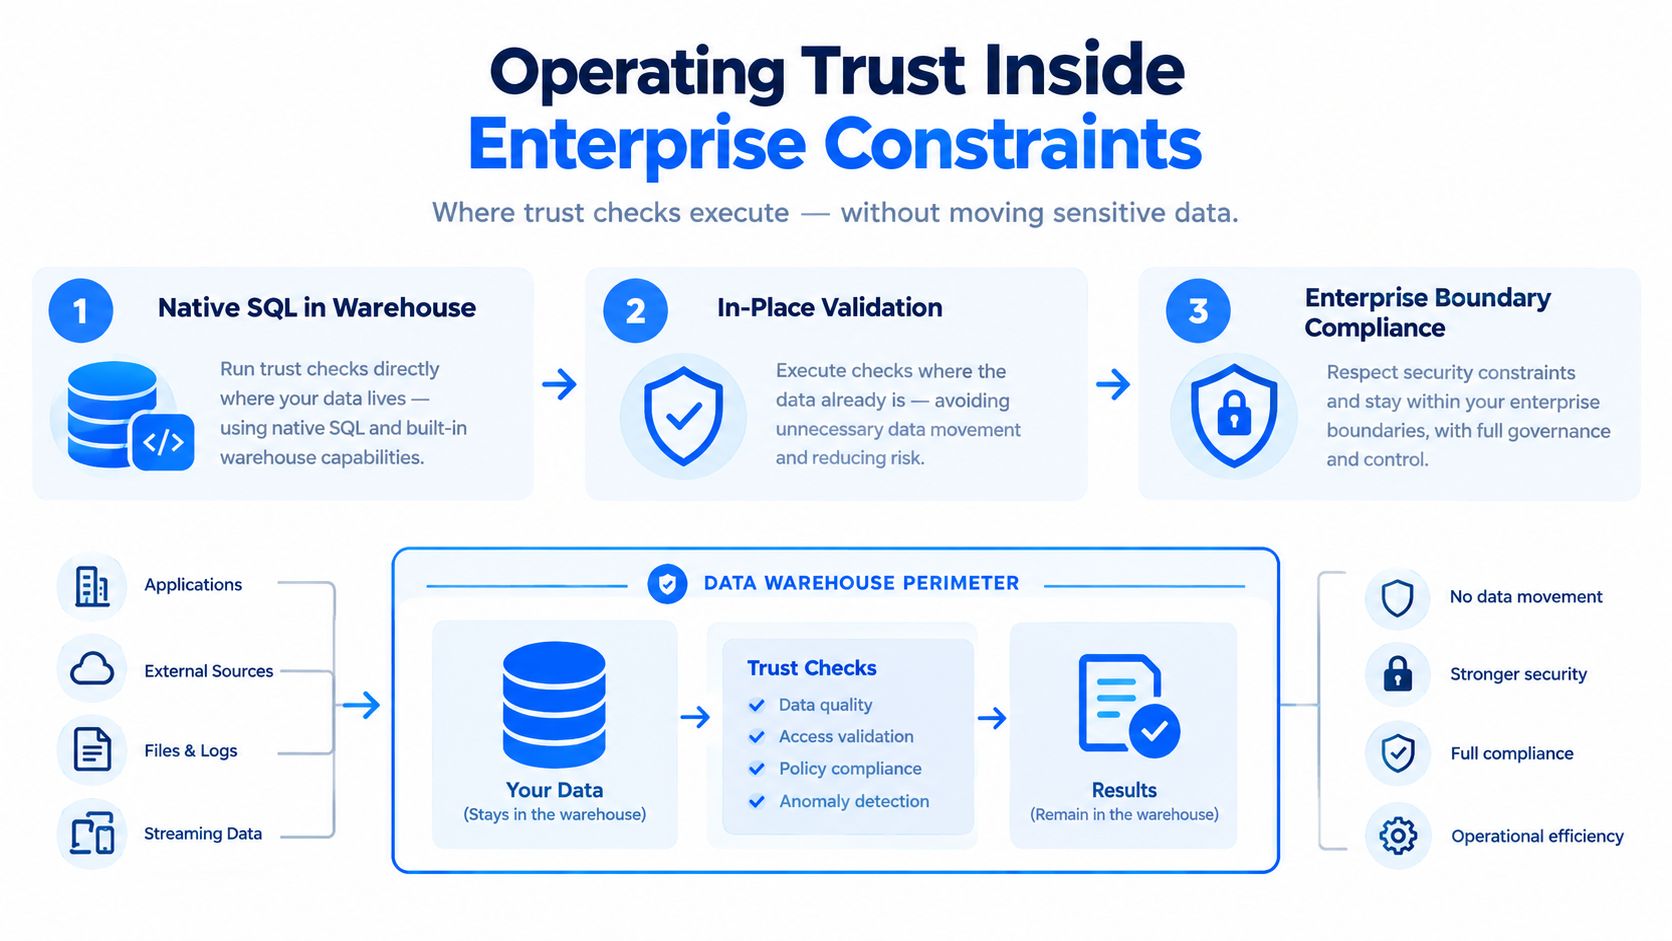
Trust controls must fit the environment where sensitive data already lives. Moving production records into a separate monitoring service can create privacy, residency, access-control, encryption, and network concerns. It can also complicate the ownership model by separating the evidence from the system that holds the data.
A practical architecture often separates execution from coordination. Native SQL or database-native checks can calculate row counts, constraints, freshness indicators, and validation results where the data resides. A centralized service can then manage policies, alerts, incident routing, and scorecards using the necessary metadata rather than copies of the underlying records.
Keep the control plane proportional
The right deployment model depends on the organization's boundaries. A private cloud or on-premises installation may suit teams that can't move production data outside their environment. digna states that its platform runs inside the customer's private cloud or on-premises infrastructure, with data-quality checks and anomaly detection logic executing inside the customer's database engine. Its documentation describes this in-place model.
The operating design should also account for adoption friction. Recent survey data found that 61% of teams still relied on manual checks or SQL-based validation, 27% used a dedicated observability platform, and only 14% enforced service-level agreements organization-wide, while 39% tracked them. The Integrate.io report shows why implementation needs to respect existing workflows rather than assume every team can replace its validation practices at once.
Assign ownership before adding alerts
The same report found that data quality ownership was shared across multiple teams for 44% of respondents, and limited visibility into pipeline health was the top challenge for 31%. Shared responsibility can work, but only when someone owns the decision to investigate, publish, suppress, or restore an output.
Prioritize controls by:
Decision impact: Monitor assets that influence financial, regulatory, clinical, operational, or customer decisions first.
Data sensitivity: Minimize retained metadata and keep access aligned with existing permissions.
Failure cost: Route high-consequence alerts through established incident channels.
Operating fit: Test checks during delayed ingestion, degraded dependencies, and schema changes.
Don't buy a platform-wide promise before proving the workflow on a critical domain. Modular adoption lets teams validate signal quality, alert ownership, and operational cost before expanding coverage.
Building a Trust Operating Model That Holds Up
A durable trust program is a closed-loop operating system, not a collection of monitoring alerts. Teams define service-level objectives for freshness, completeness, validity, schema compatibility, and lineage coverage, then connect those objectives to named owners, escalation paths, and business-impact thresholds.
The response policy matters as much as the detection. A failed check might block downstream publication or AI inference, but only when documented controls justify the interruption. In other cases, the organization may preserve the last known reliable result, label the output as stale, and give the owner a defined window to resolve the issue.
Turn incidents into institutional knowledge
For every material incident, record:
Cause: What changed in the source, transformation, schedule, schema, or access path?
Impact: Which tables, metrics, dashboards, features, models, and decisions were affected?
Response: Who investigated, what action was taken, and how quickly did service recover?
Evidence: Which validation and monitoring results confirmed that the data was safe to use again?
After recovery, feed those findings back into validation rules, baseline configuration, ownership maps, access policies, and engineering backlogs. A recurring timeliness failure may require a schedule redesign. A repeated schema issue may require compatibility contracts. Repeated ambiguity around a metric may require a stronger semantic definition.
Review trust as a cross-functional practice
Data engineering, analytics, governance, security, and business stakeholders should review the scorecards together. Each group sees a different failure mode. Engineers understand pipeline behavior, analysts understand interpretation, security understands exposure, governance understands accountability, and business owners understand decision consequences.
This discipline supports broader efforts to unlock business value with data because reliable data becomes an operational capability rather than an unexamined byproduct. The goal isn't to eliminate every anomaly. It's to create repeated evidence that the organization knows its data, knows who owns it, knows what decisions depend on it, and can recover when conditions change.
Trust is earned when the same evidence supports the same decision across ordinary days and incident days.
digna provides in-environment data quality and observability capabilities for monitoring anomalies, timeliness, validation, schema changes, and historical data behavior without moving production data out of the customer's environment. Visit digna to see how its modular approach can connect operational signals with decision readiness for analytics and AI.


