Data Reliability vs Validity: What Sets Them Apart
|
10
min read

The most popular advice on data reliability vs validity is incomplete: make the pipeline consistent, add freshness checks, and trust the dashboard when it stays green. That approach catches unstable delivery, but it can miss a more dangerous failure. A pipeline can repeat the same wrong interpretation indefinitely, giving executives a clean report and giving models a consistent training signal that no longer represents the business.
Reliability and validity are separate control layers. Reliability asks whether a measurement is consistent and available under repeatable conditions. Validity asks whether it measures the intended reality, construct, or business rule. A trustworthy data platform needs both, with observability modules assigned to the failure each one can detect.
Table of Contents
Why Stable Pipelines Can Still Produce Wrong Decisions
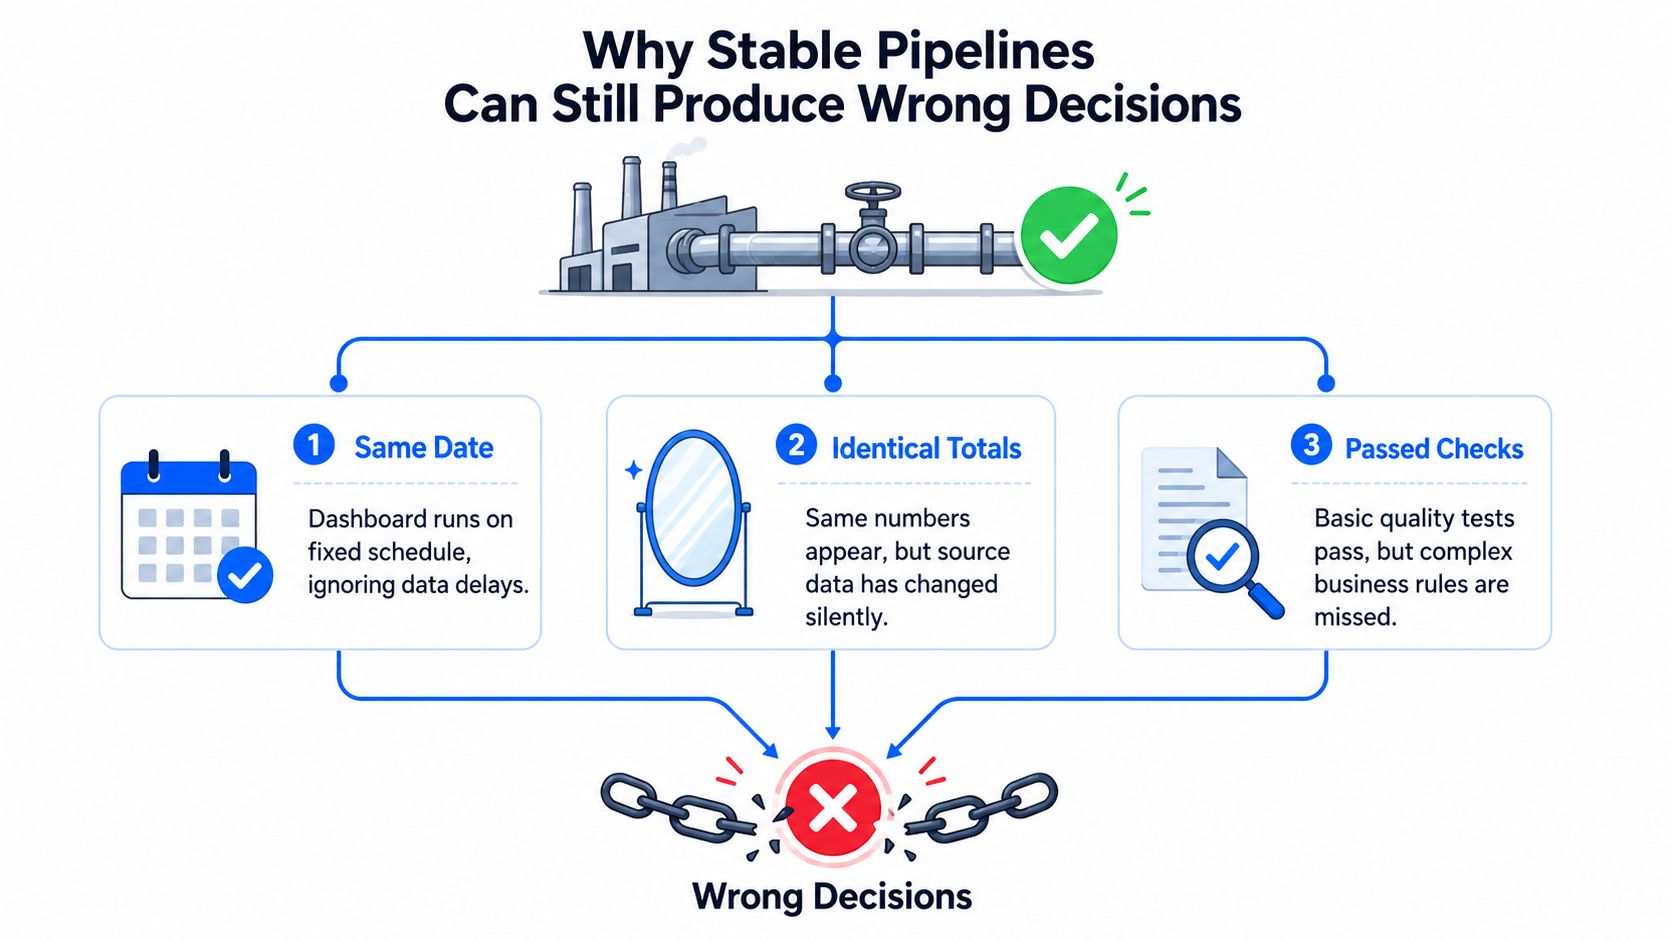
Consider a monthly revenue dashboard that shows identical totals across three consecutive runs. Every freshness check passes. No anomaly alert fires. The pipeline completes on schedule, row counts remain within their expected pattern, and the dashboard looks operationally healthy.
The problem sits in the taxonomy. A silent merge has caused two product lines to aggregate under one category. The pipeline is stable, but the business meaning has shifted. Nothing in a basic delivery monitor necessarily knows that the category definition is now wrong, especially if the resulting totals remain numerically plausible.
That distinction is central to measurement science. Reliability concerns consistency across repeated measurements, while validity concerns whether the measure captures what it intends to measure (Statistics Solutions explains the distinction between reliability and validity). A stable pipeline can therefore deliver a repeatable error. The dashboard is not lying because the computation failed. It is misleading because the computation still executes against an invalid interpretation.
Two different failure modes
Random error creates variation. A partition arrives late, a source sends fewer records, nulls spike, or an observer classifies the same record differently across runs. Reliability controls are designed to expose that instability through repeatability, freshness, anomaly, and consistency checks.
Systematic error creates a stable bias. A unit changes from dollars to cents, an exchange-rate table reverses a conversion, or a denominator excludes a meaningful population. The output may remain smooth and reproducible while failing to represent the intended construct. Validity controls, such as semantic tests and reconciliation against an authoritative reference, are needed to expose it.
Operational teams can use a practical data quality monitoring guide to organize checks around freshness, completeness, consistency, and rule enforcement. But monitoring the delivery mechanism isn't the same as proving that a metric still means what stakeholders think it means.
A useful internal reference is digna's explanation of data reliability, particularly when teams are separating dependable delivery from correctness of interpretation. The production lesson is straightforward: green pipeline status proves that the mechanism ran. It doesn't prove that the decision metric remained valid.
Defining Data Reliability and Data Validity
Data reliability is consistency under repeatable conditions. If the same source, method, and conditions produce similar results across repeated measurements, the measurement demonstrates reliability. In data platforms, that means a job delivers expected records, transformations behave consistently, observers agree on classifications, and recurring metrics don't vary without a corresponding change in the underlying process.
Reliability is closely tied to random error. Test-retest stability checks whether results persist across repeated runs. Internal consistency checks whether related items behave coherently. Split-half methods divide an instrument into parts to compare consistency, while inter-rater methods examine agreement between observers. In laboratory-style repeatability work, replicate observations are often used, with about 10 replicates serving as a practical benchmark in some settings (the methodological discussion on reliability and validity).
Validity is correctness of the measurement target. A valid field, metric, or dataset represents the reality or construct it claims to represent. The value can be perfectly formatted and repeatedly produced, yet invalid if the field has the wrong unit, the wrong population, the wrong label, or the wrong business definition. Data validity also includes conformity to predefined rules, formats, and standards (Acceldata's definition of data validity).
Four useful validity lenses
Content validity: Does the metric include the full set of business components it claims to cover? A customer-health score that excludes support incidents may be reliable, but incomplete as a measure of customer health.
Construct validity: Does the metric capture the intended concept rather than a convenient proxy? A “retention” measure based only on logins may not represent retained commercial value.
Criterion validity: Does the result agree with a known standard or trusted reference? A currency conversion should reconcile with the authoritative rate source and its defined unit.
Face validity: Does the field appear to measure what its name suggests? A column called
active_customermay pass a superficial review while its implementation counts recent sessions instead of active contracts.
A schema drift event can damage face validity when a field's structure no longer matches its documented meaning. A unit change can damage criterion validity when values no longer align with the reference standard. These failures can survive repeatability checks because the same flawed logic runs consistently.
The classic measurement example makes the relationship clear. A thermometer that produces the same reading every time in boiling water is reliable, but if it is calibrated for the wrong context, the reading is invalid. Reliability is necessary for meaningful validity evidence, but reliability alone doesn't guarantee validity. For a more detailed operational treatment, see digna's guide to data validity.
Side by Side Comparison of the Two Concepts
The definitions become useful only when they change how a team designs controls. Reliability and validity should be evaluated against the error they address, the evidence that supports the conclusion, the alert that appears in production, and the layer where the failure originates.
Criterion | Data Reliability | Data Validity |
|---|---|---|
Core question | Does the measurement remain consistent across repeated conditions? | Does the measurement represent the intended reality or construct? |
Main error addressed | Random error and unexplained variance | Systematic error, bias, and semantic misinterpretation |
Measurement evidence | Test-retest stability, repeatability, reproducibility, internal consistency, split-half checks, and inter-rater agreement | Comparison with a gold standard, criterion benchmark, known truth, business rule, or expected theoretical relationship |
Pipeline signal | Anomaly alert, freshness miss, volume change, null spike, delivery failure, or inconsistent observer result | Semantic test failure, reconciliation mismatch, unit conflict, invalid relationship, or distribution shift with business meaning |
Stack layer | Transport, ingestion, orchestration, storage, and recurring execution | Semantic model, transformation logic, metric definition, reference data, and business layer |
Typical owner | Data platform or infrastructure team | Analytics engineering, domain stewards, and data product owners |
What success means | The system behaves predictably and delivers usable data on its expected schedule | The data answers the intended question correctly |
The statistical methods aren't interchangeable. Reliability can be evaluated with repeatability, reproducibility, test-retest stability, internal consistency, or inter-rater agreement. Validity is more often judged by sensitivity and specificity where a gold standard exists, or by comparison with known truth and expected relationships (Statistics by Jim distinguishes precision and consistency from accuracy and correctness).
Production trade-offs
Controls can also interfere with one another. A transformation may become more semantically precise after additional normalization, yet introduce more branching and make repeated execution harder to reproduce. Aggressive deduplication may make record counts more stable while deleting legitimate repeated events. A reliability improvement can therefore reduce validity if it removes meaningful edge cases.
That's why teams should treat data quality dimensions as separate evidence categories, not as interchangeable labels. Observability must instrument transport behavior and business meaning independently. A pipeline health signal can confirm that data arrived. It can't, by itself, confirm that the arriving data still represents the correct entity, unit, denominator, or process.
How Observability Modules Map to Each Property
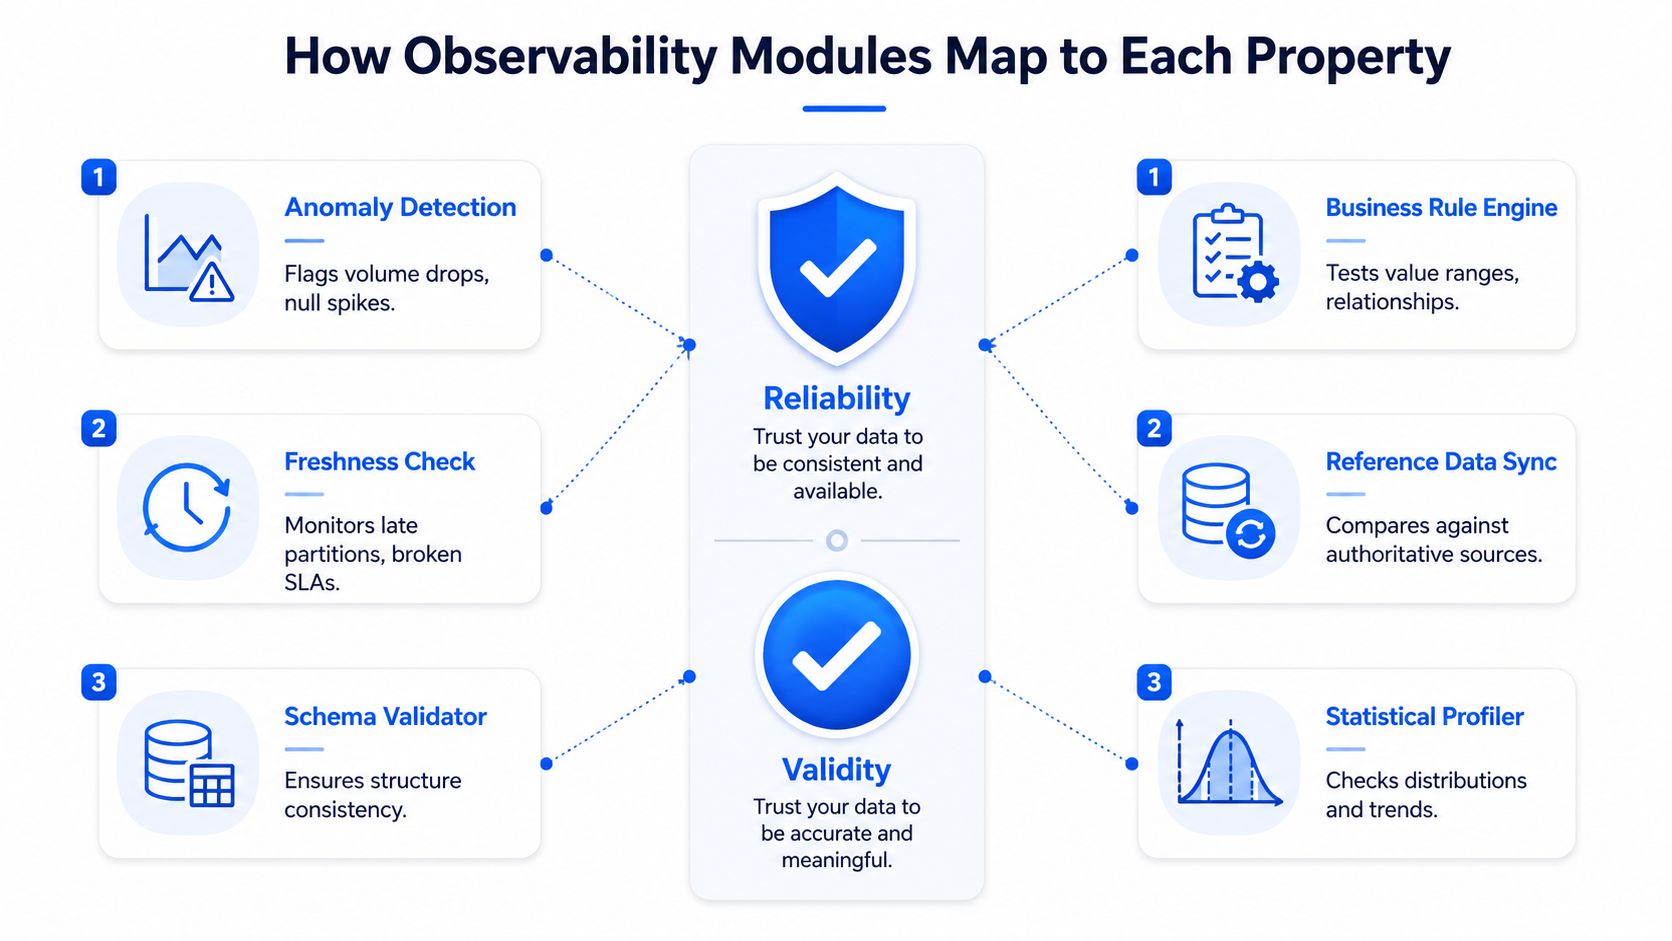
Observability modules aren't redundant versions of the same radar. Each one sees a different failure surface. Anomaly detection and freshness monitoring usually defend reliability because they identify unexpected behavior in delivery and repeated data patterns. Validation and schema controls provide stronger evidence for validity when they encode what the data is supposed to mean and how it is allowed to change.
Anomaly detection and freshness
Anomaly detection can flag a sudden volume drop, an unexpected null spike, or an unusual distribution change. Freshness checks monitor late partitions, missing loads, and broken delivery expectations. These controls answer a reliability question: did the data arrive and behave as it normally does?
A status interface, such as a reliability monitoring UI, can make these operational conditions visible to engineers and stakeholders. Yet a clean freshness status won't detect a value that arrives on time with an incorrect unit. An anomaly detector may miss a gradual semantic drift when the new behavior becomes the new baseline.
Validation and schema
Validation checks encode business meaning. They can test value ranges, referential relationships, mandatory conditions, reconciliations, and record-level rules. These checks are validity controls when they reflect an approved definition of the process.
Schema monitoring sits between the layers. It protects reliability by detecting structural changes that can break consumers, and it supports validity by flagging a field type or column change that may alter interpretation. Automated schema monitoring can identify added or removed columns and modified data types before downstream systems fail (Monte Carlo describes schema change monitoring mechanics).
What remains invisible
Lineage and column-level metrics expose both reliability and validity context, but they don't always generate the same alert. Lineage can show which transformation changed a field. It won't necessarily know that a join has introduced a biased population. A column profile can show distribution movement. It won't determine whether the movement reflects a real business event or an invalid metric definition.
A broader data observability approach should therefore combine four overlapping cones:
Anomaly monitoring detects unexpected behavior.
Freshness monitoring detects delivery timing failures.
Schema monitoring detects structural change.
Validation monitoring tests semantic and business correctness.
The gaps between those cones are where stable but wrong decisions survive.
Real World Scenarios Where One Fails Without the Other
A finance team can reconcile closing balances every night and still publish wrong regional revenue. Suppose a new foreign-exchange table inverts the conversion direction. The pipeline runs on schedule, balances reconcile within the same flawed logic, and freshness stays green. The validity signal remains unchallenged because no control compares the converted values with the authoritative rate interpretation.
Healthcare creates a similar split between delivery and meaning. Patient encounter counts arrive on time, with stable volume and expected fields, but a coding change reclassifies chronic visits as acute. The reliability controls see a dependable feed. A semantic validation rule tied to the coding standard or KPI definition would be more likely to expose the change. Without it, the organization may interpret a classification shift as a change in readmission performance.
Telecom systems demonstrate how a technically successful aggregation can still misrepresent activity. Call-detail-record pipelines execute according to schedule, but a timezone offset in the aggregation job causes evening calls to be counted twice. Freshness, schema, and basic volume checks can remain normal because the records are present and structurally correct. A validity check on time-window boundaries, event uniqueness, or reconciliation to a trusted usage total is the control that targets the defect.
Public-sector data can pass structural checks while failing representational ones. A census extract matches the expected schema, column types, and delivery schedule, yet a sampling-frame update undercounts rural households. The records are valid in format and reliable in arrival, but the population represented by the extract no longer matches the intended coverage. A completeness rule limited to non-null fields won't prove that the underlying sampling frame remains fit for purpose.
What the green dashboard hides
Scenario | Reliability signal | Validity signal | Consequence |
|---|---|---|---|
Finance | Stable delivery and reconciliation | FX interpretation mismatch | Distorted regional revenue |
Healthcare | On-time encounter counts | Coding meaning changed | Skewed readmission KPI |
Telecom | Scheduled CDR processing | Timezone aggregation error | Double-counted evening calls |
Public sector | Schema and schedule match | Coverage frame underrepresents rural households | Misleading population estimate |
These aren't examples of broken pipelines in the narrow engineering sense. They're examples of correct execution against an incorrect definition. The dashboard is green because the platform is measuring operational health, while the business needs evidence about representational accuracy.
Choosing Which Layer to Prioritize First
When reliability and validity compete for budget, teams shouldn't follow a textbook sequence automatically. They should prioritize the layer according to failure cost, detectability, and stakeholder pain. A late dataset that blocks every downstream report demands a different first investment from a valid-looking dataset that feeds regulated disclosures or machine-learning features.
Start with reliability when delivery failure creates immediate operational damage. That includes broken service-level agreements, missing partitions, recurring manual restarts, and dashboards that consumers can't access when they need them. In those environments, platform teams need dependable orchestration, freshness expectations, volume monitoring, and clear incident ownership before deeper semantic evidence can be interpreted confidently.
Start with validity when incorrect meaning can remain hidden. Revenue-critical KPIs, external reporting, regulated workloads, and model-training datasets deserve early semantic controls because consumers may not notice the defect. A stable wrong number can travel farther than a visibly failed job.
Criterion | Favor Reliability First | Favor Validity First |
|---|---|---|
Blast radius | A failed load blocks many downstream consumers | A wrong definition contaminates reports, models, or decisions |
Audit exposure | Operational uptime and delivery evidence are the immediate concern | Regulatory, financial, clinical, or public disclosures depend on correctness |
Time to detect | Failures are visible quickly through missing data or broken schedules | Errors can remain plausible and escape routine monitoring |
Cost of false positives | Teams can tolerate operational alerts while stabilizing delivery | Excessive semantic alerts may interrupt trusted workflows without clear ownership |
Consumer pain | Analysts wait for data or perform manual recovery | Stakeholders act on a result that appears normal but is wrong |
A practical decision rule
Teams running batch analytics for internal dashboards often fix reliability first because delivery interruptions dominate daily work. Teams shipping model features or publishing external metrics often fix validity first because the main risk is silent misrepresentation.
That isn't a maturity ranking. It's a risk allocation decision. The first control layer should target the failure stakeholders are least able to detect themselves. Once that layer is stable enough to produce interpretable signals, add the other layer rather than treating the first investment as a substitute for it.
Building a Combined Reliability and Validity Program
The strongest operating model treats reliability and validity as two control loops inside one data platform, not as one broad quality project. Build the reliability loop first where delivery is unstable. It should cover pipeline health, freshness expectations, row-count behavior, and structural changes. Invalid signals from a broken pipeline are difficult to interpret, so teams need a dependable operational baseline.
Then add the validity loop. Define business rules at record level, document metric semantics, reconcile critical outputs with source-of-truth systems, and use targeted sampling audits where automated rules can't capture the full construct. Guidance on data validation rules and continuous data quality is useful for turning abstract correctness requirements into repeatable controls.
Assign ownership by failure type
The platform team should own reliability signals such as failed jobs, missing deliveries, unexpected volume behavior, and schema events. Analytics engineering and domain stewards should own validity because they understand metric definitions, coding standards, reference data, and the business consequences of semantic drift.
Incident routing should reflect that split. A reliability breach can page the on-call engineer when a load is late or a downstream contract is broken. A validity breach should route to the data product owner and domain steward when a business rule fails, a reconciliation moves outside its accepted interpretation, or a metric definition changes.
Control Layer | What It Covers | Owning Team | Primary Signal | Success Metric |
|---|---|---|---|---|
Reliability | Delivery, freshness, repeatability, volume, and structural stability | Data platform team | Pipeline, SLA, anomaly, and schema alerts | Incident MTTR and SLA attainment |
Validity | Business meaning, rules, units, relationships, and reference alignment | Analytics engineering and domain stewards | Validation, reconciliation, and semantic alerts | Monthly validity defect rate per critical dataset |
Shared context | Lineage, ownership, documentation, and incident evidence | Platform and governance teams | Traceability and audit records | Faster diagnosis and clearer accountability |
A platform such as digna can run anomaly detection, timeliness monitoring, record-level validation, and schema tracking inside the customer's own environment, with checks executed in-database so data remains in place. That model fits organizations that need operational monitoring and semantic controls across warehouses, lakes, and pipelines without treating privacy, auditability, and delivery health as separate products.
The program should prove value through operational evidence, not dashboard volume. Track incident mean time to resolution, service-level attainment, and a monthly validity defect rate for each critical dataset. Review those measures with both engineers and domain owners, because a pipeline can be operationally healthy while a business metric is no longer fit for purpose.
digna helps teams monitor data behavior, timeliness, schema changes, anomalies, and record-level business rules inside their own environment. Visit digna to evaluate how separate reliability and validity controls could fit your critical datasets.
Frequently asked questions
What is the difference between data reliability and data validity?
Reliability is consistency under repeatable conditions; validity is correctness of the measurement target. They are separate control layers, which is why a pipeline can be perfectly stable and still produce wrong decisions, showing identical totals across three consecutive runs that are all wrong in the same way.
Which error does each one address?
Reliability is tied to random error, which creates variation between runs. Validity addresses systematic error, which creates a stable bias. That is the reason a consistent number feels trustworthy: consistency hides bias rather than revealing it.
What are the four validity lenses?
Content validity asks whether the metric covers the full set of business components it claims to. Construct validity asks whether it captures the intended concept rather than a convenient proxy. Criterion validity asks whether it agrees with a trusted reference. Face validity asks whether the field measures what its name suggests.
How does schema drift affect validity?
It damages face validity, because a field's structure no longer matches its documented meaning. The column still exists and still populates, so reliability checks stay green while the name on the field has quietly stopped describing what it now contains.
How do you test reliability in practice?
By repeating the measurement under conditions that should not change the result. In laboratory-style repeatability work about 10 replicates serves as a practical benchmark, and the data equivalent is comparing repeated runs of the same computation before trusting that stability means correctness.


