Data Governance and Data Quality: A Practical Guide
|
8
min read

In 2024, 62% of organizations identified a lack of data governance as their primary data challenge inhibiting AI initiatives, while 51% named data governance as a top data-integrity challenge, just behind data quality, according to Precisely's global research release. That finding changes the starting point: reliable AI and analytics don't depend on data quality work or governance work in isolation. They depend on a control system that assigns responsibility, defines fitness for use, measures defects, detects change, and routes problems to people who can fix them.
This guide treats data governance and data quality as an operating discipline, not a policy exercise. You'll learn how to distinguish the two, convert quality dimensions into KPIs, combine deterministic rules with observability, build an accountable operating model, and extend those controls to AI workloads. The practical question throughout is simple: who decides, what gets measured, what happens when the data fails, and how does the business know the program is working?
Table of Contents
Why Data Governance and Data Quality Are Now Linked
Organizations can't scale AI by adding governance documents to unreliable datasets. The 2024 research from Precisely connects weak governance with stalled AI readiness and broader data-integrity problems, showing that governance and quality operate as linked conditions rather than separate workstreams. Governance determines who owns a critical dataset, what “valid” means, and how exceptions are handled. Quality measurement shows whether those decisions work in production.
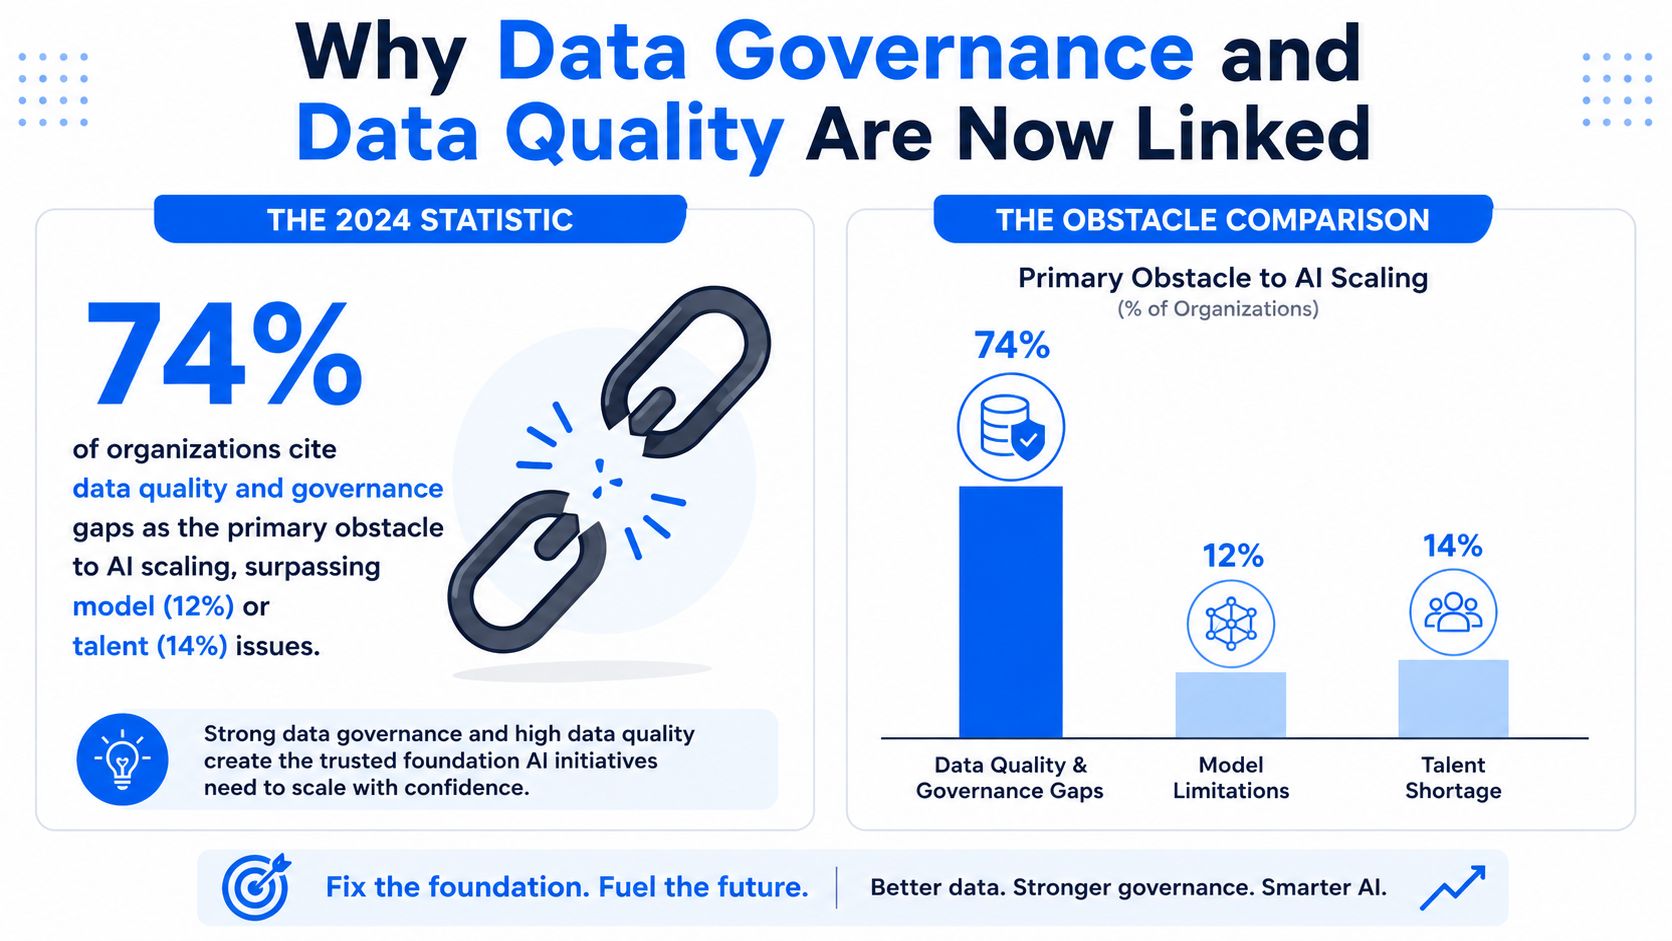
The infographic's 74% figure and comparison with model and talent issues aren't supported by the verified data provided, so they shouldn't be used as evidence. The verified finding is still strong enough to reframe the problem. A model team can tune algorithms, and an engineering team can increase pipeline capacity, but neither can resolve ambiguous ownership, conflicting definitions, missing lineage, or data that arrives too late for the decision it supports.
Older governance programs often treated success as the publication of policies, committees, and approval workflows. Those components still matter, but they don't prove that a customer record is complete, that a financial event arrived on time, or that a dashboard is using the intended source. The U.S. Government Accountability Office's description of data governance presents it as a framework of organizational structures and supports intended to improve data quality and availability. That framing points toward governance as management infrastructure, not paperwork.
Start with the control loop
A practical control loop has four parts:
Define the requirement. State what the data must contain, how current it must be, and which use case it supports.
Assign accountability. Name the owner who can approve the rule and the steward who manages day-to-day exceptions.
Measure and observe. Use quality checks, freshness signals, lineage, and operational alerts.
Remediate and learn. Fix the source, update the rule, or change the requirement when the business use changes.
This operating-model-first approach helps teams assess maturity accurately. A program with a catalog but no owners is incomplete. A dashboard full of quality scores but no remediation path is decorative. A policy without a measurable control is an intention, not governance.
For a broader explanation of why governance supports compliance, AI adoption, and business trust, see why data governance is essential for compliance, AI, and business trust. The useful next step isn't choosing a platform immediately. First, identify the critical data elements that affect decisions, then connect each element to a definition, owner, threshold, and response.
The Two Disciplines and How They Reinforce Each Other
A quality score has meaning only when someone has defined the intended use and the acceptable result. Data governance provides that control system. It sets decision rights, ownership, policies, standards, and escalation paths. Data quality provides the evidence: whether a data asset meets the requirement in actual use.
The relationship is easier to see through a simple example. A customer address may be adequate for regional campaign segmentation but unsuitable for shipping. A transaction timestamp may support daily reporting yet arrive too late for a fraud-control process. ISO 8000 therefore treats quality as context-dependent rather than absolute, as explained in guidance on how data governance aligns with data quality management.
Governance defines the measuring conditions. Quality monitoring shows whether those conditions hold.
Dimension | Data Governance | Data Quality |
|---|---|---|
Primary question | Who decides how data is managed? | Is the data fit for its intended use? |
Main mechanism | Roles, policies, standards, workflows, and accountability | Measurements, validation, profiling, monitoring, and remediation |
Typical output | Approved definitions, ownership records, access rules, and escalation paths | Quality scores, failed checks, incidents, trends, and corrective actions |
Success condition | People consistently apply decisions across the data lifecycle | Critical data meets agreed requirements for a business purpose |
The feedback loop matters more than the labels. Repeated null values might reflect a weak source process, an unclear business definition, an ineffective steward, or a check that runs after downstream users have already consumed the data. The quality result identifies the symptom. Governance determines who investigates, which decision applies, and how the issue is corrected.
Three boundaries keep the operating model clear:
Governance isn't security. Security protects confidentiality, integrity, and availability through controls such as access management. Governance establishes the wider accountability and decision framework in which those controls operate.
Quality isn't cleanliness. Values can look untidy and still be fit for a defined purpose. A polished dataset can remain wrong, stale, or inconsistent with an authoritative source.
A catalog isn't governance. A catalog records assets and metadata. Governance adds decision rights, owners, standards, workflows, and consequences when requirements are missed.
Role clarity prevents the central governance office from becoming a bottleneck. Owners approve definitions and requirements, stewards manage operational meaning and exceptions, custodians support technical controls, and consumers use data within the agreed conditions. This practical guide to data governance roles can help teams distinguish those responsibilities. With that separation in place, quality findings become observable control signals, not isolated dashboard warnings, and the organization can judge whether its data is ready for dependable analytics or AI use.
Core Data Quality Dimensions You Can Actually Measure
A quality dimension becomes useful only when it is tied to a business use, accountable role, threshold, measurement frequency, and remediation path. Without those elements, a dashboard can display attractive scores while users continue to receive unreliable data.
The six dimensions below are widely practical because they map directly to observable failure patterns.
Turn dimensions into operating controls
Accuracy asks whether a value represents reality. A validation process might compare customer status against an authoritative operational source, with the data owner approving the comparison rule.
Completeness asks whether required values are present. For customer PII, the requirement could be a defined completeness threshold measured daily, with a data steward owning exceptions and coordinating correction at the source.
Consistency checks whether the same concept follows the same definition across systems. If “active customer” differs between sales and finance, the domain owner must resolve the definition rather than asking analysts to reconcile it repeatedly.
Timeliness measures whether data arrives when the decision needs it. A governance program can use the formula Timeliness SLA Compliance = data deliveries available on time divided by total expected deliveries, multiplied by 100, as described by digna's data governance KPI guidance. The source engineering team typically owns delivery failures, while the business owner confirms whether the SLA supports the use case.
Uniqueness prevents duplicate representations of the same entity. Party identifiers can be checked at ingestion, with governance approving the matching rules and the domain owner accepting the residual exceptions.
Validity tests whether values conform to an accepted format, range, list, or business rule. A steward may manage exceptions, but the custodian usually implements the technical check where invalid records enter the platform.
Dimension | Example KPI / SLA | Typical Failure | Accountable Role |
|---|---|---|---|
Accuracy | Agreement with an approved authoritative source | Incorrect status, amount, or identifier | Data owner |
Completeness | Required fields meet the agreed threshold | Null or missing critical attributes | Data steward |
Consistency | Shared definition produces aligned values across systems | Conflicting customer or product states | Domain owner |
Timeliness | Delivery meets the agreed arrival window | Delayed, missing, or early load | Source engineering team |
Uniqueness | Identifier collision or duplicate rate stays within tolerance | Multiple records for one party | Data owner and steward |
Validity | Values conform to approved rules or reference values | Invalid format, range, or code | Data custodian |
Quality teams may also need operational signals outside the six core dimensions. For example, a team evaluating real-time monitoring SERP API capabilities should still map monitoring output to a named data owner and a documented business requirement. The tool can surface behavior, but governance decides which deviations matter and what response is required.
A useful overview of data quality dimensions helps teams build a shared vocabulary. The harder work is selecting only the controls that affect decisions, then making someone responsible for every exception.
From Rules to Observability and What Catches What
Traditional quality rules are precise and valuable. They catch defects the team already understands, such as nulls in mandatory fields, values outside an approved range, invalid reference codes, broken relationships, or a schema that no longer matches a contract. These checks are deterministic, explainable, and often necessary for regulatory evidence.
Observability answers a different question: what changed in the data system that could make a trusted output unreliable? It watches for delayed or missing loads, unusual volume, distribution shifts, structural changes, and downstream exposure. The Databricks explanation of data observability describes the role of freshness, distribution, schema, and lineage checks. Each catches a different failure mode.
Use both layers deliberately
Detection Method | Failure Mode Caught | Typical Tooling | Best-Fit Use Case |
|---|---|---|---|
Validation rule | Invalid value, missing field, or failed business condition | Data quality engine or SQL check | Contractual and regulatory controls |
Schema check | Column removal, addition, or type change | Schema registry or schema tracker | Pipeline compatibility |
Reconciliation | Mismatch between source and target totals or keys | Batch comparison workflow | Financial and operational transfers |
Freshness monitoring | Delayed or absent data delivery | Observability platform or scheduler | Time-sensitive reporting |
Distribution monitoring | Drift in null rates, ranges, or value patterns | Profiling and anomaly detection | Slowly degrading datasets |
Lineage-aware alert | Downstream dashboards or models at risk | Catalog and lineage graph | Impact analysis and prioritization |
Rules are strongest when the requirement is known and stable. If a required field must never be empty, encode that expectation. If a valid product code must come from an approved reference set, enforce it at the boundary. Don't replace an explicit control with an unexplained anomaly score.
Observability is strongest when the failure is indirect or unfamiliar. A vendor can change its output without violating a documented field rule. A pipeline can continue running while delivering stale partitions. A feature can retain the same schema while its distribution shifts enough to affect a model.
Practical rule: Use observability to discover recurring failure patterns, then turn the important patterns into explicit rules with owners and response times.
A mature program layers the approaches. Start with observability to find unknown failure modes, add deterministic rules for known requirements, and connect both to lineage so teams can prioritize affected outputs. The distinction between data observability and data quality is useful here: quality checks evaluate defined expectations, while observability provides broader visibility into changing system behavior.
Building the Operating Model Behind the Policies
A policy becomes operational only when a person can answer three questions without delay: who owns this data, what standard applies, and who fixes a failure? If nobody can answer, the organization has documentation but not control.
Start with four roles:
Data owner: Makes business decisions about the asset, approves definitions, thresholds, access expectations, and risk treatment.
Data steward: Manages definitions, monitors quality issues, coordinates remediation, and maintains business context.
Data custodian: Implements technical storage, access, pipelines, validation, monitoring, and change controls.
Data consumer: Uses the data for operations, reporting, analytics, or models and reports when it fails the intended purpose.
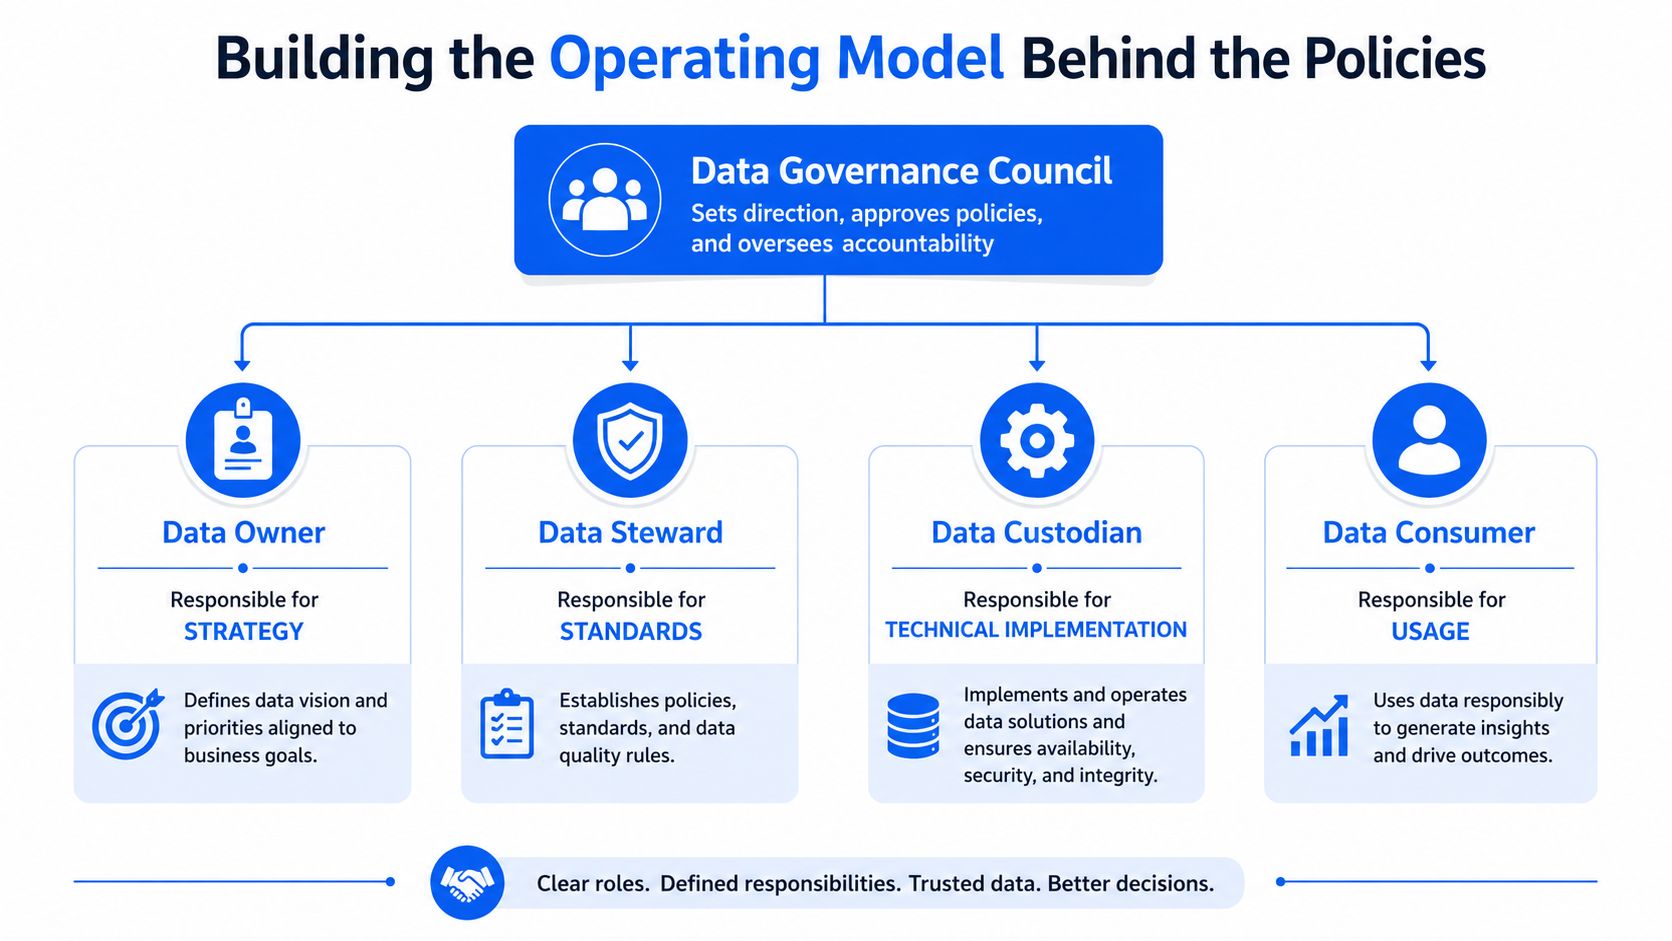
Give the council real decision rights
A stewardship council shouldn't exist only to review presentations. It needs authority to approve shared definitions, prioritize critical data elements, resolve conflicts between domains, accept risk, and escalate issues that cross organizational boundaries. The council can set direction, but embedded stewards must handle daily work close to the source and business process.
Ownership can be organized by domain, asset, or dataset. Domain ownership works well when customer, finance, product, or supply data has coherent business leadership. Asset ownership is more precise for high-risk tables or reports. Dataset-level ownership helps when a single pipeline has a narrow but important purpose.
Choose structure and connect the tools
A centralized model offers consistent standards and simpler escalation, but it can become distant from operational context. A federated model gives domains more control and local knowledge, but it needs shared standards to prevent fragmentation. A hub-and-spoke model combines a central governance function with domain stewards who execute controls where the data is created and used.
The catalog, glossary, lineage system, quality engine, and access tooling should reinforce one another. A glossary defines “revenue event.” The catalog identifies its assets. Lineage shows where the value travels. Quality monitoring tests the requirement. Access controls determine who can use it. An incident workflow records the decision and remediation.
Assign SLAs to critical data elements, not every column equally. A revenue timestamp, patient identifier, or regulatory classification may need explicit controls. Lower-risk attributes can use lighter monitoring. This prioritization keeps governance practical and protects the program from becoming an unmanageable inventory exercise.
Making Your Data AI-Ready With Governance as the Backbone
AI readiness depends on whether teams can observe and control the data behind a model. A clean table and a catalog entry do not show where training examples came from, which transformations changed them, what labels mean, or whether the data is approved for its intended use. Teams also need to compare the production feature with the training feature before a model enters operation.
Lineage and provenance provide that control system. For each AI dataset, record its source, transformation history, owner, access conditions, relevant consent or licensing basis, and approved use case. Connect the record to the model, evaluation set, feature pipeline, prompt context, and monitoring process. This chain makes quality observable because a failed check can be traced to a source, transformation, or decision owner.
The right checks depend on the workload. A fraud model may need tighter freshness and label controls than a periodic churn dashboard. A recommendation system may depend on event order and consistent features. A generative AI application may rely on retrieval context, document provenance, duplication checks, and protection from outdated source material. For a practical explanation of why generative AI depends on reliable source data, see data quality and generative AI.
Use workload-specific controls:
Feature consistency: Verify that training and serving pipelines use compatible definitions and transformations.
Label quality: Track ambiguous, missing, or contradictory labels, then route disputes to domain stewards.
Evaluation data: Protect representative evaluation datasets from accidental contamination and document their intended scope.
Bias monitoring: Review whether coverage and labeling patterns produce uneven performance across relevant groups.
Feedback routing: Send model errors to the responsible data steward as well as the model team.
Recent analysis connects AI compliance with data governance and reports that data quality remains the top challenge across seven of eight data-integrity questions. It also reports that 48% of organizations had not implemented programs to govern data used for AI, in DataVersity's analysis of governance frameworks and AI compliance. The operating implication is clear: an AI program that cannot trace and measure its inputs has a structural blind spot.
Governance therefore certifies fitness for a particular AI workload. It does not label a dataset universally “AI-ready.” Teams can make that judgment only by defining the intended use, measuring the relevant quality dimensions, and observing those measures throughout the data and model lifecycle.
Proving Governance Value Beyond Compliance Checklists
A governance program proves its value when it shows what changed in the business, not only which policies were completed. Compliance evidence still matters, yet leaders also need a clear connection between a data failure, the control applied, and the operational result.
Board's coverage of the State of Enterprise Data Governance report reports that 39% of data leaders struggle to demonstrate governance impact to leadership. The same coverage describes teams relying heavily on operational measures rather than business outcomes. More dashboard tiles will not close that gap. The measures must connect with decisions executives already understand.
Start with the decision, then trace backward to the data and control behind it. For example, a delayed planning decision may point to stale inputs, an unclear owner, or a quality exception that remained unresolved. That evidence chain makes governance observable. It also gives teams a practical way to test whether a control protects a business process.
Useful measures include:
Incident reduction: Record data incidents, their severity, the rework they create, and the time spent diagnosing and correcting them.
Decision reliability: Link freshness, accuracy, or completeness in critical data to campaign decisions, underwriting, forecasting, or operational planning.
Risk response: Measure the time required to identify affected assets, gather evidence, and explain a data change through lineage and ownership records.
Adoption and resolution: Check whether stewards resolve assigned issues and whether consumers use trusted assets instead of maintaining private extracts.
Governance Activity | Business KPI | Measurement Source | Reporting Cadence |
|---|---|---|---|
Monitor critical data elements | Rework or incident burden | Issue workflow and service records | Monthly |
Enforce timeliness controls | Decisions delayed by stale data | Delivery monitors and business process logs | Weekly or monthly |
Maintain lineage | Time needed for impact analysis | Lineage and audit records | Quarterly |
Resolve quality exceptions | Time from detection to correction | Stewardship workflow | Monthly |
Standardize key definitions | Conflicting reports or reconciliations | Glossary and reporting review | Quarterly |
These cadence labels are operating recommendations, not universal requirements. Baseline the current process before claiming improvement, record each KPI's source, and explain results in business language. “Completeness improved” carries less weight than “the planning team stopped rebuilding the same report because its inputs were available and consistently defined.”
A single completeness percentage can also hide priority failures. A few missing values may affect a high-consequence decision while many low-value fields remain complete. For organizations managing complex supplier exposure, reducing governance risk in supply chains offers a useful way to connect data controls with operational and third-party risk discussions.
A 90-Day Plan to Align Governance With Your Quality Program
A focused alignment effort should produce working controls, not a large policy archive. Sequence the work so the team learns from real data, real owners, and real incidents.
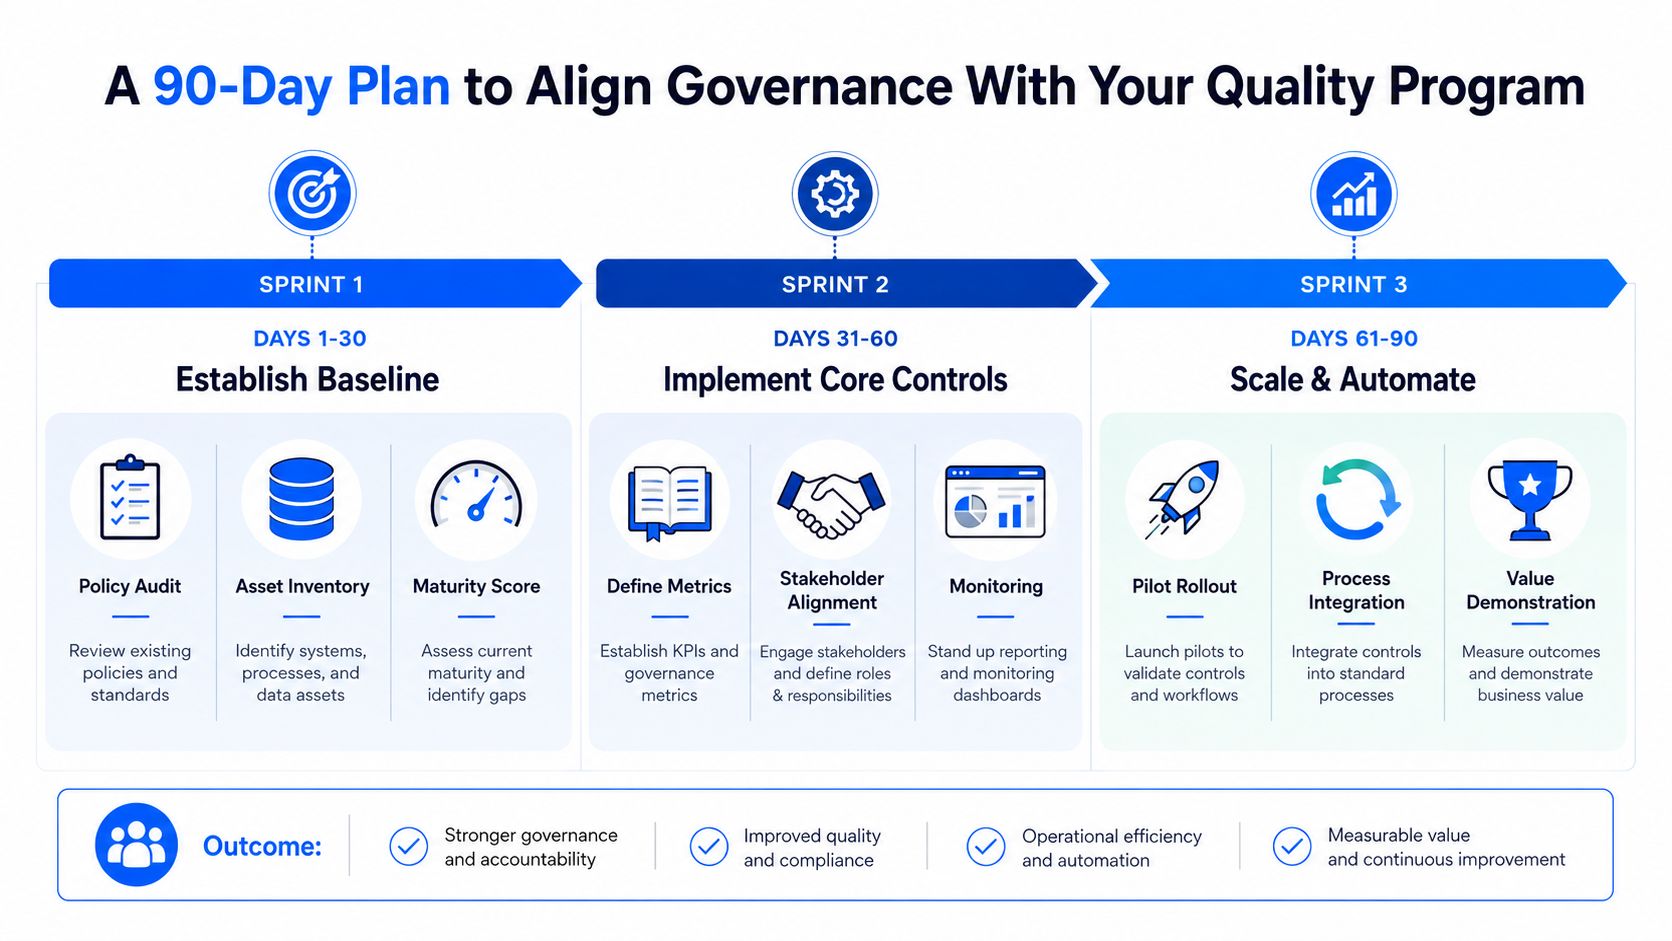
Days 1 to 30 establish the baseline
Audit existing policies and identify contradictions. Inventory the data assets that support important reports, operational processes, and AI workloads. For each asset, record the owner, steward, source, users, known defects, and intended use. Select an executive sponsor and confirm which stewards can make decisions or escalate them.
Don't wait for a platform purchase. A structured spreadsheet, issue register, warehouse queries, and a shared glossary can establish the first baseline. The goal is to expose ownership and measurement gaps, not to create a perfect catalog.
Days 31 to 60 align instrumentation
Define domain-level SLAs for the critical data elements identified in the first sprint. Connect freshness, schema, validation, and anomaly signals to the governance workflow. Launch a lightweight catalog with ownership metadata, definitions, lineage references, and links to quality results.
At this stage, separate alerts from incidents. An unusual pattern may require investigation, while a failed regulatory rule may require immediate escalation. Make the response path explicit.
Days 61 to 90 prove and iterate
Publish the first business-facing scorecard. Run a remediation sprint on the top three issues selected by business impact, not by technical convenience. Formalize the stewardship council cadence, decision log, escalation path, and review of unresolved exceptions.
Short FAQ
How can we start without buying a tool? Begin with a critical-asset inventory, a glossary, SQL checks, delivery records, and an issue workflow. Prove that owners respond to measured defects before expanding technology.
What if stewards have no authority? Give the council documented decision rights, name an executive sponsor, and define escalation deadlines. A title without authority won't resolve cross-domain conflicts.
How do we maintain momentum after the first push? Tie review meetings to business KPIs, rotate attention toward the highest-impact assets, and retire controls that no longer serve a real use case. Governance should become part of delivery and incident management, not a separate annual exercise.
digna offers an enterprise data quality and observability platform that runs inside a customer's environment, with modules for anomaly detection, timeliness, validation, schema tracking, and in-database monitoring. If your team needs to connect measurable quality controls with governance workflows across warehouses, lakes, or pipelines, visit digna to explore the platform and its deployment options.
Frequently asked questions
How do data governance and data quality relate?
As linked conditions rather than separate workstreams. Governance defines the measuring conditions, deciding who owns data and what fit for use means; quality then measures whether the data meets them. A quality score has meaning only when someone has already defined the intended use and the acceptable result.
What does the control loop look like?
Four parts that repeat: define the requirement, assign accountability, measure and observe, then remediate and learn. Treating governance as an operating model rather than a document set is what lets a team assess its maturity accurately instead of counting published policies.
Is weak governance really blocking AI?
The 2024 Precisely research links it directly: 62% of organizations identified a lack of data governance as their primary data challenge inhibiting AI initiatives, and 51% named governance as a top data-integrity challenge, just behind data quality itself.
What distinguishes the two disciplines in practice?
Their primary question. Governance asks who decides how data is managed and produces approved definitions, ownership records, access rules and escalation paths. Quality asks whether data is fit for its intended use and produces scores, failed checks, incidents, trends and corrective actions.
Is data quality an absolute property?
No. ISO 8000 treats quality as context-dependent rather than absolute, which is precisely why governance has to come first. The same dataset can be entirely fit for one decision and unusable for another, and only the defined intended use settles which verdict applies.


