Data Quality Monitoring Databricks: A 2026 Guide
|
8
min read
If you've ever watched a Delta pipeline finish cleanly while a downstream dashboard still showed stale numbers, you already know the problem isn't whether something ran. The problem is whether the data was safe to use when it landed. In data quality monitoring Databricks setups, that gap shows up fast in regulated environments, where a completed job can still carry incomplete loads, delayed commits, or silent schema changes that nobody sees until a business user complains.
Databricks' native monitoring gives teams a real starting point, especially because it records historical profile metrics like count, num_nulls, avg, min/max, stddev, and 1,000 quantiles for each profiled column, and it compares a current table against a baseline or successive windows to detect drift. It also extends into inference tables with ML metrics such as accuracy_score, log_loss, mean_squared_error, mean_absolute_percentage_error, and r2_score. That's useful, but it's still only one layer of the stack, not the stack itself, because detection without ownership, routing, and release gating doesn't keep bad data out of production. Databricks data quality monitoring documentation
Table of Contents
When Native Databricks Monitoring Stops Being Enough
Freshness and completeness are necessary, not sufficient
What the rest of the stack has to add
Architecture for a Layered Monitoring Stack
Where the modules fit
Enabling Unity Catalog Data Quality Monitoring
What the native states mean
A minimal rollout sequence
Layering Record Validation and Anomaly Detection
Add deterministic rules first
Add baseline learning for business columns
Closing the Ownership and Lineage Gap
What native monitoring still leaves open
A practical enrichment flow
Alerting, Dashboards, and CI/CD Gating
Route alerts by ownership, not just by severity
Gate promotions before they hit production
A 90-Day Rollout Plan and Troubleshooting Checklist
Fast fixes for the problems that show up most
When Native Databricks Monitoring Stops Being Enough
Teams in regulated industries usually run into the limits of native monitoring after a near miss or a post-incident review. The pattern is familiar. A schema-level monitor is turned on, the dashboard job completes on schedule, and the table looks healthy at first glance. Then someone sees that the latest Silver table is still pointing at yesterday's source commit, or that a partial load made it through because the pipeline checked only that data arrived, not that it arrived complete enough to trust.
Freshness and completeness are necessary, not sufficient
Databricks' built-in monitoring centers on freshness and completeness, and that is the right first layer because those signals catch obvious failure modes early. The service learns historical and seasonal patterns, then flags unexpected changes with explicit statistical outputs instead of manual inspection. It can also mark a table stale when the next commit arrives later than the learned schedule, or incomplete when the last 24-hour row count falls below the model's lower expected bound. That behavior makes operational sense, but it still leaves a wide gap between “something looks off” and “this specific business rule failed.”
The practical problem is that a schema toggle can create false confidence. A table can be technically present and still be wrong for reporting, ML features, or regulatory extracts. If the pipeline checks only arrival and volume, it will miss a foreign key mismatch, a broken null constraint, or a value that is structurally valid but semantically wrong. Teams that need auditability have to layer in record-level checks, owner-aware routing, and evidence that goes beyond the schema scan.
Practical rule: if a monitor can tell you that data moved, but not whether the right records moved, it signals symptoms without enforcing trust.
What the rest of the stack has to add
The rest of the design fills four gaps. First, record-level validation catches deterministic business rules. Second, timeliness baselines separate an expected delay from a missed delivery. Third, lineage-aware alerting keeps the wrong team from getting paged. Fourth, CI/CD gating blocks bad changes before they reach production tables.
That is the difference between a monitor that reports symptoms and an observability stack that supports trust in production. In a real Databricks deployment, the starting point is a layered approach built around Unity Catalog, pipeline expectations, and in-database analysis, not a single toggle in the UI. For a practical example of how teams package those layers into one operating model, see the Databricks observability implementation pattern.
Architecture for a Layered Monitoring Stack
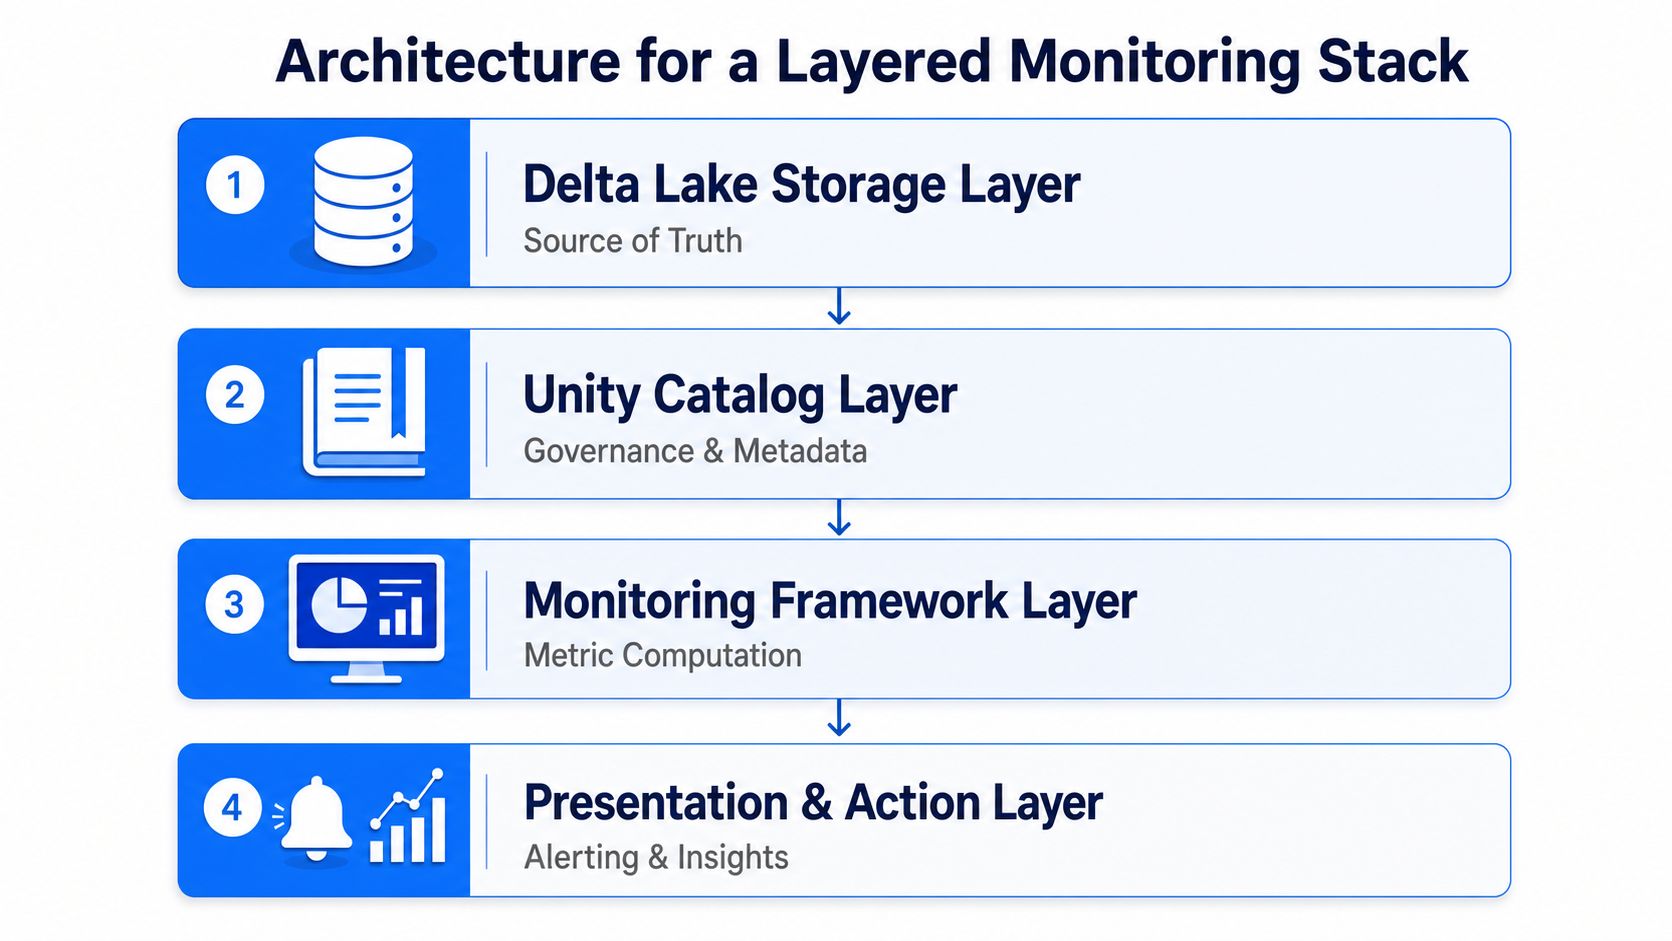
A production data quality monitoring Databricks setup works best as a layered stack. Delta Lake Storage holds the source of truth. Unity Catalog provides governance and metadata. Delta Live Tables is where declarative checks run. The observability plane reads system tables and metric outputs, while keeping production data inside the environment.
A common failure mode is treating every signal as the same kind of problem. A late table, a short load, a failed business rule, and a schema shift do not call for the same response, so they should not share one alert path. Databricks native monitoring is strongest at platform-level health because it scans critical tables in a schema, learns historical patterns, and stores results inside the customer environment. Microsoft's Azure Databricks documentation also describes the monitoring results as a system table with indefinite free retention, which makes it suitable for historical review and audit work across the account. Azure Databricks system tables for data quality monitoring
The split should stay clear. Platform monitoring answers whether the table arrived on time and with enough volume to trust. Pipeline expectations answer whether a record broke a rule. Anomaly detection answers whether a business column drifted away from its learned baseline. That division keeps on-call traffic manageable because every incident does not get flattened into a generic failure.
Where the modules fit
The digna module map lines up with that design. Data Anomalies covers baseline learning and ongoing anomaly detection. Timeliness covers expected-arrival windows and delayed loads. Data Validation enforces record-level rules. Schema Tracker watches for structural drift. That split fits the architecture because the observability plane can consume those signals without moving rows out of the warehouse or lake.
Keep the computation close to the data. In regulated environments, that is not just a performance choice, it is the boundary that keeps production records inside the customer's environment.

The value of the diagram is operational, not visual. It shows the control flow that works in production. The pipeline emits signals, the observability plane scores them, and the alerting layer decides what gets routed, suppressed, or escalated. That pattern scales as the estate grows because it avoids pushing every decision into one monolithic monitor.
Enabling Unity Catalog Data Quality Monitoring
Databricks enables monitoring at the schema level, not by hand-writing a check for every table. The operational move is straightforward. Enable the monitor in Unity Catalog, let the first scheduled job run, and then inspect the resulting system tables and quality views. The default cadence is hourly, and Databricks says the built-in historical backtest can simulate the monitor as if it had been enabled two weeks earlier, which is a useful way to seed a baseline before you trust live signals. Unity Catalog data quality monitoring rollout details
What the native states mean
Monitor state | Condition | Operational meaning |
|---|---|---|
Stale | Next commit arrives later than the learned schedule | The pipeline is late, or upstream delivery shifted |
Incomplete | Last 24-hour row count falls below the model's lower expected bound | The table landed, but the volume looks short |
Healthy | Freshness and completeness stay within learned bounds | The table matches expected behavior for now |
That state model is practical because it gives operations teams something actionable without forcing them to define thresholds from scratch. Microsoft's Azure Databricks documentation says the background job monitors freshness and completeness, uses smart scanning to decide when to scan, and logs quality issues into a table that can be reviewed in Catalog Explorer or Governance Hub. Azure Databricks monitoring workflow
A minimal rollout sequence
Start with a handful of Bronze tables that feed critical downstream processes. Turn on the schema monitor, let the first refresh establish a baseline, and then inspect the history before connecting alerts. If you enable too many schemas on day one, every false positive becomes a governance meeting.
A simple SQL check is often enough to start:
That query isn't meant to replace the UI. It's meant to give platform teams a fast way to inspect monitored schemas and decide where the next tuning pass belongs. Once the baseline is stable, the monitor output becomes one signal in the broader incident loop, not the entire response plan.
Layering Record Validation and Anomaly Detection
A table can land on time, pass a schema check, and still break the business. A claim file might load cleanly, while a refund amount goes negative, a required region code is missing, or a healthcare record slips through with an invalid identifier. Native freshness and completeness checks catch the arrival pattern, not the rule that finance, healthcare, or operations care about. That is why the next layer is Delta Live Tables expectations, which keep deterministic checks explicit and versioned with the pipeline.
Add deterministic rules first
Use DLT expectations for conditions that should never depend on learned behavior. Null checks, range checks, and referential integrity are the obvious starting points, because they fail fast and give you a clear reason to stop or quarantine bad records.
Multi-table checks belong close to the data as well. Put the logic in a join inside the pipeline or write the result into a downstream validation table, then let the pipeline decide whether a record passes. That keeps the rule in the same execution path as the data and avoids pushing rows into a separate tool just to answer a yes-or-no question.
Add baseline learning for business columns
Once the deterministic rules are in place, use anomaly detection for columns where the shape changes over time. Counts, averages, distributions, and seasonality are often more useful than a fixed threshold, especially for operational metrics that drift with business cycles. Databricks' profiling layer stores historical metrics such as count, num_nulls, avg, min/max, stddev, and 1,000 quantiles, which gives you a time series for behavior instead of a one-time snapshot. It also supports comparison against a baseline or successive windows, so the observability plane can watch for drift without shipping production data out of the environment. Databricks profiling and drift metrics
A practical pattern is to compute a rolling baseline in-database and write the score into a Delta table:
That table can feed your alerting layer, a dashboard, or a separate rule engine. If you want a dedicated anomaly workflow, digna's anomaly detection approach follows the same pattern, baseline first, alert second, with the computation staying in-database.
The strongest control is the one that never leaves the warehouse. In regulated workloads, that matters as much as the signal itself.
The split is practical. DLT expectations enforce what you already know must be true. Baselines catch what changes over time. Used together, they cover the cases that schema-level monitoring does not know how to judge.
Closing the Ownership and Lineage Gap
Detection is usually the easy part. Routing is harder. A monitor can show that a table is stale or incomplete, but it still does not tell you who owns it, which upstream feed broke it, or whether the blast radius reaches a revenue dashboard, a clinical report, or a regulatory extract. Databricks' system-table monitoring does expose downstream impact fields, including a severity scale from 0 to 4 where 4 = very high, plus example fields like num_downstream_tables = 5 and num_queries_on_affected_tables = 120 over the last 30 days. That matters because it gives you a concrete view of impact, not just a failed status.
What native monitoring still leaves open
The missing pieces are governance, ownership, and actionability. Teams still need criticality tiers, owner tags, lineage triage, and release-gating rules. Microsoft's Azure Databricks documentation is explicit that the native service is centered on schema-level anomaly detection for freshness and completeness, with more checks described as coming later, which is why most enterprises still layer an external observability plane on top. Azure Databricks monitoring scope
A practical pattern is to enrich system-table output with Unity Catalog metadata. If a Bronze table fails, the alert should route to the Bronze owner, not the Silver consumer. If a Gold table regresses, the page should go to the owner of the serving layer and include the downstream impact fields so on-call can judge urgency before escalating. That keeps the native monitor in its lane and gives the response path enough context to act.
A practical enrichment flow
Pull monitor issues from the system table.
Join them to Unity Catalog tags for owner, criticality, and domain.
Merge lineage metadata to identify downstream consumers.
Route alerts by severity and business importance.
That join turns a raw monitor event into an operational record. It also makes audit reviews easier because the event carries context, not just a status.
A common pattern in finance and public-sector environments is to treat the monitor as the detector and the alerting layer as the policy engine. That boundary keeps the native feature useful without pretending it can solve accountability on its own. The same separation also leaves room for timeliness baselines, in-database validation, and CI/CD gating when schema-level monitoring stops short.
Alerting, Dashboards, and CI/CD Gating
Once the metrics exist, the next mistake is to dump them into one dashboard and call it observability. That hides more than it reveals. A platform health view should show scan status, monitor state, and job health. A business health view should show freshness, completeness, and drift against the data consumers use. Those are different audiences, and they need different alarms.
Route alerts by ownership, not just by severity
The routing logic should be simple enough to explain in an audit. Criticality tier first, owner tag second, lineage context third. If the issue lands in Gold and the downstream impact is high, escalate immediately. If it's an upstream Bronze feed with no active consumers, route to the owning team and keep the page quiet unless the delay persists.
That's also where a platform like digna dashboards for data quality fits naturally. The useful part isn't the UI itself. It's the split between platform metrics and business metrics, because that's what keeps operators from chasing pipeline noise when the actual issue is a broken business rule.
Gate promotions before they hit production
Monitoring belongs in the release pipeline, not just the incident workflow. If a schema change, validation failure, or new expectation breaks a control, promotion should stop before the change lands in production. Databricks Asset Bundles can carry that check alongside the job definition, which is exactly where governance teams want it because the evidence is versioned with the deployment.
That example is intentionally minimal. In a real deployment, the validation task should query the monitored Delta table or validation view and fail the bundle when a rule is breached. The point is to make quality part of the deployable artifact, not an after-the-fact dashboard someone remembers to check.
Monitoring-as-code matters in regulated environments because every change needs a traceable control. If the rule lives in the pipeline, the audit trail lives there too.
A 90-Day Rollout Plan and Troubleshooting Checklist
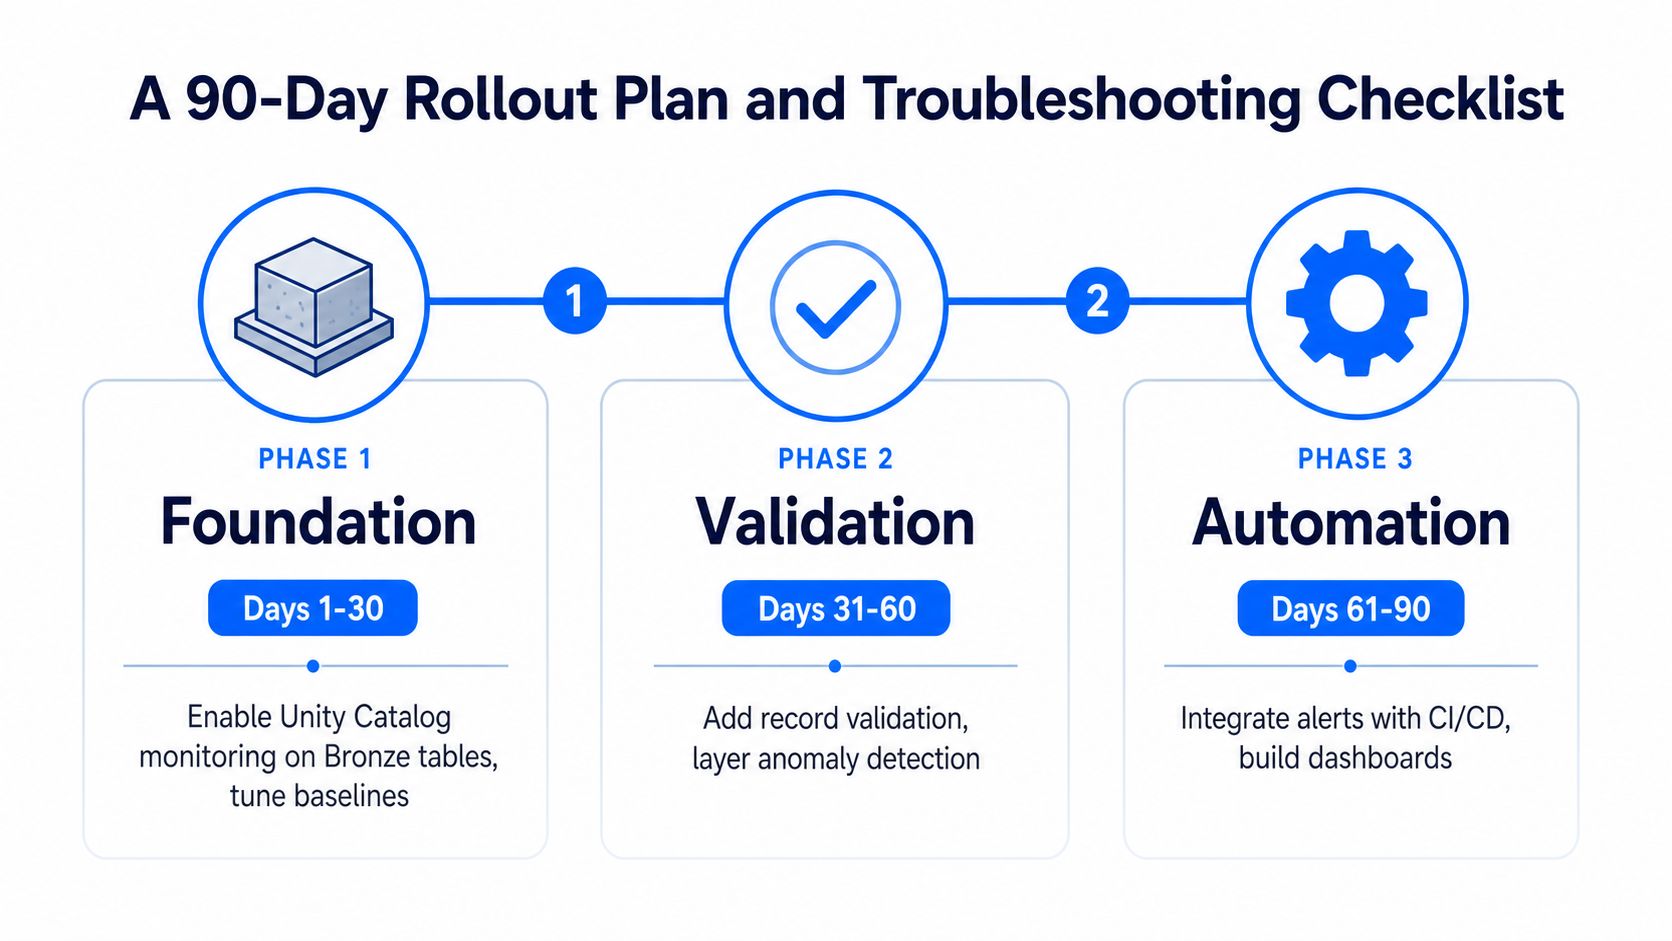
The fastest way to make this operational is to phase it. Days 1 to 30 are for enabling Unity Catalog monitoring on a small set of Bronze tables and tuning the baselines. Days 31 to 60 are for adding record validation and timeliness checks on Silver tables. Days 61 to 90 are for wiring alerts into CI/CD, attaching criticality tiers, and routing incidents to owners.
Fast fixes for the problems that show up most
Backfill gaps. Re-run the monitor after the historical load completes, then treat the first clean window as the new baseline.
False freshness alerts after schema evolution. Check whether the learned schedule still matches the new commit rhythm, then re-baseline the monitor.
Severities stuck at 0. Confirm that downstream-impact metadata and lineage are populated, because no blast radius means no meaningful severity.
Lineage tables showing no downstream. Verify Unity Catalog lineage and table registration before you trust the graph.
Alerts hitting the wrong team. Revisit owner tags and criticality labels, then route from the enriched alert record instead of the raw monitor output.
The operational lesson is simple. Native Databricks monitoring is strong at detecting table health, but production confidence comes from how you layer governance, validation, and routing around it. If you're building that stack now, digna can sit alongside Databricks as the in-database observability layer for anomalies, timeliness, validation, and schema drift. Visit digna to see how it fits into a regulated Databricks operating model and compare it against your current monitoring setup.
See how digna does this in practice: data quality for Databricks.
Frequently asked questions
What does Databricks data quality monitoring check out of the box?
Native monitoring focuses on freshness and completeness. It learns historical and seasonal patterns, marks a table stale when the next commit arrives later than the learned schedule, and incomplete when the last 24-hour row count drops below the lower expected bound. Profiles also record count, num_nulls, avg, min/max, stddev and 1,000 quantiles.
How do I enable Unity Catalog data quality monitoring?
You enable it at the schema level rather than writing a check per table. Turn on the monitor in Unity Catalog, let the first scheduled job run, then inspect the system tables. The default cadence is hourly, and a historical backtest simulates the monitor as if enabled two weeks earlier to seed a baseline.
Why is native Databricks monitoring not enough for regulated data?
Because a table can arrive on time with enough rows and still be wrong. Native checks miss foreign key mismatches, broken null constraints and semantically wrong values. The article adds four layers: record-level validation, timeliness baselines, lineage-aware alerting and CI/CD gating that blocks bad changes before they reach production tables.
How do I write data quality rules with Delta Live Tables expectations?
Use DLT expectations for deterministic rules that should never depend on learned behavior. The article's examples are CONSTRAINT valid_customer_id EXPECT (customer_id IS NOT NULL), valid_amount EXPECT (amount >= 0) and a region check limited to NA, EMEA and APAC. Failing records can then be stopped or quarantined with a clear reason.
How should Databricks data quality alerts be routed?
Route by ownership, not just severity. Enrich system-table output with Unity Catalog metadata so a Bronze failure pages the Bronze owner rather than the Silver consumer. Include downstream impact fields, such as the 0 to 4 severity scale and the number of queries on affected tables, so on-call can judge urgency before escalating.



