10 Data Quality Control Methods That Work
|
9
min read

A single rule set won't protect a modern data environment. Deterministic checks catch invalid records, but they won't necessarily detect a legitimate-looking volume collapse. A static threshold can flag a seasonal spike as an incident, while a delivery monitor can identify a missing load without explaining whether the records that arrived are valid. Structural controls, behavioral signals, business metrics, platform telemetry, and human collaboration each expose a different failure mode.
The practical answer isn't to choose between testing and observability. Teams need complementary control layers that work together across ingestion, transformation, storage, and consumption. That principle follows the broader evolution of quality control, from Walter A. Shewhart's 1924 control charts for separating normal from special-cause variation to modern methods that measure dimensions such as completeness, timeliness, and consistency. The history of statistical quality control shows why abnormal behavior deserves investigation, while data quality dimensions provide a language for describing what “good” means.
The 10 data quality control methods below are organized as a control stack. Start with explicit rules, add learned and statistical signals, monitor delivery and structure, protect sensitive data with the right architecture, then connect technical incidents to business impact and team workflows. For a practical application, see this guide to validating social pipeline data.
Table of Contents
3. Timeliness and Data Arrival Monitoring with Expected Delivery Time Calculation
9. Comprehensive Data Observability Dashboards and Collaborative Monitoring
10. Modular Quality Control Architecture with Rapid Deployment
1. AI-Driven Anomaly Detection with Baseline Learning
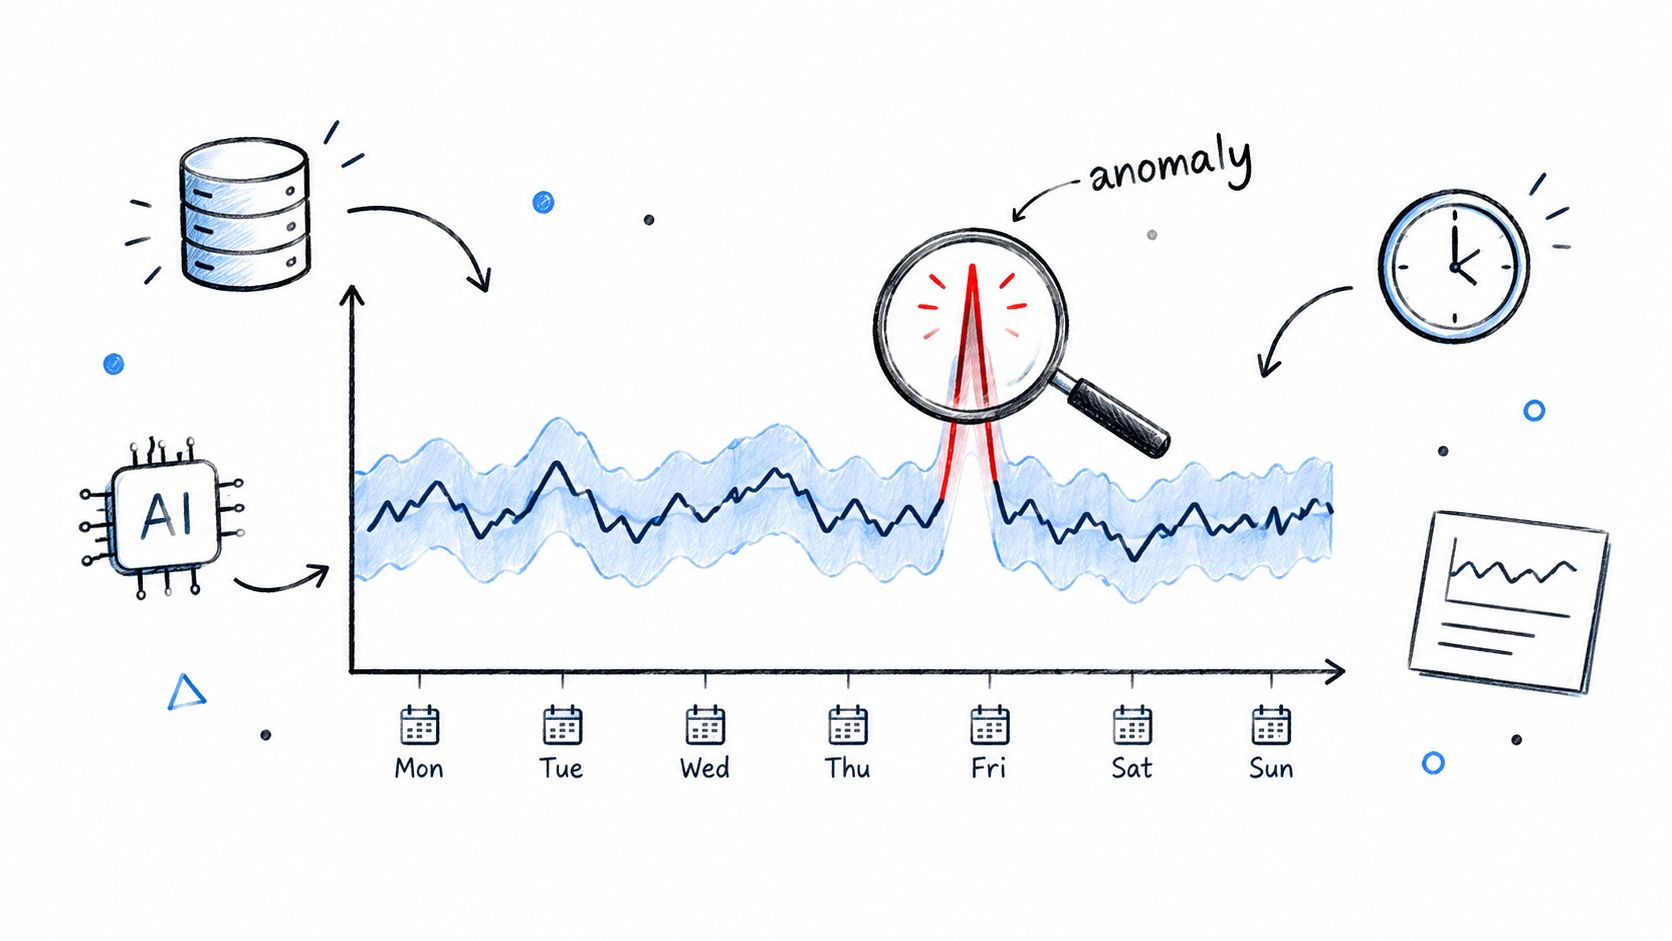
AI-driven anomaly detection looks for behavior that departs from a dataset's normal pattern. Instead of forcing engineers to write a threshold for every table, the system learns a baseline from historical volume, distributions, categories, or other observability metrics. That makes it useful for datasets with seasonality, growth, irregular demand, or relationships too complex for a fixed rule.
digna's Data Anomalies module is designed for this type of monitoring. In a financial environment, an unexpected fall in transaction volume can appear before a reconciliation failure. In healthcare, an unusual patient admission pattern or lab-result distribution may warrant investigation. In telecommunications, a change in network traffic can indicate service degradation or unusual usage. These are detection signals, not automatic proof of a business problem, so an owner still needs to validate the cause.
Make the baseline explainable
Collect enough representative history before treating alerts as actionable. A new dataset, an acquisition, a product launch, or a source migration can make an old baseline misleading. Add business context such as calendar events, planned campaigns, and source ownership, then review early alerts with domain experts to tune sensitivity.
Practical rule: Use anomaly detection to find what rules weren't written to anticipate, then use deterministic validation to prove what failed.
digna's anomaly detection for categorical data is particularly relevant where a change in category mix matters more than a simple row count. Teams can combine this approach with Wisely AI solutions when broader AI implementation support is needed.
2. Record-Level Data Validation Against Business Rules
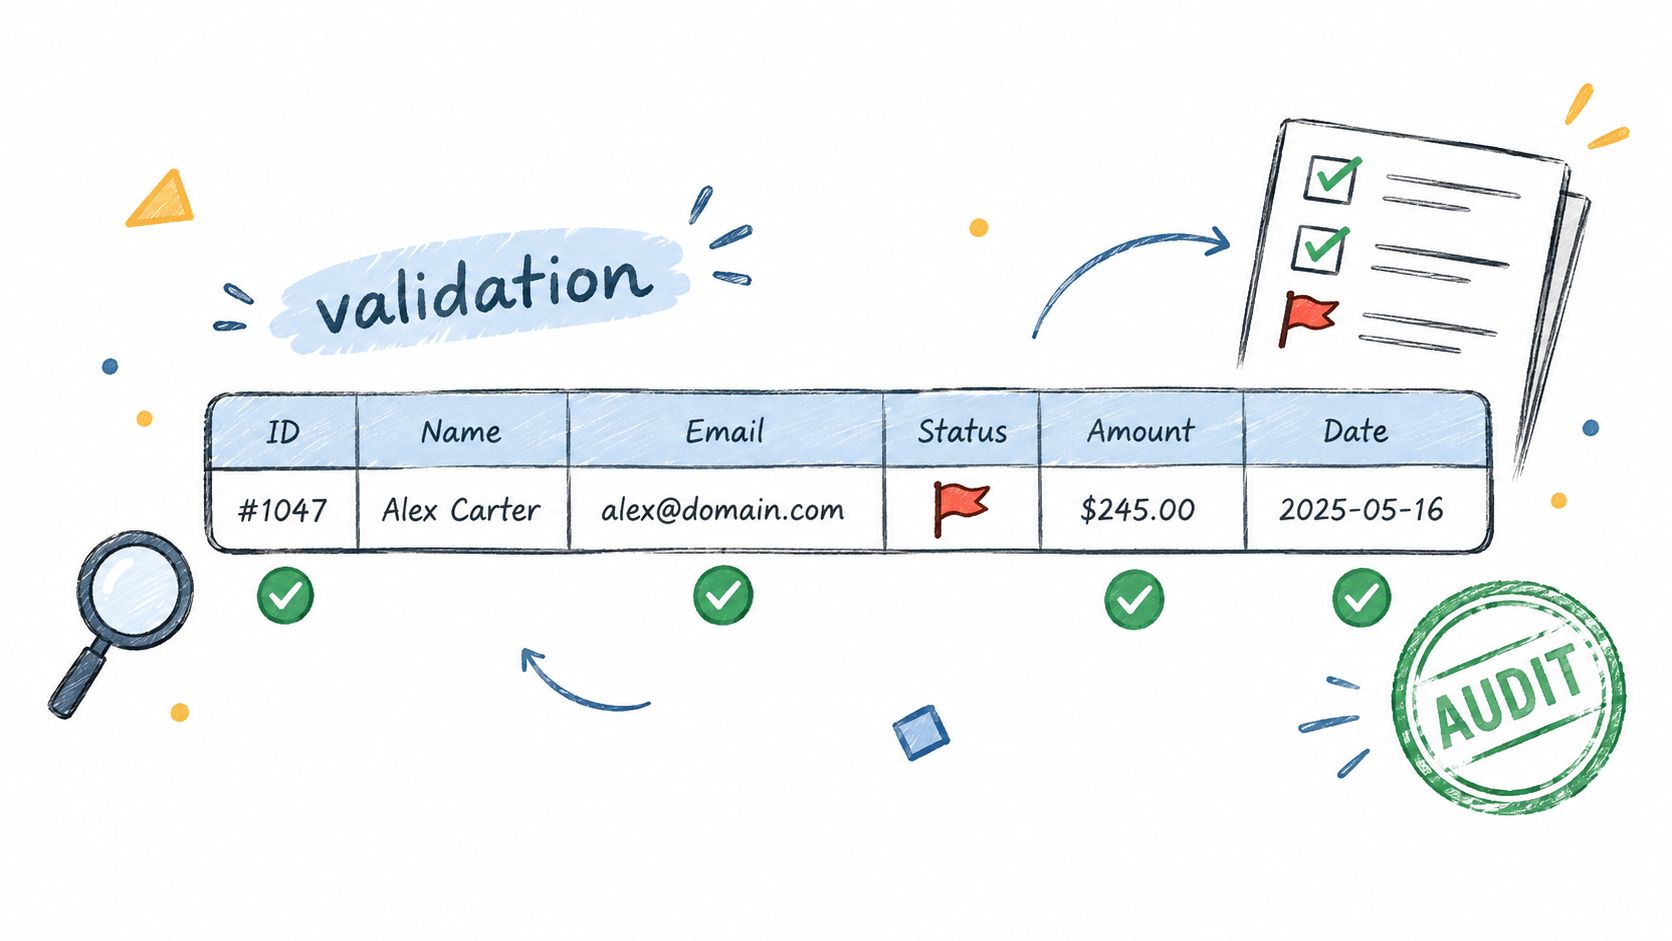
Record-level validation answers a precise question: does this row satisfy the rules that make it usable? It checks individual records against required fields, accepted values, ranges, formats, relationships, and business logic. Unlike an aggregate anomaly signal, it can identify the exact record, rule, and result that require remediation.
Common rule types include not-null, uniqueness, data type, range, format, referential integrity, and business logic checks. Data validation guidance describes how teams enforce these controls through database constraints, schema validation, and automated tests. A financial institution might validate transaction limits and counterparty requirements. A healthcare system may check patient identifiers and diagnosis codes. A public agency may verify license information or benefit eligibility fields.
Make failures traceable
Don't begin by validating every field equally. Prioritize records that affect regulatory reporting, payments, clinical decisions, customer identity, or executive KPIs. Business owners should define what “valid” means, because a technically acceptable value may still violate an operational policy.
Version the rules and retain pass or fail evidence. That allows engineers to distinguish a source defect from a deliberate policy change and gives governance teams an audit trail.
digna's data validation rules and continuous data quality supports custom validation logic with in-database execution and traceable rule results. The trade-off is maintenance. Rules are reliable for known conditions, but they won't detect an unfamiliar shift unless someone expresses that shift as a rule or pairs validation with anomaly detection.
3. Timeliness and Data Arrival Monitoring with Expected Delivery Time Calculation
A dataset can be complete and valid yet still be unusable because it arrived too late. Timeliness monitoring compares actual arrivals with expected delivery behavior, identifying delayed loads, missing files, early arrivals, and gradual deterioration in source performance. It protects dashboards, downstream models, reconciliations, and operational workflows that depend on data being available at a particular time.
A banking team might use a timeliness monitor to detect a missing overnight batch before morning reporting. A healthcare organization can investigate delayed patient information before it disrupts coordination. A telecom operator may track whether usage or billing data reaches its destination within the expected window. digna's Timeliness module calculates expected delivery time from observed patterns rather than treating every source as if it followed the same schedule.
Separate delay from absence
One monitor shouldn't serve sources with different delivery rhythms. Create expectations per source, table, or workload, and connect alerts to the incident-management and on-call process. An alert that sits in a dashboard without an owner is only a delayed discovery mechanism.
Pair arrival monitoring with volume monitoring. A file that arrives on time with no records is a different failure from a file that contains the expected volume but arrives late. Track the delivery pattern over time too, because a pipeline that slips gradually may need attention before it misses a formal deadline.
The data timeliness definition and monitoring guidance provides a useful framework for distinguishing freshness, delivery expectations, and operational response. The main trade-off is alert strictness. Fixed windows are easy to explain, while learned expectations adapt better to real operations but need review when schedules change.
4. Schema Change Detection and Structural Monitoring
Schema drift creates failures that row-level checks may never see. A vendor can add a field, remove a column, change a data type, or alter a constraint while still sending records that look individually plausible. Downstream transformations, reports, and models may then fail loudly, or worse, continue with a changed interpretation.
Schema monitoring compares incoming structure with an approved contractual baseline. It can quantify change through measures such as column mismatch rate or a composite schema similarity score, making structural changes suitable for automated alerting. Schema drift metrics describe this approach to measuring structural deviation rather than treating every change as equally severe.
Put impact behind the alert
An added optional column may be low risk. A removed identifier or type change in a regulatory feed may require a hard stop. Document table dependencies so the alert can identify affected ETL jobs, semantic models, dashboards, and data products instead of sending engineers to investigate blindly.
digna's schema drift explanation describes the operational risk of unannounced structural change. Its Schema Tracker can detect added or removed columns and data-type modifications. Pair detection with a change-approval process and automated compatibility tests. Monitoring alone tells you that structure changed. Governance determines whether the change is allowed, quarantined, or escalated.
5. Statistical and Trend Analysis of Data Metrics
Statistical analysis examines how quality and business metrics behave over time. It can reveal gradual drift, changing volatility, unusual distributions, and patterns that a single pass or fail rule misses. Moving averages, standard deviation analysis, and trend decomposition are useful choices, but the method must match the metric. A continuous measure, a categorical distribution, and an event count don't have the same statistical behavior.
A finance team might analyze revenue volatility, while a healthcare organization studies admission rates, treatment volumes, or outcome measures. A telecom team can watch for a gradual rise in call abandonment or a changing churn pattern. digna's Data Analytics module is intended for historical analysis of observability metrics and business behavior, helping teams investigate whether a change is isolated or part of a trend.
Use representative history
A baseline built from an abnormal period can produce poor conclusions. Exclude known outages, migrations, and exceptional events when they don't represent normal operation, or annotate them so analysts can interpret the result correctly. Domain expertise remains essential because statistical unusualness isn't the same as business incorrectness.
For anomaly alerts, confidence intervals and rolling deviation rules can offer more defensible boundaries than arbitrary fixed limits. One documented approach alerts when a metric moves outside the 99% confidence interval for the same day last year, or when it exceeds 3 standard deviations from a rolling average. Statistical anomaly detection examples illustrate these techniques.
The trade-off is interpretability. Statistical methods detect patterns efficiently, but teams need clear explanations and event context before blocking a pipeline or escalating to executives. See digna's data trend analysis for a related analytical approach.
6. In-Database Metric Computation and Analysis
Quality monitoring doesn't require exporting production data to an external service. In-database execution computes metrics, runs checks, and performs analysis inside the customer's warehouse, lake, or database. That architecture reduces data movement and supports governance requirements where sensitive records must remain inside the organization's infrastructure.
A financial institution can run compliance validation against regulated data without copying it elsewhere. A healthcare organization can assess patient-data quality while keeping protected information in its controlled environment. digna executes anomaly, validation, timeliness, and related checks within customer databases, so the monitoring layer can inspect data without taking ownership of the underlying records.
Protect performance as well as privacy
In-database execution shifts responsibility to the database environment. Monitoring queries need appropriate permissions, preferably read-only access, and they must be designed so that quality checks don't compete with production workloads. Schedule expensive profiling or historical analysis during lower-demand periods, then measure query runtime and resource use as part of the monitoring design.
Keeping data in place reduces exposure, but it doesn't remove the need for access control, query governance, and performance testing.
The trade-off is portability and operational complexity. A check that works well in one warehouse may need optimization in another, particularly when table sizes, partitioning, or workload patterns differ. Teams should test query plans, use incremental computation where appropriate, and monitor the monitoring workload itself.
7. Business KPI and Operational Metric Monitoring
Technical quality signals matter because they affect decisions and operations. Business monitoring connects underlying data to metrics such as revenue, transaction volume, customer activity, conversion, treatment outcomes, churn, or network availability. An unexpected KPI change can expose a data problem before a technical owner notices a failed test, while a technically healthy pipeline can still produce a business result that needs investigation.
A financial team may see an unexpected revenue or transaction-volume change. A healthcare provider might monitor admission volumes and operational outcomes. A telecom operator could track churn, average revenue per user, or network availability. These are not automatically data defects. A real market event can produce a real KPI movement, which is why business monitoring should initiate investigation rather than declare causation.
Agree on escalation before the alert
Choose the most decision-critical metrics and define expected behavior with their owners. Record who receives an alert, what evidence they need, and when the issue becomes a business incident. If the KPI moves, trace it backward through freshness, volume, schema, validation, source, and platform signals.
Business metrics are also useful for prioritization. A failed check on an unused development table shouldn't compete with a smaller defect that affects a regulatory report. The strongest setup links KPI anomalies to lineage and technical context, allowing analysts and engineers to investigate the same incident from different views.
digna's Business Monitoring combines business and operational metric analysis with the broader quality signals needed for root-cause analysis. The practical trade-off is ownership. Business teams must help define meaning and materiality, or engineers will be left guessing which changes matter.
8. Data Platform and Workload Observability
Dataset checks can show that data is wrong. Platform observability helps explain why. It watches workload behavior, resource consumption, availability, query performance, job duration, and changes in the infrastructure that moves and stores data. This systems-level view catches failures that aren't visible in an individual table.
An ETL job may take longer because a warehouse is under pressure. A sudden workload spike may reveal duplicated pipelines or an inefficient transformation. A platform change can affect many datasets at once, even when each table's last validation run passed. These signals help teams separate a source defect from a capacity problem, configuration change, or workload imbalance.
Correlate, don't collapse signals
Establish normal platform behavior, then correlate deviations with data-quality incidents. If multiple freshness alerts begin after resource consumption rises, platform telemetry can direct the investigation toward infrastructure. If one source changes while platform health remains stable, the source or transformation deserves closer attention.
Keep platform incidents distinct from data defects. A slow query isn't automatically bad data, and a valid table doesn't prove that the platform is healthy. Separate ownership can improve response, provided the incident system preserves the relationships between workload, pipeline, dataset, and business impact.
digna's Data Platform Observability monitors platform health, workload behavior, consumption, availability, and performance-related signals. The trade-off is breadth. More telemetry can produce more noise, so teams should define which platform changes require immediate action and which belong in capacity planning or engineering review.
9. Comprehensive Data Observability Dashboards and Collaborative Monitoring
A control that only one specialist can interpret won't scale across a data organization. Collaborative monitoring brings validation results, anomaly signals, timeliness, schema changes, KPIs, platform health, ownership, and incident history into shared operational views. Data engineers need technical details, analysts need metric context, governance teams need evidence, and leaders need a concise view of reliability and impact.
The dashboard should adapt to those decisions rather than display every available metric by default. An engineer may need the failed rule, source partition, query, and lineage. An analyst may need the affected KPI, freshness state, and business definition. A governance lead may need the owner, resolution history, and evidence that a control ran as expected.
Reduce alert fatigue deliberately
Group related alerts into incidents, suppress duplicates, and show the highest-value signal first. Add drill-down views for investigation, but keep the default screen focused on what needs action. Feedback from users is an operational control in its own right. If teams routinely dismiss a category of alert, change the threshold, routing, or control design.
Integrate the dashboard with team communication and incident-management tools. Assign owners to datasets and rules, record remediation steps, and retain the decision trail. That turns a visualization layer into a collaboration system.
digna provides a user-centric dashboard for engineers, analysts, and stakeholders, with shared visibility into incidents, trends, and status. The trade-off is governance of the dashboard itself. Without clear definitions and ownership, a centralized view can become a crowded catalogue of unresolved signals rather than a decision tool.
10. Modular Quality Control Architecture with Rapid Deployment
The most effective data quality program usually grows in layers rather than arriving as one large implementation. A modular architecture lets a team begin with the failure mode causing the most harm, prove that the control works, and add adjacent coverage without replacing the operating model. A finance organization might start with validation and anomaly detection, then add timeliness and schema monitoring. A healthcare team might begin with quality management and later connect clinical outcome metrics. A telecom operator might establish platform observability before expanding into record-level controls.
Sequence controls by risk
Start with a data-quality assessment that identifies critical datasets, consumers, owners, and known incidents. Select the first module based on evidence, not on whichever feature is easiest to demonstrate. A missing-load problem calls for timeliness monitoring. A broken vendor feed calls for schema tracking. An incorrect eligibility field calls for record validation.
Plan an expansion roadmap over 6 to 12 months, with milestones tied to coverage and remediation rather than installation alone. Secure data-governance sponsorship, assign internal integration capacity, and use industry-specific templates only as starting points. Early wins should fund broader adoption, not become isolated demonstrations.
Build for coverage: Add controls that expose different failure modes, not three versions of the same test.
digna's modular platform includes a scheduler, data catalogue, integrations, and collaboration features from the initial module selection. Its deployment options include private cloud and on-premises installation inside a customer's cloud, VPC, or data center. The trade-off is discipline. Modular licensing and deployment can lower the barrier to adoption, but teams still need a shared control model, consistent ownership, and a clear rule for when an alert becomes a remediation task.
10-Point Comparison: Data Quality Control Methods
Method | Implementation Complexity 🔄 | Resource Requirements ⚡ | Expected Outcomes 📊 | Ideal Use Cases 💡 | Key Advantages ⭐ |
|---|---|---|---|---|---|
AI-Driven Anomaly Detection with Baseline Learning | Moderate–High; requires ML pipelines and model ops | Medium–High; needs historical data and compute | High ⭐⭐⭐; detects novel & subtle deviations early | Complex time-series, seasonal business metrics | Adaptive baselining; fewer false positives |
Record-Level Data Validation Against Business Rules | Low–Medium; rule authoring and maintenance | Low–Medium; rules engine and business input | High ⭐⭐⭐; deterministic pass/fail with audit trails | Regulatory compliance, transactional integrity | Traceable violations; precise remediation targets |
Timeliness and Data Arrival Monitoring with Expected Delivery Time Calculation | Low–Medium; scheduling + pattern learning | Medium; historical arrival logs and integration | High ⭐⭐⭐; fast detection of delayed/missing loads | ETL pipelines, SLA-critical data deliveries | Predictive alerts for pipeline failures |
Schema Change Detection and Structural Monitoring | Low; continuous schema tracking & mapping | Low–Medium; metadata and dependency catalog | High ⭐⭐⭐; prevents breaking downstream failures | Vendor feeds, ETL jobs, schema-sensitive systems | Real-time structural alerts and version history |
Statistical and Trend Analysis of Data Metrics | Medium; statistical models and interpretation | Medium; historical metrics and analyst time | High ⭐⭐⭐; trend insights and early warning signals | Aggregate business metrics, volatility detection | Contextual statistical insight; detects gradual shifts |
In-Database Metric Computation and Analysis | Medium; DB-specific queries and optimizations | Low–Medium; leverages existing DB resources | High ⭐⭐⭐; secure, real-time checks with low movement | Sensitive data environments, compliance-centric orgs | Data residency preserved; reduced data movement |
Business KPI and Operational Metric Monitoring | Medium; KPI definition, mapping and dashboards | Medium; stakeholder input and BI tooling | High ⭐⭐⭐; links data issues to business impact | Executive dashboards, OKR tracking, ops monitoring | Connects data quality to business outcomes |
Data Platform and Workload Observability | High; integrates multi-component telemetry | High; platform telemetry, logs, and tooling | High ⭐⭐⭐; holistic platform health and cost insights | Platform ops, capacity planning, cost optimization | Detects infrastructure issues affecting many datasets |
Comprehensive Data Observability Dashboards and Collaborative Monitoring | Medium–High; UX, role views and integrations | Medium; cross-team adoption and tooling | High ⭐⭐⭐; faster incident response and alignment | Cross-functional teams needing shared context | Centralized view; reduces silos; role-based insights |
Modular Quality Control Architecture with Rapid Deployment | Low–Medium initial; planning for modular expansion | Low initial; scales with modules (pay-per-table) | High ⭐⭐⭐; quick time-to-value and iterative rollout | Phased adoption, industry templates, rapid pilots | Rapid deployment; incremental expansion; lower upfront risk |
Build a Control Stack, Not a Checklist
The right data quality control methods depend on the failure you need to catch. Record validation is the strongest first response when the requirement is explicit, such as a non-null identifier, an allowed value, a valid range, a matching reference, or a business rule that must hold for every record. It produces concrete evidence and supports targeted remediation, but it can't recognize every unfamiliar pattern.
Anomaly detection and statistical analysis cover behavioral change. Baseline learning is useful when normal behavior varies with seasonality, growth, or category mix. Statistical analysis helps teams understand trends, volatility, and distribution changes across time. Neither approach should automatically block data without context. A legitimate campaign, acquisition, migration, or operational event can look abnormal, so owners need a way to explain and approve expected changes.
Timeliness monitoring addresses delivery reliability. It tells teams that a source arrived late, arrived early, or didn't arrive when expected. Pair it with volume checks to distinguish a missing load from an empty or partial load. Schema tracking handles structural drift, including added or removed columns and data-type changes. Severity should depend on downstream dependencies. A harmless extension and a breaking identifier change shouldn't receive the same response.
Architecture matters when governance, privacy, or residency constraints limit data movement. In-database execution allows teams to compute metrics and run checks where the data already lives, while still requiring access control, query optimization, and workload monitoring. The control stack also needs context. Business monitoring shows whether a technical change affects revenue, transactions, operations, clinical outcomes, or another decision metric. Platform observability helps identify resource, workload, availability, and performance conditions that may explain the incident.
The operational layer determines whether detection leads to improvement. Assign owners to critical datasets, document business definitions, connect alerts to incident management, and retain pass or fail evidence with the rule version that produced it. Use hard-fail controls for violations that make downstream use unsafe, and soft anomaly alerts where investigation is required before action. Set conformance thresholds for explicit controls, and use confidence intervals or learned baselines where behavior changes over time.
A sensible rollout starts with critical datasets rather than the whole estate. Map their consumers and failure history, select the first control for the highest-risk gap, and agree on an owner and response path before enabling alerts. Then add complementary methods, such as validation with timeliness, anomaly detection with schema monitoring, and business metrics with platform telemetry. digna can support that modular approach through data anomalies, validation, timeliness, schema tracking, in-database execution, business monitoring, and platform observability.
The program should expand when teams can show that controls run consistently, incidents reach the right owner, and remediation improves the upstream process. That is how data quality becomes operational infrastructure instead of a periodic audit or a long checklist that nobody revisits.
digna provides an enterprise data quality and observability platform that runs inside the customer's environment, combining validation, anomaly detection, timeliness, schema, business, and platform monitoring. Use it to build complementary control layers around critical datasets, then explore the modular platform through digna and plan your first deployment around the failure mode that matters most.
If you are deciding which layer to put in place first, the digna data quality management solution shows how validation, anomaly detection, timeliness and schema tracking run as separate modules inside your own database, so you can start with one control and add the rest as coverage grows.
Frequently asked questions
What are the main data quality control methods?
The main methods are anomaly detection, record-level validation, timeliness monitoring, schema change detection, statistical trend analysis, in-database computation, KPI monitoring, platform observability, shared dashboards and a modular rollout. Each catches a different failure mode, which is why the post recommends stacking them as complementary layers instead of relying on one rule set.
What is the difference between data validation and anomaly detection?
Validation proves a specific row broke a known rule, while anomaly detection flags behavior that departs from a learned baseline. Rules give you the exact record and an audit trail but miss unfamiliar shifts, such as a legitimate-looking volume collapse. The practical pattern is to find the unexpected with anomalies, then prove failures with validation.
How do you set thresholds for statistical data quality alerts?
Use confidence intervals or rolling deviation rules rather than arbitrary fixed limits. One documented approach alerts when a metric falls outside the 99% confidence interval for the same day last year, or moves more than 3 standard deviations from a rolling average. Exclude outages and migrations from the baseline history first.
Why monitor data timeliness if the data is already validated?
Because a dataset can be complete and valid yet still useless if it arrives after the morning report runs. Timeliness monitoring compares actual arrivals with expected delivery times per source, and pairing it with volume checks separates a late file from one that arrived on time but empty.
Where should a team start when rolling out data quality controls?
Start with a data-quality assessment of critical datasets, then pick the first control for the highest-risk gap: timeliness for missing loads, schema tracking for broken vendor feeds, validation for incorrect fields. The post suggests planning expansion over 6 to 12 months, with milestones tied to coverage and remediation.


