Data Profiling Meaning: Techniques, Uses, Observability
|
5
min read

Data profiling means examining, analyzing, and summarizing data before you use it, typically through four operational methods and by generating statistics such as minimums, maximums, means, standard deviations, frequencies, and null occurrence rates. In practice, it's the discipline that tells you whether a dataset is structurally sound, logically plausible, and fit for analytics, reporting, or AI.
You're probably here because some dataset already betrayed you. A dashboard changed without warning. A join stopped matching. An ML feature table looked fine yesterday and suspicious today. Nobody touched the BI layer, yet business users are asking why weekly revenue, lead counts, or service volumes suddenly look wrong.
That's where the real data profiling meaning starts. It isn't just a glossary definition. It's the process of examining, analyzing, and creating useful summaries of data so teams understand its quality, structure, and content before it's used in a project. In older projects, that often meant a one-time scan before loading data into a warehouse. In modern platforms, that snapshot alone doesn't hold up for long.
The painful failures usually aren't dramatic. They're quiet. An upstream team changes a field type. A source starts sending blanks where it used to send values. A foreign key relationship begins producing orphaned records. The pipeline still runs, the table still refreshes, and the chart still renders. But trust drops immediately once users spot the inconsistency.
Engineers often treat profiling like setup work. Analysts often see it as a data quality report. Both views are too narrow. Profiling is the first factual inspection of a dataset, and in mature teams it becomes part of an ongoing observability loop that keeps pipelines reliable after release, not just before it.
Table of Contents
Introduction When Good Data Goes Bad
The weekly sales dashboard refreshes on schedule. Nobody gets an error. The charts load fast. Then someone in finance notices that one region has collapsed while another has doubled. The team loses half a day checking SQL, then the ETL job, then the BI model, before pinpointing the underlying cause: an upstream source changed a field format and inadvertently broke a transformation assumption.
That kind of incident is why data profiling matters. It gives teams an evidence-based view of what's in the data, not what everyone assumes is there. Instead of waiting for a broken report to reveal the issue, profiling surfaces mismatched formats, missing values, duplicates, and relationship problems earlier.
Why trust breaks so quickly
Trust in data systems is fragile because users judge the whole platform by the last strange number they saw. One bad report doesn't just create one ticket. It makes every future dashboard slightly less believable.
Practical rule: If a business metric surprises people, inspect the data before you inspect the visualization.
In production environments, data rarely fails in a clean way. Pipelines often keep running while the meaning of the data shifts under them. That's why profiling shouldn't sit in a forgotten pre-launch checklist. It belongs close to ingestion, transformation, and monitoring, where engineers can see changes before downstream consumers do.
What profiling prevents
When teams profile early and revisit those findings continuously, they catch issues like:
Format drift: A date column starts arriving in a different pattern.
Semantic drift: A status code still looks valid syntactically but now carries a different business meaning.
Relationship failure: Records load into child tables without matching parent keys.
Completeness loss: A previously populated field starts arriving blank.
Most fire drills begin with one of those patterns. Profiling doesn't eliminate every problem, but it gives the team a factual baseline and a much faster path to root cause.
What Is Data Profiling Really
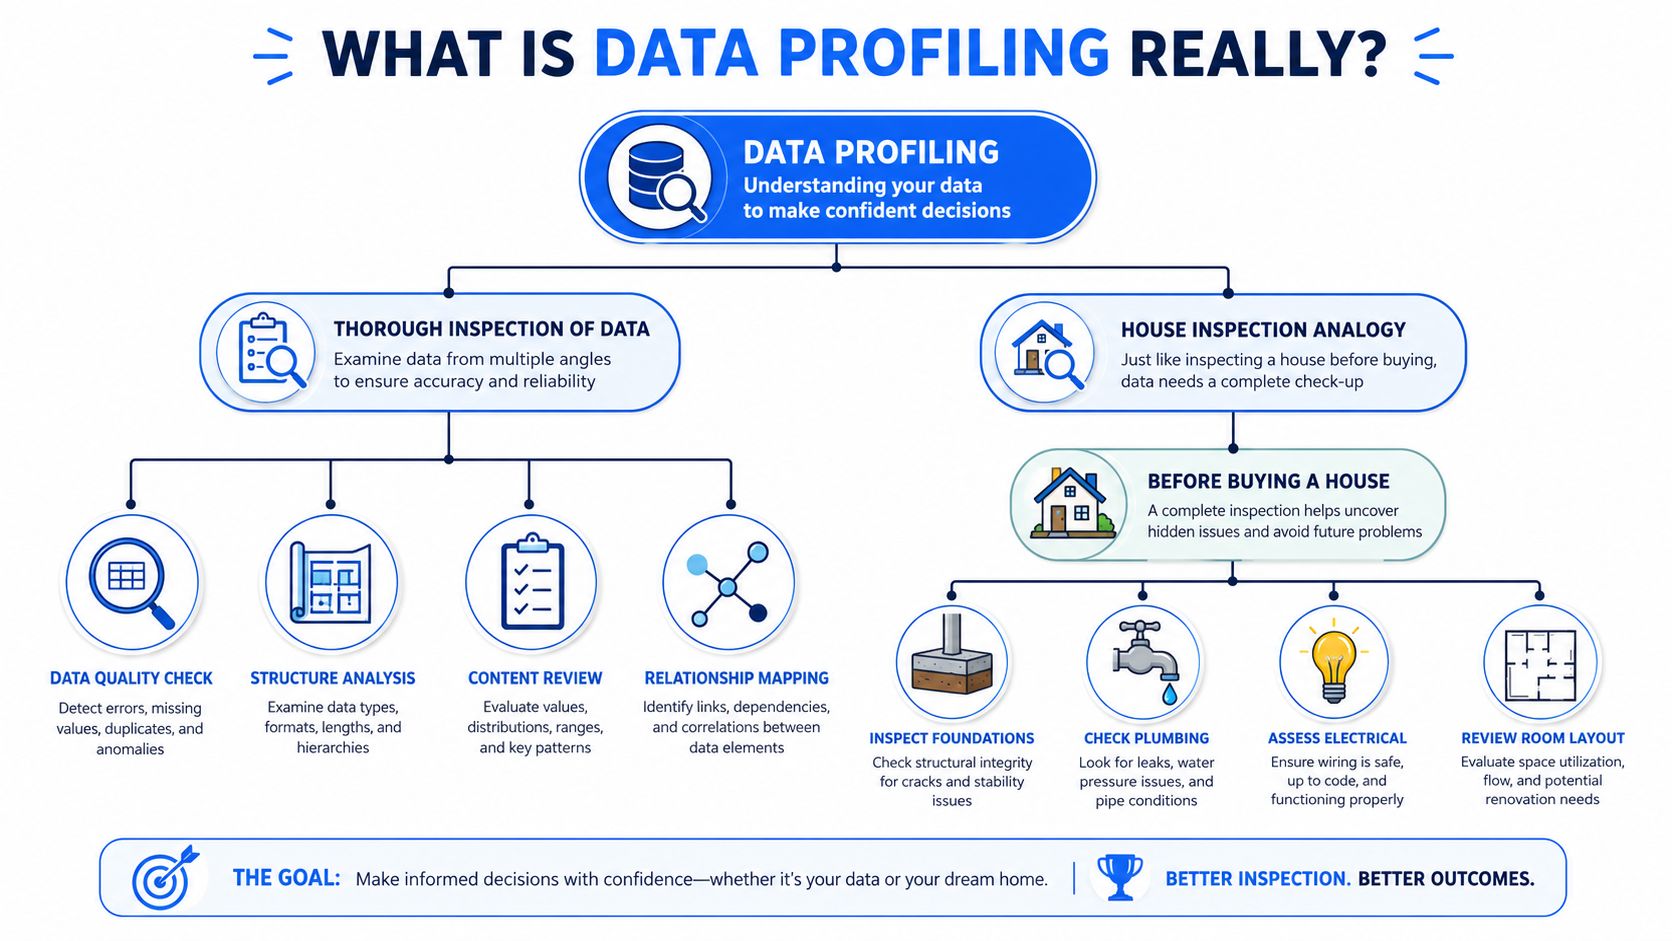
Data profiling is best understood as a thorough inspection of data before you depend on it. If you were buying a house, you wouldn't trust the listing photos alone. You'd inspect the foundation, plumbing, layout, and electrical system because each tells you something different about the property's condition. Data works the same way.
Why assumptions fail
A dataset can look usable from the outside and still be unreliable underneath. Column names may seem familiar. Row counts may look normal. But if values are malformed, keys don't match, or a field contains mostly defaults, the dataset can still mislead every model, report, and business decision built on top of it.
Ataccama puts this plainly: data profiling is the mandatory first step in any data initiative because it evaluates data for accuracy, consistency, and timeliness before processing starts, and without that analysis teams can't verify whether data is complete, correct, or ready for analytics or AI in the first place, as explained in Ataccama's overview of data profiling.
That's why profiling replaces assumptions with facts. It inspects the actual condition of the data before the warehouse load, the migration, the model training cycle, or the executive dashboard.
If your team is still working on upstream capture practices, it also helps to discover data gathering solutions that improve collection quality before records ever reach the pipeline.
The three kinds of discovery
The term data profiling meaning gets clearer when you break it into the three discovery categories practitioners use.
Structure discovery checks whether data is shaped the way you think it is. This includes formatting, data types, lengths, and the general arrangement of fields.
Content discovery checks whether the values themselves make sense. A field may be present and correctly typed, yet still hold invalid business content.
Relationship discovery checks how one dataset connects to another. It helps uncover foreign key issues, unmatched records, and broken joins.
A clean table isn't necessarily a trustworthy table. Trust comes from structure, content, and relationships lining up at the same time.
Those three views matter because most production issues don't stay isolated. A format change often creates content errors. A content issue often cascades into relationship failures. Profiling gives you a way to see those layers before consumers feel the impact.
Core Data Profiling Techniques and Metrics
If the conceptual definition feels abstract, the techniques make it concrete. Profiling becomes useful when it produces signals engineers can interpret and act on.
What the four methods actually do
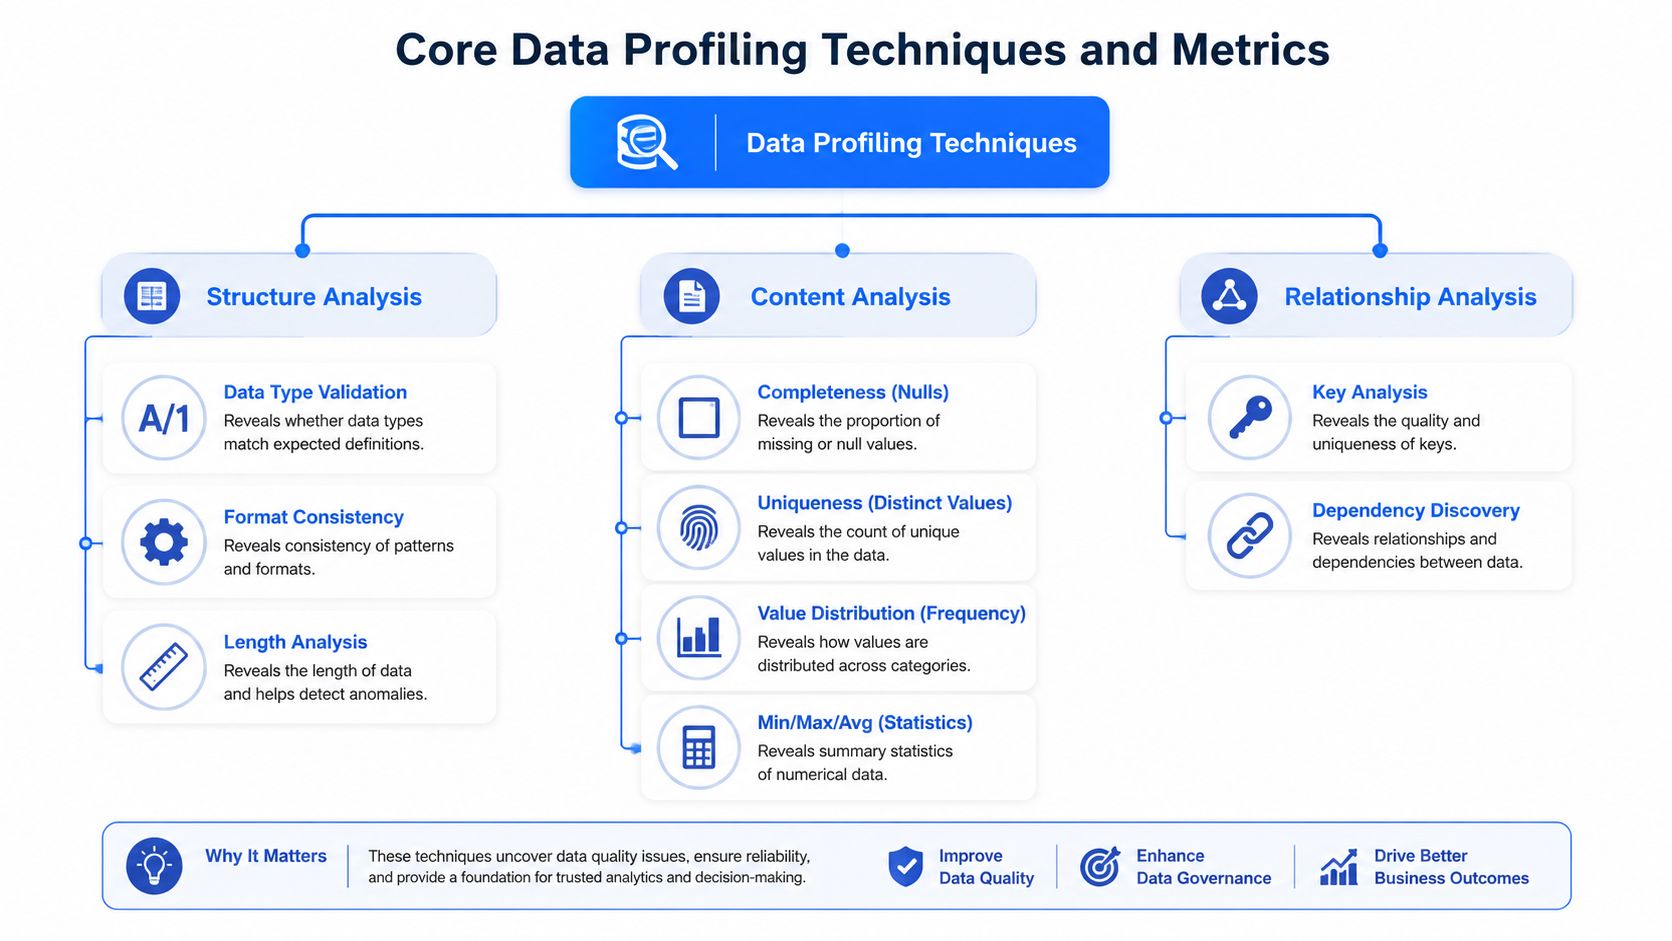
The operational side of profiling usually falls into four distinct methods: column profiling, cross-column profiling, cross-table profiling, and data rule validation. Those methods generate descriptive statistics such as minimums, maximums, means, standard deviations, frequencies, and null occurrence rates that help detect structural anomalies, as summarized in this technical overview of data profiling.
Here's how that plays out in practice:
Column profiling gives you the first pass on a single field. You look for nulls, data type mismatches, min and max values, common patterns, and uniqueness.
Cross-column profiling checks dependencies inside the same table. Two fields may be individually valid but contradictory together.
Cross-table profiling inspects referential integrity across datasets. It identifies orphaned records and join failures.
Data rule validation applies explicit conditions. It starts to overlap with formal validation, but it's still often used inside profiling workflows to test whether key assumptions hold.
How to read profiling metrics like an engineer
The numbers themselves aren't the point. Their interpretation is.
A minimum or maximum value can reveal impossible dates, invalid negative values, or identifiers that have been accidentally cast. A null rate tells you about completeness, but only in context. Some columns can tolerate blanks. Others can't. A frequency distribution reveals whether a field has healthy variation or whether one default value is swallowing the dataset.
A standard deviation is useful because it helps establish what normal spread looks like. When that spread shifts sharply, it may indicate a source-side change, bad parsing, or a semantic change in how the field is being populated.
Cardinality matters too, even when teams don't call it that. If a supposed unique identifier contains many repeated values, you may not have an identifier at all. If a category field suddenly explodes into unexpected variants, business definitions may have drifted.
For teams formalizing these checks, a practical next step is to define and track data quality metrics so profiling results don't stay stuck in ad hoc notebooks or one-off reports.
Metrics that usually reveal the first crack
When I review a new dataset, I don't treat every metric equally. A few checks consistently expose the first real issue:
Metric or check | What it often reveals |
|---|---|
Null occurrence rate | Missing required data, source extraction gaps |
Frequency distribution | Default values, skew, collapsed categories |
Min and max values | Out-of-range dates, impossible amounts, parsing errors |
Data type and length | Truncation, casting mistakes, inconsistent formatting |
Uniqueness | Duplicate keys, weak identifiers |
Cross-table key analysis | Orphaned records, broken joins |
Start with the metrics that break downstream logic fastest. Completeness, uniqueness, and referential integrity usually matter more than pretty summary stats.
Profiling becomes operationally useful when teams connect these signals to actions. A null spike in a comment field may be harmless. A null spike in customer ID is not. Good engineers don't just collect profiling output. They decide which deviations deserve intervention.
Common Use Cases and Hidden Pitfalls
Profiling proves its value when data moves from theory into delivery work. Warehouse builds, migrations, AI feature engineering, and operational reporting all depend on whether the source data is usable.
SAS describes profiling as a catalyst for confident decision-making because it surfaces completeness and accuracy across multiple sources and helps determine whether a dataset is suitable for a specific project goal before deployment, as outlined in SAS guidance on data profiling in big data environments.
Where profiling pays off
Some use cases benefit immediately from profiling, even before any advanced quality framework is in place.
Data warehouse and lake ingestion: Profiling helps teams understand what they're loading before bad assumptions get encoded into transformation logic.
Data migration: It helps compare source and target conditions so teams can spot corruption, truncation, missing keys, or changed distributions.
Analytics and BI: It reduces the odds that a dashboard becomes the first place someone notices a quality failure.
AI and ML preparation: It exposes odd distributions, unstable fields, and hidden inconsistencies that can distort model inputs.
Lead and funnel datasets are a good example. Teams designing qualification or routing logic often focus on workflow automation first, but the quality of inbound fields determines whether the automation is trustworthy. In that context, Formzz insights on lead automation are useful because they show how operational logic depends on consistently captured input data.
What teams get wrong
The first pitfall is treating profiling results as if they were complete validation. They aren't always. A statistical summary can tell you a field looks unusual. It can't always prove whether every record satisfies a business obligation.
The second pitfall is relying too heavily on sampling. Sampling is useful for speed and for broad pattern detection, but it can hide low-frequency failures that still matter operationally or contractually.
The third pitfall is running profiling once at project kickoff and never again. That works only in stable systems, and most systems aren't stable for long.
Silent drift is what hurts the most. The pipeline still runs, so nobody checks until a business user does.
A final pitfall is ignoring the business context around anomalies. A spike, outlier, or duplicate pattern isn't automatically a defect. Sometimes the data changed because the business changed. Profiling gives you the signal. Engineers and analysts still have to interpret whether that signal indicates error, evolution, or both.
Data Profiling vs Related Data Quality Concepts
A lot of confusion in data teams comes from using profiling, validation, anomaly detection, and schema tracking as if they mean the same thing. They don't. They work together, but each answers a different question.
A practical comparison
Bigeye notes that many definitions stop at profiling as a way to produce basic outlines, while modern platforms add record-level validation to enforce user-defined business logic. That's a different capability from traditional statistical profiling, which identifies broad patterns such as duplicates or outliers, as discussed in Bigeye's explanation of profiling versus validation.
Concept | Primary Goal | Method | Example Question Answered |
|---|---|---|---|
Data profiling | Understand structure, content, and general quality patterns | Statistical summaries, pattern checks, key analysis | What values exist in this column, how often are they null, and do they look structurally plausible? |
Data validation | Enforce business rules on records | Deterministic rule checks against each row or event | Does every order record contain a valid customer ID and required status? |
Anomaly detection | Flag unexpected changes relative to a baseline | Automated comparison against historical behavior | Did today's null rate, volume, or distribution move outside normal behavior? |
Schema tracking | Detect structural change | Monitoring of columns, types, and layout changes | Did a source add, remove, or modify a field that could break pipelines? |
That distinction matters a lot in regulated environments. If a team confuses statistical profiling with deterministic validation, they may think a sampled overview is enough for audit-sensitive processes when it isn't.
Why the distinction matters
Profiling answers, “What does this data look like?” Validation answers, “Does each record satisfy the rule?” Anomaly detection answers, “Did today change in a suspicious way?” Schema tracking answers, “Did the structure itself change?”
Those sound close, but they support different operating models.
Profiling is investigative.
Validation is enforceable.
Anomaly detection is adaptive.
Schema tracking is structural defense.
Teams also need to think about privacy and governance. When profiling touches personal data, retention and minimization expectations still apply. For governance teams reviewing this aspect, UK GDPR compliance advice helps frame why data minimisation should influence how much data is scanned, retained, and exposed in quality workflows.
The practical takeaway is simple. Don't ask one tool or one report to do every job. Use profiling to learn the data, validation to enforce rules, anomaly detection to catch change, and schema tracking to guard the contract between producers and consumers.
From Static Analysis to Continuous Observability
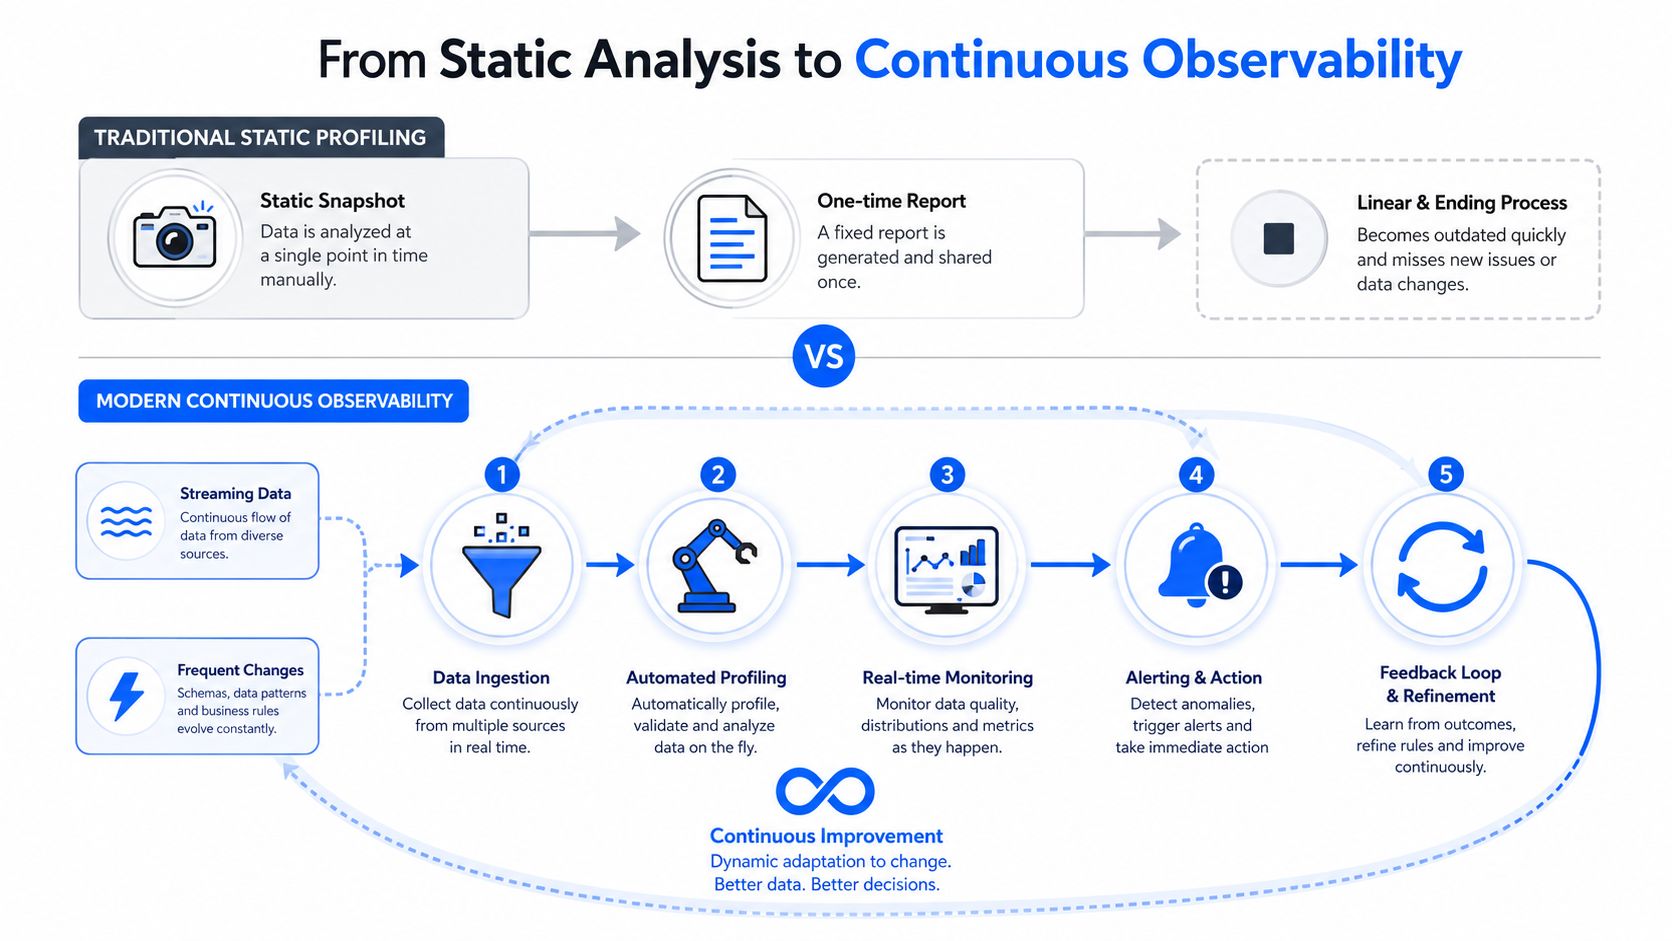
The old model of profiling treated it as a project phase. You inspected the data before relying on it, wrote up the findings, fixed obvious issues, and moved on. That made sense when source systems changed slowly and batch pipelines were relatively predictable.
Why one-time profiling breaks down
That model doesn't hold up in modern pipelines. TDWI points out that most content still frames profiling as a static, pre-use diagnostic step, which leaves a gap in explaining how teams should move to a continuous, automated observability loop that detects drift and schema changes in real time, and that gap leaves engineers without a framework to catch silent data drift, as described in TDWI's discussion of modern data profiling.
The problem isn't that static profiling is wrong. It's that it expires. Fast.
A profile tells you what the data looked like at inspection time. It does not guarantee that the same assumptions still hold after a source release, a parser update, a vendor feed change, or a new operational workflow.
What continuous profiling looks like
A modern operating model treats profiling as part of data observability rather than a one-off report. That means the team continuously measures key characteristics of the data and compares new behavior against a learned baseline.
In practice, continuous profiling usually includes:
Automated metric computation: Nulls, uniqueness, distributions, and key integrity are recalculated on an ongoing basis.
Schema change awareness: Column additions, removals, and type changes are monitored as production risks.
Timeliness checks: Freshness and arrival patterns are watched because late data can be just as harmful as wrong data.
Alerting tied to action: Engineers need signals that tell them what changed, where, and how severe it is.
For teams building that operating model, it helps to understand what data observability is and how it extends classic quality checks into continuous monitoring.
A profiling report is a snapshot. Observability is the camera that stays on.
This shift changes team behavior. Instead of waiting for an analyst to question a dashboard, engineers get notified when a baseline breaks. Instead of debating whether a source “seems fine,” they can compare current behavior to established historical patterns. That's a much better foundation for reliable analytics and AI.
How digna Enables Enterprise Data Profiling
Modern enterprise profiling needs more than a static statistics screen. It needs continuous measurement, structural awareness, and rule enforcement without forcing teams to move sensitive production data into yet another tool.
digna fits that model by combining in-database metric computation with modules that address different layers of the problem. Its anomaly detection capabilities learn normal behavior and flag unexpected changes. Its validation features handle record-level business rules. Its schema tracking catches added or removed columns and type modifications. Its timeliness monitoring watches data arrival patterns so stale or delayed loads don't go unnoticed.
That combination matters because enterprise teams rarely struggle with just one kind of failure. A warehouse table can be fresh but structurally changed. A schema can stay stable while values drift. A dataset can look statistically normal while violating a business rule at the record level.
The practical value of a platform like this is operational clarity. Engineers, analysts, and governance stakeholders can inspect trends, anomalies, timeliness, and schema movement in one place while keeping data in customer-controlled environments such as private cloud or on-prem deployments.
If your team wants to move from one-time inspection to continuous trust, digna is worth evaluating as part of that architecture. It gives data teams a way to combine profiling, anomaly detection, validation, timeliness monitoring, and schema tracking inside the customer environment, which is often the difference between finding issues early and finding them in a broken dashboard.
To keep profiling statistics such as null rates and distributions visible as trends over time rather than as a one-off snapshot, see digna Data Analytics.
Frequently asked questions
What does data profiling mean?
Data profiling means examining, analyzing and summarizing data before you use it, producing statistics such as minimums, maximums, means, standard deviations, frequencies and null occurrence rates. It tells you whether a dataset is structurally sound, logically plausible and fit for analytics, reporting or AI, replacing assumptions with facts.
What are the four data profiling methods?
The four operational methods are column profiling, cross-column profiling, cross-table profiling and data rule validation. Column profiling checks a single field for nulls, types and ranges; cross-column profiling finds contradictory fields in one table; cross-table profiling exposes orphaned records and broken joins; rule validation tests explicit conditions.
What are structure, content and relationship discovery?
These are the three discovery categories practitioners use to break profiling down. Structure discovery checks formats, data types and lengths; content discovery checks whether values make business sense; relationship discovery checks how datasets connect, uncovering foreign key issues and unmatched records. Trust requires all three to line up.
What is the difference between data profiling and data validation?
Profiling is investigative: it answers what the data looks like using statistical summaries and pattern checks. Validation is enforceable: it applies deterministic rules to each record, for example that every order has a valid customer ID. In audit-sensitive processes, a sampled profile is no substitute for record-level validation.
Why is one-time data profiling not enough?
A profile only describes the data at inspection time, and it expires quickly after a source release, parser update or vendor feed change. Continuous profiling recalculates nulls, uniqueness, distributions and key integrity on an ongoing basis and adds schema change awareness and timeliness checks, turning a snapshot into observability.


