10 BI Developer Tools for Reliable Analytics in 2026
|
7
min read

Most companies pick a single BI tool and hope it becomes the whole analytics stack. That advice falls apart fast. Reliable analytics usually depends on separate layers, transformation and modeling, reporting and semantic governance, observability and validation, and deployment workflows that keep data stable after the first dashboard ships. The market itself backs that up, the global Analytics and Business Intelligence software market reached $20.3 billion in 2024, grew 10% year over year, and is projected to reach $28.5 billion by 2029 at a 7% CAGR (market report). That scale explains why the toolset is broad, layered, and increasingly standardized around a few major platforms.
A better way to compare bi developer tools is to treat them as parts of a working stack, not isolated products. Some tools are strongest upstream, where developers shape models and metrics. Others are better at visual delivery, embedding, or governed self-service. And some sit underneath all of that, watching for drift, late data, broken schemas, or bad records before users ever see them. For teams that need quality monitoring inside their own environment, digna fits into that lower layer because it runs in private cloud, VPC, or on-prem and keeps production data in place.
The practical question is not “Which BI tool is best?” It's “Which combination gives us reliable delivery, reasonable governance, and a deployment model we can support?” For a quick stack comparison, compare tech stack options.
Table of Contents
1. digna
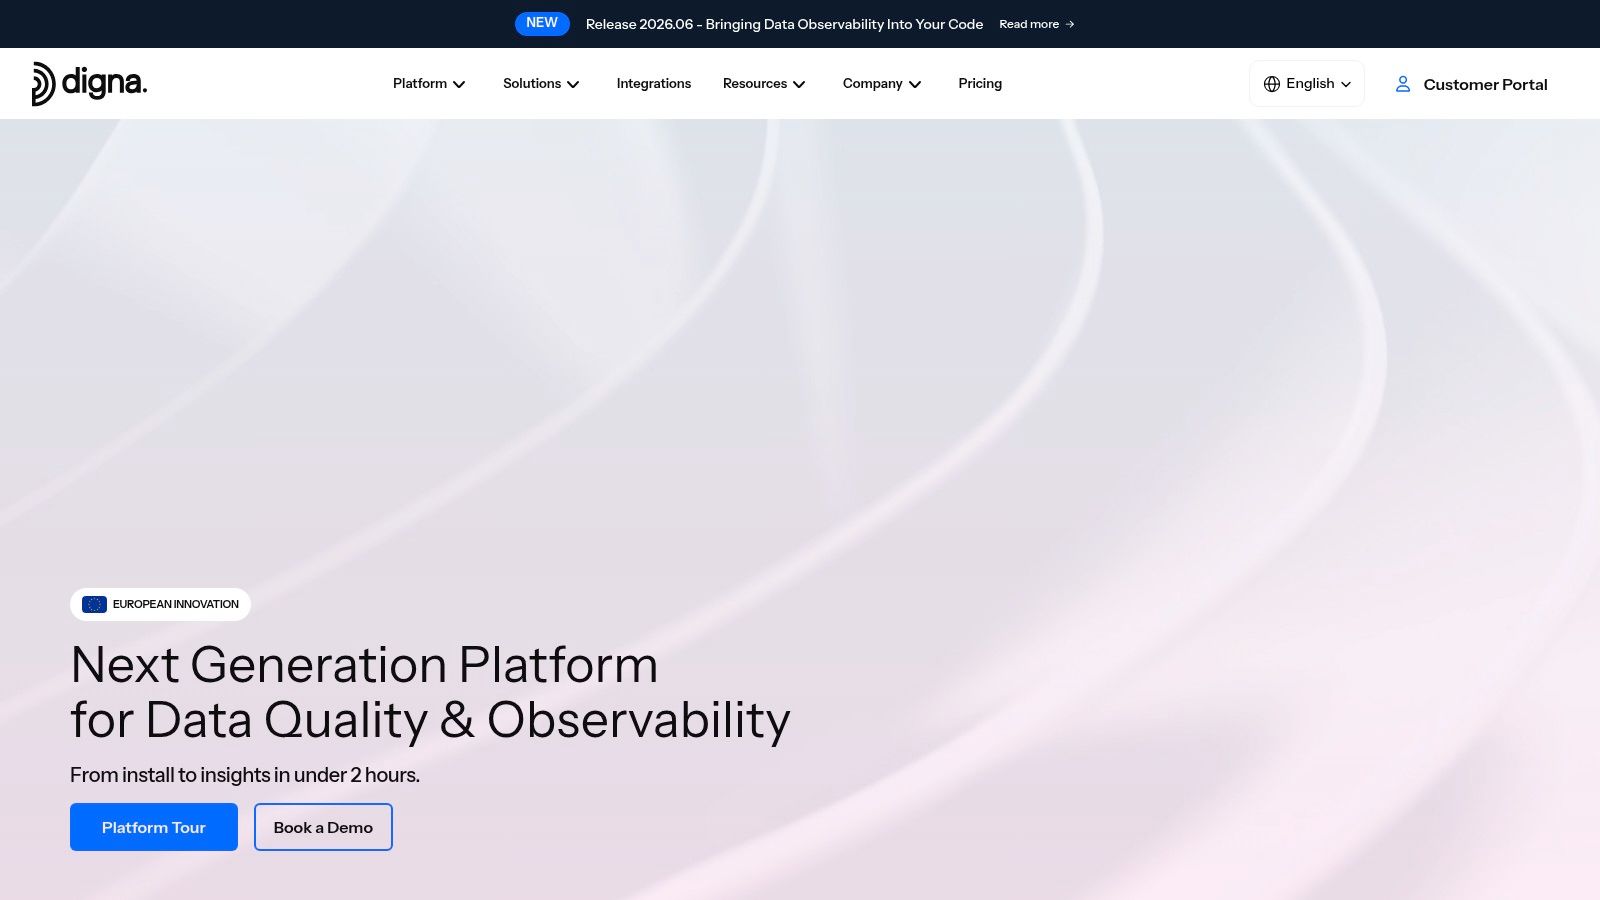
digna belongs underneath the dashboard, not beside it. It is the kind of platform BI teams reach for when reports keep breaking for reasons the front end can't explain, late loads, schema shifts, and subtle data changes that don't show up as obvious failures. Because it runs inside the customer's environment and executes checks in-database, it's built for teams that can't afford to move sensitive production data around just to inspect it.
Where it fits in a BI stack
digna is strongest when the problem is not chart design, it's data trust. Its modular setup, Data Anomalies, Data Analytics, Timeliness, Data Validation, and Schema Tracker, lets teams start with one reliability problem and expand as the stack matures. That matters in finance, healthcare, telecom, and the public sector, where BI developers often have to defend lineage, timing, and record-level correctness before anyone will act on a metric.
The operational advantage is the platform's in-database execution, which reduces data movement and aligns well with strict security reviews. The product also emphasizes a shared dashboard for engineers, analysts, and stakeholders, so incident review doesn't live in separate tools and separate narratives. In practice, that makes it easier to connect a broken KPI to the upstream dataset, the actual anomaly, and the remediation workflow.
Practical rule: use a BI front end to present insight, and use digna to stop unreliable data from entering that front end in the first place.
Trade-offs that matter
digna's biggest strength is also its biggest requirement, it wants customers who can support an internal deployment. Private cloud or on-prem gives teams control, but it also means the company owns infrastructure, capacity planning, and ops discipline. That is the right trade in regulated environments, but it's not as light as a managed SaaS monitoring layer.
The other constraint is commercial. Pricing is modular, with a base fee plus per active table per module, but the site doesn't publish list prices, so budgeting means getting a quote. For teams with many critical tables, that pricing model should be evaluated alongside the cost of incidents, not just the sticker price of the platform.
digna's website positions the platform as enterprise-ready, with active product development and a Vienna-based team, and the product page is the right place to start if your BI stack needs quality monitoring inside your own environment: digna.
2. dbt by dbt Labs
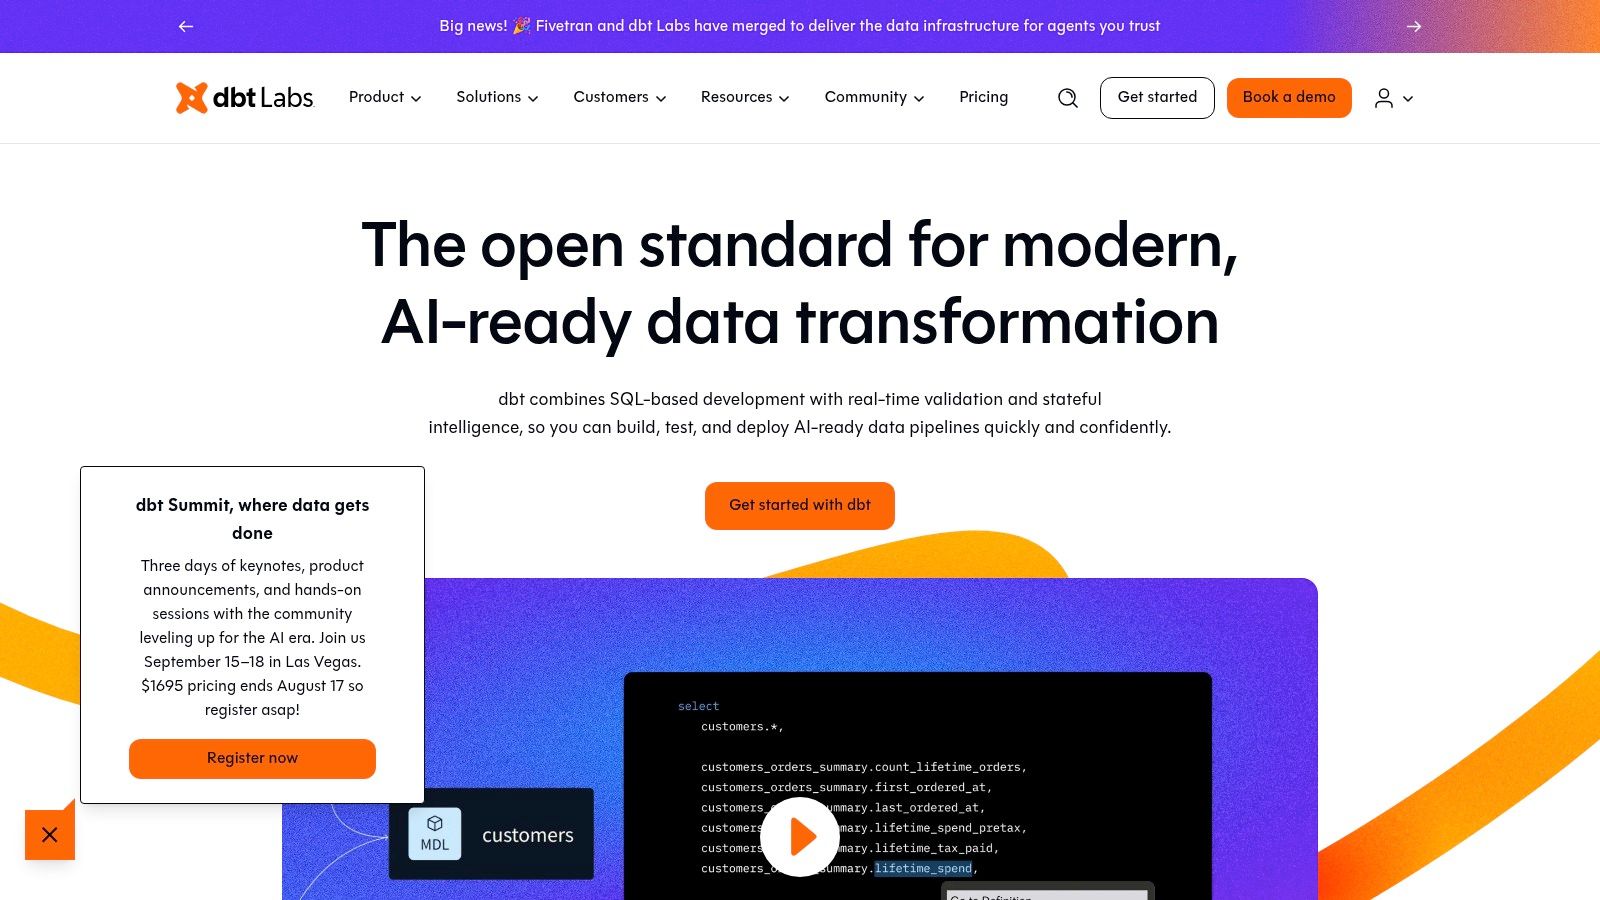
dbt is the cleanest answer when the team wants SQL-first modeling instead of scattered transformation logic. It turns analytics engineering into a software workflow, with git, testing, documentation, CI/CD, and orchestration patterns that feel familiar to developers. The strongest value shows up when BI logic moves upstream, away from dashboard tools and into reusable models.
Why developers keep choosing it
dbt works well because it treats transformations as code. That makes dependency handling, reviews, and repeatability much easier than custom scripts scattered across notebooks or ad hoc SQL jobs. Its Semantic Layer is especially useful for BI teams that want governed metrics upstream of the visualization layer, and its adapter ecosystem makes it flexible across modern warehouse and engine choices.
The workflow is strongest for teams with disciplined SQL habits. If analysts and engineers can agree on model naming, test coverage, and ownership, dbt reduces tool sprawl and keeps business logic in one place. That's also why it pairs well with downstream BI tools that are better at consumption than transformation. For a deeper look at how the semantic layer changes the analytics handoff, see digna's dbt semantic layer page.
Where it falls short
dbt is not a reporting tool. It doesn't solve dashboard UX, stakeholder delivery, or embedded analytics on its own, so it has to sit beside something else. It also asks for modeling discipline, which can be a hurdle for teams that still want to write everything in raw SQL or have many non-SQL users contributing to analytics logic.
dbt pays off when the organization is ready to centralize metric definitions. If the team still argues over table names and ownership, the rollout will feel heavier than the sales pitch suggests.
3. Apache Superset
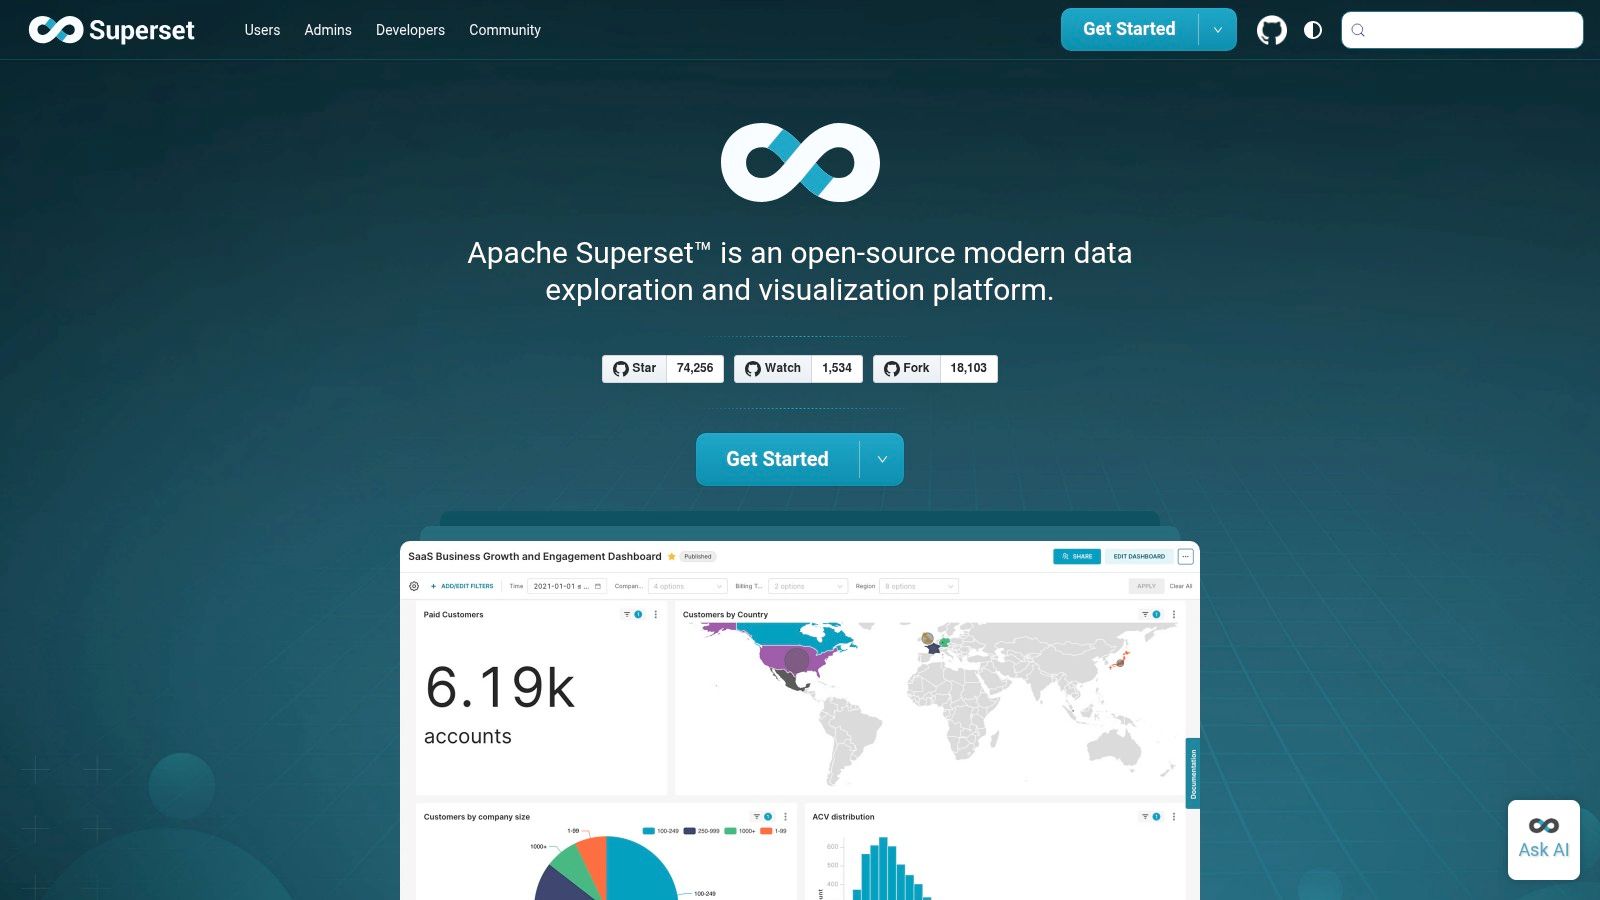
Apache Superset is the strongest option for teams that want an open, code-friendly BI layer they can own end to end. It combines a chart builder, SQL Lab, a lightweight semantic layer, and extensibility through plugins, so it works best where customization and self-hosting matter more than hand-holding.
What it does well
Superset fits teams that already have engineering capacity and want the BI layer inside their own infrastructure. It can run in a VPC, which is valuable for organizations that need data locality or internal network controls. The product is also broad enough to support many SQL engines, which makes it a practical fit for heterogeneous data estates.
The biggest technical advantage is flexibility. If a team needs custom front-end or back-end behavior, Superset gives them more room than a closed SaaS platform. That's useful for internal analytics portals, niche chart behaviors, or governance patterns that don't fit a default BI template. It also pairs naturally with warehouses, lakehouses, and internal catalogs when the BI team wants to own the deployment surface.
What it costs in practice
That flexibility comes with operational overhead. Superset is less turnkey than managed SaaS BI, and the team has to own upgrades, access rules, caching behavior, and governance patterns. It's a good trade for engineering-led organizations, but it can slow down smaller analytics teams that just want fast dashboards without an extra platform to manage.
Superset also demands more discipline around semantic definitions because the semantic layer is lighter than the systems some enterprise teams use. If metric governance is loose upstream, the BI layer will reflect that weakness instead of fixing it.
4. Lightdash
Lightdash makes the most sense for teams already standardized on dbt and tired of translating models into separate dashboard logic. It treats metrics as code, surfaces governed self-serve analytics, and supports alerting, scheduling, and embedding without forcing a separate semantic model to live elsewhere.

Why dbt-native teams like it
The appeal is consistency. If the dbt project already defines the model, the BI layer can stay close to that logic instead of rebuilding the same meanings in another interface. That helps prevent metric drift, especially when business users start exploring data on their own.
Lightdash also has a useful deployment story because teams can self-host the open-source edition or use the Cloud Pro option. That gives platform teams room to choose between environment control and a flatter SaaS experience. For organizations doing a migration from another BI tool, the onboarding and migration support can lower the friction of adoption.
The tool is a strong fit for analytics teams that want a code-first workflow without losing self-serve access. The explorer, catalog, and dashboards can sit in front of the same governed model, which keeps stakeholders from inventing their own metric logic.
Good fit: dbt-heavy teams that want developers to own definitions and business users to consume them without re-implementing logic in dashboards.
Limits to watch
The ecosystem is smaller than legacy enterprise BI stacks, and some advanced features can require add-ons. That matters if the organization wants deep embedding or very broad governance controls from the same product. For small teams, though, the simplicity is often the point.
5. Metabase
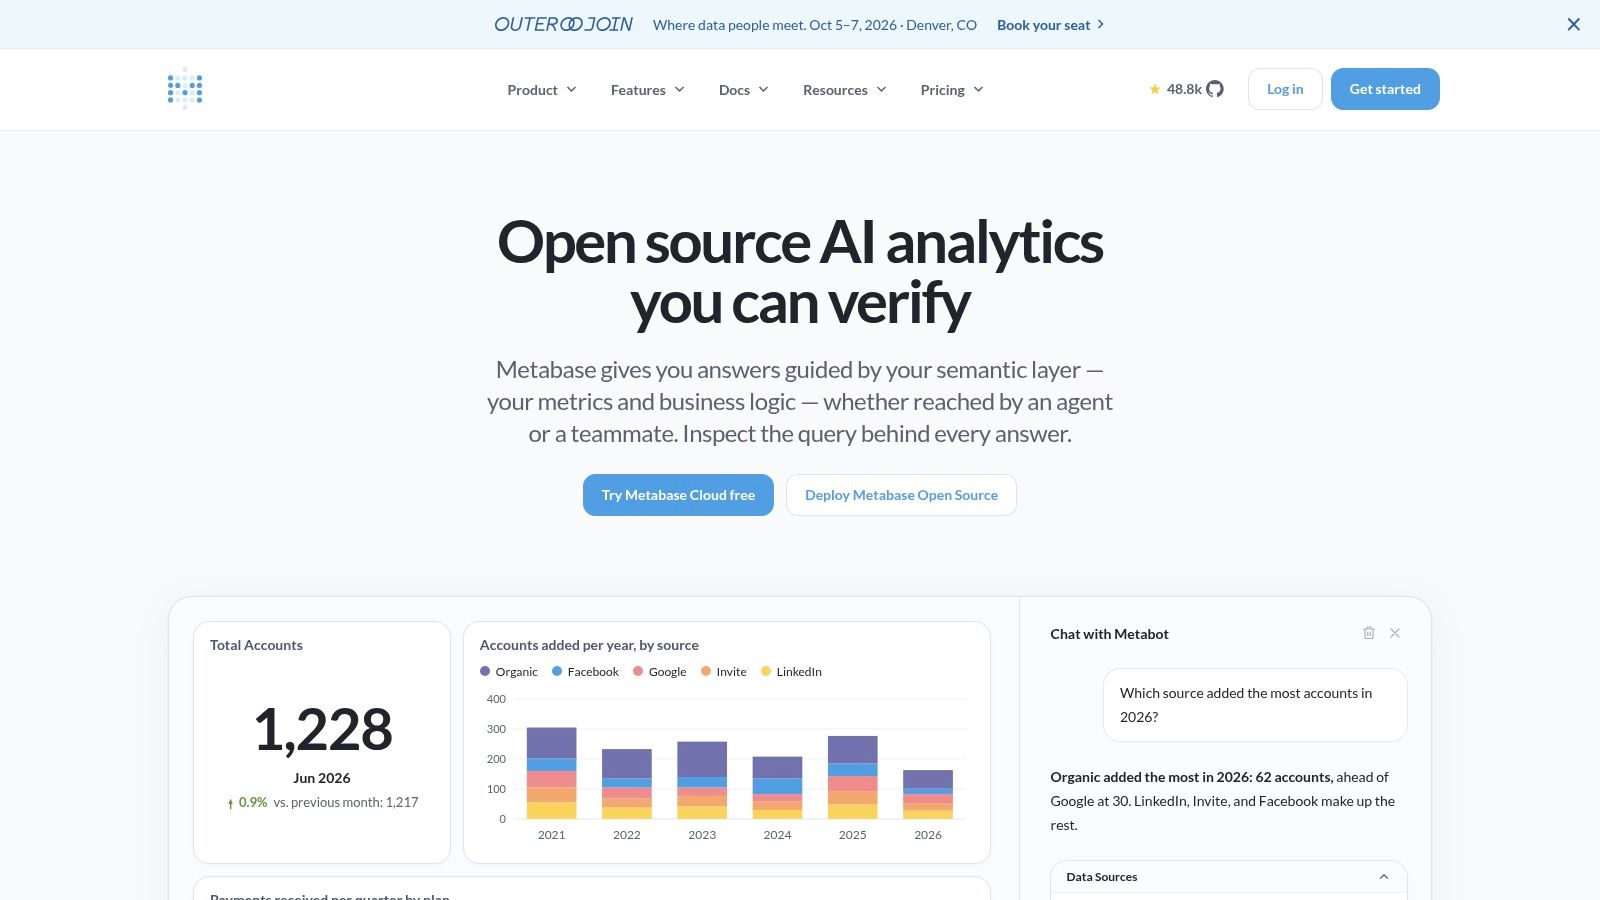
Metabase is the fastest route from raw SQL to usable self-service analytics. It combines a no-code question builder, SQL editor, models and metrics, dashboards, schedules, and alerts, so it works well in teams that want broad access without asking every user to become a BI developer.
Why it's so approachable
The product is easy to adopt because it gives non-developers a path into analysis without removing SQL from the workflow. That makes it especially useful in smaller teams where the same people may jump between analytics, operations, and reporting. The open-source heritage also matters, because teams can self-host when data residency or internal controls are critical.
Metabase is also a decent fit when dashboards need to be published quickly and the main requirement is clarity, not highly bespoke visuals. It supports embedding, so product teams can surface internal analytics inside apps or portals without building the whole front end themselves. For teams evaluating how accessible self-service should work in practice, digna's self-service analytics overview is a useful companion reference.
Where it can feel limited
The visualization surface is simpler than premium enterprise BI tools, so teams that need highly polished executive reporting may outgrow it. More advanced entitlements and scale features often sit in higher tiers, which is worth planning for if the tool starts as “just a lightweight internal solution” and then becomes the canonical analytics layer.
Metabase works best when governance is real but not over-engineered. If metric ownership and access policies are clear, it gives users enough freedom to explore without turning every question into a ticket.
6. Mode
Mode is a strong fit for teams that move between SQL, notebooks, and dashboards in the same day. It combines a serious SQL editor, integrated Python and R notebooks, and a visual explorer, so it works well when analysis starts as code and ends as a shareable report or dashboard.
Where it shines
Mode's main advantage is the handoff between exploratory work and production-style sharing. An analyst can query data, switch into Python or R for deeper work, and then publish the result without moving to a separate toolchain. That keeps analysis more reproducible than exporting results from one environment and rebuilding them elsewhere.
It also has strong collaboration and API support, which makes it useful for teams that care about distribution and workflow integration. Reusable datasets, permissions, SSO, SCIM, and webhooks help it fit into more mature operating environments, especially where analytics needs to move through formal review paths.
What to consider
Mode is not the cheapest or the simplest option for every team. Pricing for paid tiers isn't public, which means procurement starts with sales conversations instead of self-serve experimentation. The free Studio tier also places limits on users and query sizes, so it's best treated as a sampling lane, not a full operating model.
Mode is strongest when the team wants both developer depth and stakeholder delivery. If the organization only needs straightforward dashboards, it may be more platform than necessary. If it needs code and visuals in one place, it's a good compromise.
7. Hex
Hex is closer to an analysis-to-app platform than a traditional BI front end. It lets teams mix SQL, Python, and UI components inside notebooks, then turn that work into shareable apps, dashboards, and internal tools. That makes it attractive for teams that don't want to leave one environment as they move from exploration to delivery.
Why it stands out
Hex is useful when the output isn't just a chart, it's a guided analysis experience. Its notebook-first design supports conversational self-serve and agentic assistance, which can speed up exploratory work for BI developers and analysts alike. The app builder also helps teams package analysis for non-technical stakeholders without rebuilding the logic in a separate web stack.
The platform's integration story is broad enough for modern data teams. Git export, REST APIs, and orchestrator connections like Airflow, Dagster, and dbt make it more operational than a pure notebook product. Fine-grained permissions, audit logs, and compliance options help it fit into more controlled environments.
The main constraints
Hex's advanced governance and security features are mostly enterprise-gated, so smaller teams may not get the full operating model without moving upmarket. Advanced compute profiles can also add incremental cost, especially if GPU-backed work becomes common. That means the tool can start as a flexible analytics environment and then become more expensive as usage broadens.
Hex is best when the team wants to deliver analysis that users can interact with, not just read. If the requirement is only to publish stable dashboards, a more conventional BI platform may be simpler to run.
The strongest Hex use case is the one where an analyst keeps saying, “I need one more filter, one more scenario, and one more explanation.” That's where notebook-to-app workflows save time.
8. Looker
Looker is the classic choice for organizations that want a strict semantic model and enterprise-grade governance around metrics. Its LookML layer centralizes business logic, while APIs and SDKs make embedding and automation easier than in more dashboard-centric systems.
Why governance teams care
Looker's strength is consistency. If a company needs the same metric definition across multiple departments, the semantic layer gives developers a single place to encode it. That reduces the odds that finance, operations, and product each compute “revenue” in slightly different ways.
The platform is also built for larger organizations that care about permissions, user separation, and reusable metrics at scale. Its embedding and automation surface is mature, so it often lands in internal BI portals and customer-facing analytics products where the reporting layer needs to be tightly controlled.
What makes it harder to adopt
Looker asks for LookML expertise, and that creates a ramp-up cost. Teams used to ad hoc SQL or drag-and-drop BI often underestimate how much discipline the semantic layer requires. Pricing is sales-quoted, so there's no quick self-serve check before commitment.
Looker is a strong answer when the organization values governance over speed of experimentation. If the priority is flexible exploration by many casual users, it can feel heavier than the simpler tools on this list.
9. Tableau
Tableau is still one of the best-known enterprise BI platforms for visual expressiveness and broad connectivity. It pairs authoring with Tableau Prep, supports Tableau Cloud and Tableau Server, and has a large training and partner ecosystem that matters in big deployments.
Why it remains widely used
Tableau's main strength is presentation quality. When leadership wants polished, flexible dashboards and the BI team needs fine control over the visual layer, Tableau is still a strong option. Its deployment choices also matter, because some organizations want cloud convenience while others need on-premises control.
The ecosystem is a major plus. Mature products live or die by documentation, community support, and available talent, and Tableau has all three in abundance. That makes it easier to staff, train, and maintain over time than a niche tool with a better demo and a weaker bench.
For teams who want to connect dashboard reliability back to data quality, digna's article on why business intelligence tools are only as good as data quality is worth reading alongside Tableau planning.
Where the friction shows up
Role-based licensing can get expensive as the number of Creators grows, and that often becomes a procurement issue before a technical one. Admin and server operations also take real experience at scale, so Tableau is not “easy” just because it is familiar.
Tableau works best in organizations that can absorb governance, admin, and licensing complexity in exchange for a strong visual layer. If the team wants simpler authoring and lighter operational overhead, it may be more than they need.
10. Microsoft Power BI including Fabric capacities
Power BI is the most natural fit for organizations already standardized on Microsoft 365 and Azure. It ties together modeling, DAX semantic models, dashboards, and distribution, and Microsoft's Fabric path gives larger teams a capacity-based route when per-user licensing stops being enough.
Why it wins in Microsoft-centric shops
The platform's biggest advantage is integration. Teams already living in Microsoft 365, Teams, and Azure can get a lower-friction analytics stack than they would from a separate vendor. Row-level security and admin controls also help keep governance aligned with broader Microsoft identity and infrastructure patterns.
The licensing path is flexible, at least conceptually. Premium Per User can provide most premium features without buying capacity, while Microsoft Fabric capacities give organizations a route to larger audiences and embedding scenarios. Microsoft also states that Power BI and Fabric both integrate with OneLake, its unified data lake for all workloads, which is a concrete example of how reporting is moving closer to shared storage architecture than isolated extracts (Power BI overview).
The trade-offs
Power BI licensing can be hard to untangle, especially when teams compare per-user, capacity, and embedding models. That complexity doesn't matter much in a small pilot, but it matters a lot when finance asks for a cost forecast across multiple workspaces and audiences.
It also rewards capacity planning. Large deployments need governance around refreshes, model ownership, and workspace sprawl. Power BI can absolutely scale, but it doesn't remove the need for operational discipline.
Top 10 BI Developer Tools, Feature Comparison
Product | Core features ✨ | Quality & Reliability ★ | Pricing & Value 💰 | Target audience 👥 | Unique selling points ✨ |
|---|---|---|---|---|---|
digna 🏆 | Anomaly detection, timeliness, row-level validation, schema tracking, in‑database exec | ★★★★★ enterprise-grade, rapid time‑to‑value | 💰 Modular: base + per‑active‑table/per‑module; transparent (quote) | 👥 Data engineers, analytics teams, platform ops, regulated industries | 🏆 ✨ Runs inside customer infra, in‑database checks, AI baseline learning, privacy‑first |
dbt by dbt Labs | SQL-first transformations, tests, docs, lineage, semantic layer | ★★★★ developer-centric, strong CI/CD | 💰 OSS core + paid Cloud (tiered) | 👥 Analytics engineers, data teams building ELT models | ✨ Metrics-as-code, large ecosystem, engineering workflow |
Apache Superset | Visualizations, SQL Lab, lightweight semantic layer, extensible plugins | ★★★★ scalable, self-hostable (ops required) | 💰 Free OSS; self-host infra costs | 👥 BI engineers, dev-forward BI teams, self-hosters | ✨ Fully extensible, broad SQL engine support |
Lightdash | dbt-native metrics, governed self-serve analytics, explorer | ★★★★ dbt-native UX, focused on metrics | 💰 Cloud flat-fee or self-host OSS | 👥 dbt-first teams, product analytics, small‑to‑mid orgs | ✨ Native dbt integration, metrics catalog, embedding |
Metabase | No-code query builder, SQL editor, dashboards, alerts | ★★★ ease-of-use for non-devs | 💰 OSS + low-cost Cloud tiers (per-user options) | 👥 Business analysts, small teams, quick adopters | ✨ Fast onboarding, approachable self-serve analytics |
Mode | SQL editor, integrated Python/R notebooks, visual explorer | ★★★★ strong for hybrid code+visual workflows | 💰 Freemium; paid tiers via sales | 👥 Data scientists, analytics teams needing notebooks | ✨ Notebook → report workflow, strong collaboration APIs |
Hex | Notebook-to-app, SQL/Python mix, UI components, embedding | ★★★★ modern collaboration, AI-assist features | 💰 Freemium; pay-as-you-go compute, Enterprise plans | 👥 Data teams building apps, analysis→product workflows | ✨ Agentic notebooks, data app builder, GPU options |
Looker (Google Cloud) | LookML semantic layer, APIs/SDKs, embedding, governance | ★★★★★ enterprise-grade governance | 💰 Sales‑quoted enterprise licensing | 👥 Large orgs, embedded analytics, governed BI | ✨ Robust semantic modeling, deep API/embedding support |
Tableau | Feature-rich authoring, dashboards, data prep, deployment options | ★★★★★ high visual quality, mature ecosystem | 💰 Per-user or server; can be expensive at scale | 👥 BI authors, analysts, enterprise visualization needs | ✨ Extensive visualization/partner ecosystem, training |
Microsoft Power BI | DAX modeling, dashboards, Fabric capacities, M365 integration | ★★★★ broad adoption, fast feature cadence | 💰 Per-user (Pro/PPU) or capacity (Fabric F‑SKU) | 👥 Microsoft-centric orgs, large audiences | ✨ Tight M365/Azure integration, cost-effective at scale |
Build the Stack Around Reliability, Not Tool Count
The shortlist works best when you stop treating every product as a full stack. A dbt plus Lightdash setup is a clean fit for code-first analytics teams that want metric logic centralized upstream and dashboards downstream. dbt plus Metabase is a better match when the team wants accessible self-service without losing modeling discipline. Mode or Hex make sense when the work moves fluidly from SQL into notebooks and then into shareable analysis or apps. Apache Superset is the right call for teams that want an extensible, self-hosted BI layer they can own inside their own infrastructure.
For enterprise reporting, Looker, Tableau, and Microsoft Power BI are still the most recognizable governance-first options, but they solve slightly different problems. Looker is strongest where semantic consistency matters most. Tableau is strongest where visual depth and deployment flexibility matter. Power BI is strongest where Microsoft 365 and Azure are already the center of gravity.
The missing layer in many stacks is reliability. Dashboards break because data changes, not because the charting library is weak. That's where digna belongs. It can sit alongside any of these tools when teams need in-database quality checks, anomaly detection, timeliness monitoring, schema tracking, or validation inside their own environment instead of a separate managed service.
A good selection process starts with ownership. Who owns metric logic, the BI layer or the transformation layer. Where does the stack run, SaaS, private cloud, VPC, or on-prem. Who handles governance, alerting, and incident response. How much integration work is required between modeling, reporting, embedding, and orchestration. What licensing model makes sense as usage grows. And most important, are you detecting a broken dashboard after the fact, or preventing unreliable data from reaching it at all.
If your team needs BI reliability without moving production data out of your environment, start with digna's in-database monitoring, schema tracking, timeliness checks, and anomaly detection. It's built for the same stack-level reality this article covers, where dashboards are only as trustworthy as the data underneath them. Visit digna to see how it fits into your analytics workflow.
Frequently asked questions
How should you compare BI developer tools?
As parts of a working stack rather than isolated products. The practical question is not which BI tool is best but which combination gives reliable delivery, reasonable governance and a deployment model the team can support.
How large is the BI market?
The global analytics and business intelligence software market reached $20.3 billion in 2024, grew 10% year over year, and is projected to reach $28.5 billion by 2029 at a 7% CAGR. The growth is why single-tool consolidation keeps being attempted.
Where does a data quality layer sit in a BI stack?
Underneath the dashboard, not beside it. digna belongs there because the problem it addresses is data trust rather than chart design, and its in-database execution reduces data movement in a way that suits strict security reviews.
Why does picking one tool for everything usually fail?
Because modeling, reporting, quality and CI/CD have different requirements and different buyers. A tool chosen to win one of those four rarely satisfies the other three, and the gaps get filled informally instead of deliberately.
What should decide the final shortlist?
Deployment model as much as features. A stack that cannot be supported in your environment is not a stack, which is why deployment and governance constraints belong in the comparison from the start rather than at procurement.


