What Is an Observability Platform: Your 2026 Guide
|
7
min read

A data observability platform gives teams deep, real-time visibility into the health and behavior of data itself, not just the servers and apps that move it. Gartner projects that 50% of enterprises with distributed data architectures will adopt data observability tools by 2026, up from approximately 20% in 2024, because teams need to catch issues like quality degradation, pipeline delays, and schema changes before they hit reports, dashboards, or AI models.
If you're looking up what is an observability platform, you're probably already dealing with the frustrating version of this problem. The job ran. The dashboard refreshed. Nothing crashed. But the numbers are wrong.
That gap is why the old definition of observability isn't enough anymore. Infrastructure observability tells you whether systems are running. Data observability tells you whether the data those systems delivered is usable, timely, structurally intact, and still trustworthy for business decisions.
Table of Contents
When Good Data Goes Bad Silently
A common failure starts with a report that looks normal enough to pass a casual check. Revenue is down a bit, conversion is flat, customer counts seem plausible. No one gets paged because the orchestration layer shows a successful run and the warehouse is online.
A week later, someone notices a filter isn't matching correctly because a source field changed type. The ingestion job never failed. The BI layer never broke. The pipeline delivered data on schedule, but one structural change subtly altered business logic downstream.
That kind of incident is exactly why teams ask what is an observability platform in the first place. They don't need another dashboard telling them CPU is healthy. They need a system that can tell them the data is late, incomplete, malformed, drifting, or no longer statistically normal.
Silent failures are business failures
Traditional monitoring catches loud failures. It catches a dead service, a timeout spike, a storage issue, or an API outage. It doesn't reliably catch a column rename, a sudden drop in one segment of records, or a distribution shift that poisons a model input without triggering an application error.
Practical rule: If a pipeline can succeed while the business answer is wrong, infrastructure monitoring alone won't protect you.
This is why data observability has moved from nice-to-have to core platform capability. According to Atlan's summary of Gartner's projection on data observability adoption, 50% of enterprises with distributed data architectures are projected to adopt data observability tools by 2026, up from approximately 20% in 2024, which reflects 250% adoption growth in two years. The same analysis ties that growth to a simple reality: organizations need to detect and prevent data anomalies before they affect AI models, financial reports, and customer dashboards.
What teams are actually trying to prevent
In practice, the painful incidents are usually these:
Late-arriving data: Executive dashboards open on time, but the latest partition didn-t land.
Schema drift: Upstream systems change field names, types, or structures without warning.
Quality degradation: Nulls, duplicates, malformed values, or odd category shifts spread unnoticed.
Bad propagation: One upstream defect flows through warehouse models, notebooks, and BI layers.
A modern observability platform exists to make those failures visible while they're still small.
The Five Pillars of a Healthy Data System
A good way to think about data observability is to compare it with a modern car. A speedometer and fuel gauge tell you something, but not enough. A proper diagnostic system tells you whether the engine is overheating, a sensor is failing, a brake component is degraded, or a subsystem has stopped reporting correctly.
Data systems work the same way. A pipeline success status is the speedometer. Real observability goes much deeper.
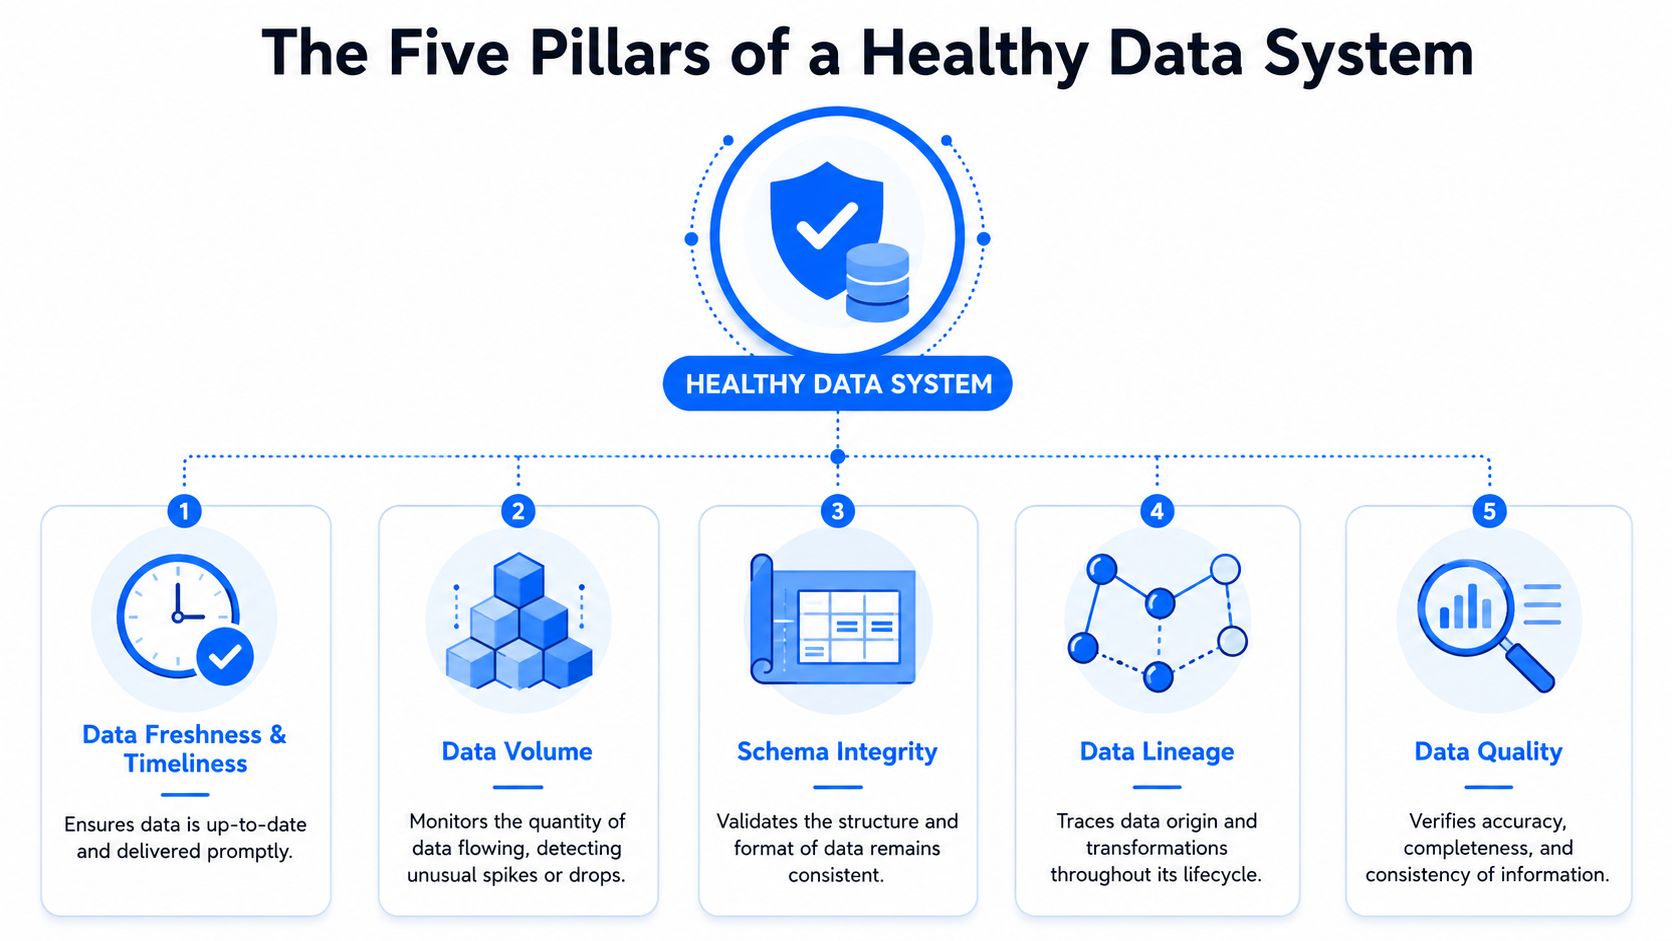
What healthy data actually looks like
The five pillars commonly used in data observability are freshness, volume, schema, distribution, and lineage, as described in Atlan's explanation of data observability tools.
Freshness means the data arrived when it should have.
A daily sales table that loads at noon instead of 6 a.m. may still be correct eventually, but it isn't operationally useful when finance opens the report in the morning.Volume checks whether the amount of data matches expectation.
A sudden drop in row counts can mean an extraction failed for one region. A sudden spike can mean duplicate ingestion or replay.Schema watches structural consistency. It helps you catch added columns, removed fields, type changes, or renamed attributes before transformations and downstream consumers start behaving unpredictably.
Distribution tracks whether the values still look like themselves over time.
A column can be fully populated and structurally valid while still becoming suspicious. Maybe a risk score that usually spans a broad range suddenly clusters tightly, or one customer segment disappears.Lineage shows where data came from, what transformed it, and what depends on it.
When something breaks, lineage tells you whether the problem began in ingestion, transformation, or a downstream model.
Healthy data isn't just present. It's on time, shaped correctly, statistically plausible, and traceable.
Why these pillars work together
Looking at only one pillar produces blind spots. Fresh data can be wrong. Correct schema can still hide bad values. Strong validation on one table won't tell you where an upstream issue originated.
This is why single-purpose tooling often disappoints after the first few incidents. A row-count check may catch missing data, but it won't catch a type conversion that turns meaningful values into nulls. A schema monitor may catch structural changes, but it won't spot subtle drift in category mix or unusual changes in value distribution.
A mature platform combines these signals so teams can answer three practical questions fast:
Question | What the platform needs to show |
|---|---|
Is the data current enough to use? | Freshness and timeliness |
Does the dataset still look structurally and statistically valid? | Volume, schema, and distribution |
If it's broken, where did the issue start and what depends on it? | Lineage |
Those five pillars create the minimum viable map of data health. Anything less leaves too much to manual inspection.
Observability vs Monitoring vs Data Quality
Most confusion around this topic comes from people using one phrase to describe three different jobs. Infrastructure observability, monitoring, and data quality all matter. They just solve different problems.
Where MELT observability stops
In the infrastructure and application world, an observability platform usually aggregates metrics, events, logs, and traces (MELT) so engineers can understand the internal state of distributed systems from external outputs. SigNoz's architecture guide describes that pattern as an end-to-end system for collecting, ingesting, storing, and querying telemetry across modern cloud-native environments.
That model is useful. It helps teams investigate app latency, service dependencies, and unexpected runtime behavior. The problem is that MELT tells you about the system moving the data, not necessarily the state of the data itself.
A pipeline can emit healthy logs, traces, and metrics while still delivering broken business data. That's the gap many teams discover too late.
The gap is bigger than many platform teams expect. Embrace's discussion of observability platform blind spots notes that 73% of data engineering teams report that broken data pipelines cause more business downtime than application crashes, while legacy platforms still lack native support for schema drift, data timeliness, and record-level quality without manual rule maintenance.
For smaller organizations building their first serious analytics stack, Up North Media's data analytics advice is a useful reminder that trustworthy reporting starts with dependable underlying data, not just attractive dashboards.
A practical comparison
Here's the shortest way to separate these categories in real work:
Category | Primary goal | Typical method | Common blind spot |
|---|---|---|---|
Monitoring | Catch known failures | Thresholds, health checks, status alerts | Unknown failure modes |
Application observability | Investigate system behavior | MELT telemetry and correlation | Silent data defects |
Data quality tools | Enforce explicit rules | Tests and validation logic | Drift outside predefined rules |
Data observability | Detect unexpected data health issues | Baselines, anomaly detection, lineage, monitoring of data behavior | Weak coverage if deployed without domain context |
Two practical patterns matter here.
First, monitoring is reactive by design. It assumes you know what to watch. That works for disk saturation or failed jobs. It works less well for subtle category shifts and delayed-but-successful loads.
Second, classic data quality tooling is narrow. It can be very effective for business rules such as allowed values, uniqueness, or mandatory fields. But it often depends on teams continually updating rules as source systems and business processes change. That maintenance burden is exactly why many teams start looking at data observability versus data quality as separate but complementary disciplines.
Application observability answers "what happened in the system?" Data observability answers "can I trust the data the system produced?"
How Data Observability Platforms Are Architected
Once teams move past the definition, the next question is usually architectural. Where does the platform run, where does the computation happen, and how much data has to leave the environment?

The pipeline under the platform
At a technical level, an observability platform isn't one feature. It's a stack. Selector's explanation of observability platforms describes the broader model as a unified system that correlates logs, metrics, and traces so teams can diagnose issues faster across complex environments.
For data observability, the architecture adds a second requirement. It must inspect the data itself. That means collecting metadata, profiling table behavior, learning baselines, and surfacing anomalies in a way that ties back to lineage and operational context.
A useful reference point comes from Kevin Slin's analysis of modern observability architecture, which explains that enterprise-scale platforms integrate with instrumentation, continuously discover telemetry, establish ML-based baselines, and unify signals into one pipeline that supports natural-language queries and topology-aware anomaly detection.
That same architectural idea matters in data systems. You need a collection layer, a way to compute or retrieve health metrics, storage for time-based patterns, and a query surface that lets engineers investigate what changed and where.
Why deployment model matters
In enterprise settings, architecture isn't just about scale. It's about control.
Teams in finance, healthcare, telecom, and the public sector usually can't treat observability as a casual SaaS add-on. Sensitive datasets, regulated workloads, and internal governance policies often require private cloud or on-prem deployment models. If the platform only works by exporting large amounts of operational data into a vendor-managed environment, many organizations will stop the evaluation there.
An in-database execution model is often the cleanest answer. Computation runs where the data already lives. That reduces data movement, keeps sensitive records inside the customer environment, and avoids building a second copy of operationally sensitive datasets just to monitor them. It's also why platform engineers often review data pipeline architecture patterns before committing to a tool. The observability layer has to fit the warehouse, lake, orchestration, and governance model they already run.
Architecture choice isn't cosmetic. It determines whether security, cost, and scale work in production or only in a demo.
From Anomaly Alerts to Business Impact
Technical teams buy observability. The business feels the consequences.
A good platform matters because bad data doesn't stay in the data team. It spreads into pricing decisions, financial close, customer reporting, service operations, and machine learning outputs.
Three places where trust breaks first
AI and ML pipelines are one of the fastest places to lose trust. A model can keep serving predictions while its inputs drift away from the patterns it was trained on. Nothing crashes. The output just becomes less reliable. When teams monitor anomaly patterns and seasonality in time-based signals, they have a better chance of spotting drift before model performance discussions turn into incident response. That's the practical value behind techniques used in time series anomaly detection workflows.
Financial reporting is another high-stakes case. Finance doesn't only need pipelines that complete. It needs numbers that are complete, timely, structurally consistent, and explainable. Late loads can stale out morning reporting. Schema changes can break mapping logic. Record-level validation matters because audit questions rarely care that the pipeline status was green.
Operational dashboards fail more often through staleness than through obvious outage. Sales, support, and operations teams make decisions based on what appears to be current data. If one feed arrived late or one source duplicated records, the dashboard may still render perfectly while driving the wrong action.
What changes when alerts are tied to action
The important shift happens when alerts become specific enough to route and resolve.
Instead of "pipeline unhealthy," a useful platform says the customer events table is late relative to expected delivery, one key field changed type, and a downstream model depends on it. That shortens the path from detection to ownership.
AI-based anomaly detection is part of that shift. Plixer's overview of AI-powered anomaly detection describes the typical pattern: data is collected and normalized, models learn historical baselines, and incoming real-time data is compared against learned normal behavior rather than static thresholds alone.
That matters in business terms because most expensive data incidents don't look identical every time. Teams need systems that adapt as data patterns change.
How to Evaluate an Enterprise Observability Platform
A buying process usually goes off track when teams evaluate screenshots and feature lists instead of operating model fit. The right question isn't whether a tool has anomaly detection. The right question is whether it can detect useful anomalies in your environment without creating a maintenance burden your team can't carry.
Questions worth asking in a proof of concept
Start with these:
How does it learn normal behavior? Ask whether the platform can adapt to seasonality, trend shifts, and changing baselines instead of relying only on fixed thresholds.
Where does computation run? For many enterprises, private execution is a requirement, not a preference.
Can it cover both automated detection and explicit business rules? You usually need both.
How does it handle schema changes and timeliness? These are frequent failure modes in real warehouse environments.
Who can use it? If only a specialist can interpret results, adoption will stall.

What usually fails in enterprise rollouts
The most common failure is overreliance on manual rules. They work at first. Then source systems evolve, schedules shift, and the rule set grows into a maintenance project of its own.
That is why adaptive methods matter. Oracle's explanation of anomaly detection notes that AI-powered systems create dynamic baselines for normal behavior and adapt to new patterns over time, rather than depending entirely on static statistical rules.
A second failure point is weak deployment flexibility. If security, compliance, or data residency constraints force exceptions, the rollout becomes political before it becomes useful.
A third is fragmented tooling. One tool watches pipelines, another enforces data rules, a third profiles quality metrics, and none share enough context to speed up root-cause analysis.
The strongest enterprise platforms reduce manual rule upkeep, fit regulated deployment models, and give analysts as well as engineers a usable view of data health.
The digna Approach to Unified Data Health
One practical example of this newer model is digna, which combines observability and data quality in a single platform rather than treating them as separate operational silos.
Its components map cleanly to the operating needs discussed above: Data Anomalies for behavioral shifts, Timeliness for delayed or missing arrivals, Schema Tracker for structural changes, Data Validation for explicit record-level rules, and analytics views for trend inspection. The platform runs analyses inside customer databases and supports private cloud or on-prem deployment, which aligns with the architectural constraints many enterprise teams face.
That combination matters because observability and data quality usually intersect in production. Teams don't want one product for schema drift, another for rule enforcement, and another for trend analysis if those tools can't share context.
The anomaly detection approach is also worth noting. According to digna's description of its AI anomaly detection techniques, its Data Anomalies module uses Isolation Forests, autoencoders, and adaptive thresholding to learn normal behavior, including seasonality and trends, and then flag deviations without manual rule maintenance or ML expertise.
The broader lesson is simple. A useful observability platform doesn't stop at infrastructure signals. It makes the state of the data visible, actionable, and governable in the environment where the data lives.
If your team is dealing with stale dashboards, silent schema drift, or data incidents that never show up in infrastructure alerts, digna is one option to evaluate. It focuses on in-database data observability and data quality for enterprise environments, with support for anomaly detection, timeliness monitoring, schema tracking, and record-level validation in private cloud or on-prem setups.
Because observability and data quality usually intersect in production, see how digna brings anomaly detection, timeliness, schema tracking and record-level validation together in its data quality management solution.
Frequently asked questions
What is a data observability platform?
A data observability platform gives teams deep, real-time visibility into the health and behavior of the data itself, not just the servers and apps that move it. It catches quality degradation, pipeline delays and schema changes before they reach reports, dashboards or AI models, even when every job succeeded.
What are the five pillars of data observability?
The five pillars are freshness, volume, schema, distribution and lineage. Freshness confirms data arrived on time, volume checks row counts against expectation, schema watches structural consistency, distribution tracks whether values still look normal, and lineage shows where data came from and what depends on it downstream.
What is the difference between observability, monitoring and data quality?
Monitoring catches known failures with thresholds and health checks. Application observability uses MELT telemetry (metrics, events, logs and traces) to investigate system behavior but misses silent data defects. Data quality tools enforce explicit rules, while data observability uses baselines, anomaly detection and lineage to find unexpected data health issues.
Why does the deployment model of an observability platform matter?
Teams in finance, healthcare, telecom and the public sector often cannot export sensitive data to a vendor-managed service. An in-database execution model runs computation where the data already lives, which reduces data movement, keeps sensitive records inside the customer environment and avoids building a second copy just to monitor it.
What should you ask in a data observability proof of concept?
Ask how the platform learns normal behavior, including seasonality and trend shifts, and where its computation runs. Then check whether it covers both automated detection and explicit business rules, how it handles schema changes and timeliness, and whether people beyond specialists can interpret the results it produces.


