Outlier Identification Methods a Practical Guide for 2026
|
7
min read

It's Monday morning, the dashboard says revenue is zero, and nobody can find a failed job. Airflow is green. dbt finished. The warehouse is up. Yet the number the executive team is staring at is still wrong.
That's the moment many teams realize outlier detection isn't a statistics exercise. It's an operational discipline. Bad data rarely announces itself with a stack trace. More often, it slips through as a strange value, a delayed table load, a sudden distribution shift, or a record that passes schema checks but still breaks downstream logic.
Most guides on outlier identification methods stop at z-scores and box plots. That's useful for a classroom. It's not enough for a production pipeline that feeds finance reporting, ML features, operational dashboards, and audit-sensitive workflows. In practice, the hard part isn't naming methods. It's choosing the right one for the shape of the data, running it at scale, and making sure engineers can act on what gets flagged.
Table of Contents
When Good Data Goes Bad The Silent Impact of Outliers
At 8 AM, a sales dashboard showing zero revenue doesn't look like an outlier problem. It looks like a broken pipeline. Engineers start where they always start. Check orchestration logs. Check connector health. Check warehouse query history. But sometimes every system says the run succeeded.
The failure is inside the data.
A source can send a valid file with one corrupted field that cascades through aggregations. A transactional table can arrive late, leaving downstream models technically fresh but semantically stale. A distribution can drift just enough that a forecast model still scores records while producing nonsense. These are the incidents that burn time because nothing appears obviously broken.
Silent failures are the expensive ones
Hard failures are painful, but they're at least visible. Silent anomalies are worse because analysts keep working with bad outputs until someone notices a number that feels off. By then, teams have already copied figures into slide decks, retrained models on suspect data, or made operational decisions from a dashboard they assumed was current.
Bad data doesn't need to crash a pipeline to create an incident. It only needs to look believable long enough to be used.
This is why outlier identification methods belong in the same conversation as reliability engineering. They protect continuity. They give teams a way to detect deviations before an analyst spots them manually or a business stakeholder raises the alarm.
Outliers aren't just data science problems
In production systems, outlier handling touches multiple layers:
BI reliability: A strange spike or drop can make a dashboard look broken even when the SQL is correct.
ML input quality: Feature pipelines often tolerate malformed records longer than they should.
Audit and compliance: A record can satisfy schema constraints and still violate business logic.
On-call load: Engineers lose hours proving infrastructure is healthy when the issue is really a data anomaly.
The practical lesson is simple. If your pipeline matters, your team needs a defined approach for identifying unusual values, unusual timing, and unusual behavior. Without that, every anomaly becomes a manual investigation.
Practical rule: Treat outlier detection as part of production readiness, not post hoc cleanup.
Expanding the Definition Value vs Operational Outliers
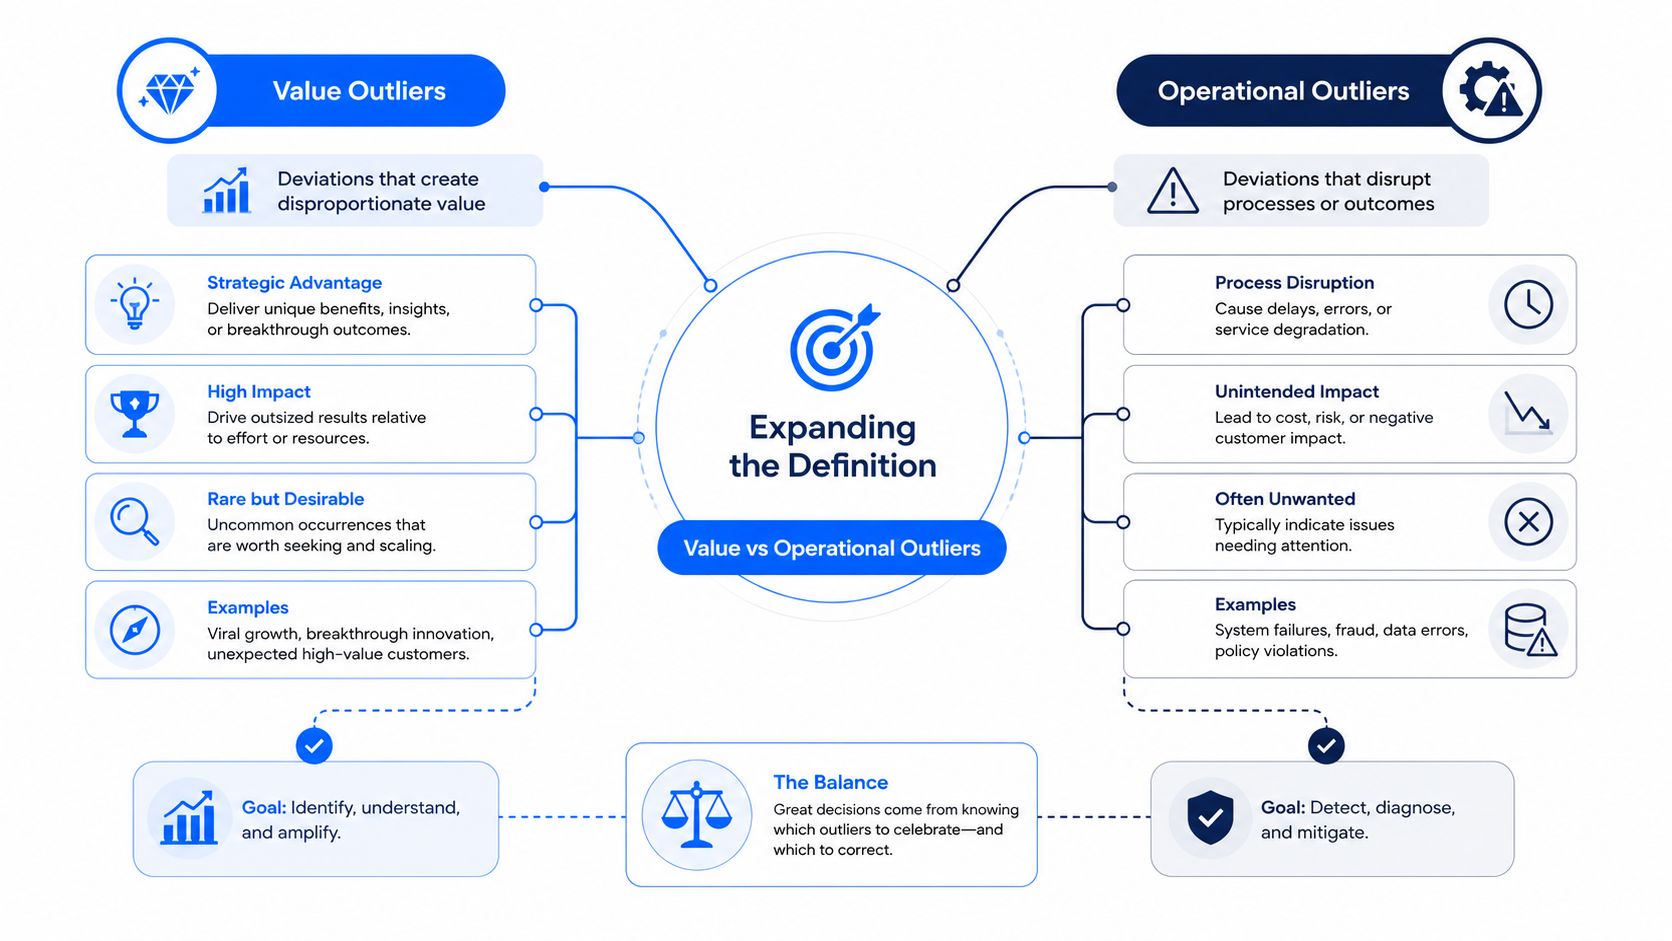
Outlier detection is often first introduced through examples like an impossible transaction amount or a sensor reading far outside its usual range. Those are real problems, but they're only one category. In live data platforms, some of the most damaging outliers aren't extreme values. They're abnormal delivery patterns.
Value outliers are only half the problem
A value outlier is what most statistical tutorials teach. Think of a quantity that doesn't fit the normal range for a metric, a record-level field that violates expected behavior, or a pattern in a measure that departs sharply from historical norms.
These methods answer questions like:
Is this value unusually high or low
Did this metric's distribution shift
Does this record look inconsistent with similar records
That's useful for fraud signals, sensor integrity, feature validation, and business KPI monitoring. It's not enough for data operations.
Operational outliers break trust faster
An operational outlier is a deviation in how data moves, arrives, or changes shape. The values may all be valid. The pipeline may even report success. But the data still isn't usable when it lands too late, arrives partially, or misses an expected load pattern.
That gap is where many teams get caught. The critical gap in existing outlier content is the lack of guidance on temporal and operational outliers. Most tutorials focus on univariate IQR or z-scores, but real-world data quality failures are often about timeliness anomalies where data is valid but late. A 2024 study on data observability shows that 68% of pipeline failures stem from latency or missing loads, not value outliers according to this summary of the gap in standard outlier teaching.
Operational outliers usually appear as:
Late arrivals: A table lands after downstream models have already run.
Missing loads: No hard error, just a silent absence of expected data.
Volume anomalies: A feed delivers far fewer or far more rows than normal.
Structural oddities: Column presence or type changes that don't always fail fast.
A team that only monitors values will miss these. That's why the best outlier identification methods aren't a single algorithm. They're a coverage model. You need techniques for the what, the when, and the how much.
A Comparative Guide to Outlier Identification Methods
Choosing among outlier identification methods starts with one question. What kind of abnormality are you trying to catch? A single skewed metric needs a different approach than a noisy customer event stream or a wide table with many correlated attributes.
Statistical methods
Statistical methods are still the right starting point when the problem is clear and the data shape is manageable. They're interpretable, fast, and easy to operationalize.
The standard z-score is familiar, but it has a major weakness. It depends on the mean and standard deviation, which are both distorted by extreme values. That makes it fragile in business datasets where skew, heavy tails, and volatility are common.
The stronger default for skewed distributions is the Modified Z-Score. The NIST guidance on robust outlier tests recommends this MAD-based approach for skewed data. Potential outliers are flagged when the absolute modified z-score exceeds 3.5. It replaces the mean with the median and the standard deviation with Median Absolute Deviation, which makes the baseline far less sensitive to extreme points.
Use statistical methods when you need:
Simple explainability: Analysts and engineers can understand why a point was flagged.
Fast warehouse execution: Median, quantiles, and dispersion metrics are often easy to compute in SQL.
Stable univariate monitoring: Good for KPIs, row counts, or field-level checks.
Weaknesses are just as important. These methods don't understand interactions among features, and classical variants often produce noisy results when assumptions don't match the data.
Distance and density methods
Distance-based and density-based methods are useful when the shape of the data isn't linear and abnormality depends on neighborhood structure rather than one metric.
Methods in this family include k-NN style approaches, LOF, and DBSCAN. They're better suited to problems where a record is only anomalous relative to nearby records, not because any single value is extreme.
DBSCAN is especially practical when you expect irregular clusters and noise. The DBSCAN overview in this benchmark-oriented summary describes it as a density-based method that identifies anomalies through local density divergence rather than fixed partitioning. That makes it useful in complex structures where simple distance thresholds fail.
A point can be perfectly ordinary on every single column and still be anomalous as a combination.
Use density methods when your data has shape, not just spread. Event networks, manufacturing patterns, and semi-structured behavioral data often fall into this category. The trade-off is computational complexity and tuning effort. Neighborhood parameters matter, and explainability can become harder for non-specialists.
Model-based methods
Model-based methods include families such as Isolation Forest and other anomaly models that learn normal behavior from data instead of relying on a hard-coded rule. These methods are attractive when normal changes over time or when feature interactions are too complex for hand-built thresholds.
They work best when teams need adaptation. Seasonal patterns change. Customer behavior shifts. Pipelines evolve. A static threshold that was sensible last quarter can become useless fast.
The catch is operational, not conceptual. Model-based systems can be harder to debug. If an alert fires, engineers still need to know what changed and whether the change matters. In production, explainability often determines whether teams trust a method enough to keep it on.
Outlier Detection Method Comparison
Method Type | Example Algorithms | Best For | Strengths | Weaknesses |
|---|---|---|---|---|
Statistical | Z-Score, Modified Z-Score, IQR | Single metrics, skewed business measures, simple monitors | Fast, interpretable, easy to run in SQL | Limited for multivariate and non-linear problems |
Distance-Based | k-NN style approaches | Record similarity checks in moderate dimensions | Intuitive neighborhood logic | Sensitive to scale and dimensionality |
Density-Based | DBSCAN, LOF | Irregular clusters, noisy datasets, local anomalies | Handles non-linear structure and noise well | Parameter tuning and computational cost |
Model-Based | Isolation Forest and related anomaly models | Evolving patterns, mixed-feature anomaly detection | Flexible, adaptive, useful at scale | Harder to explain and tune operationally |
One practical note. Every anomaly system has a false positive problem if teams optimize only for sensitivity. The same logic shows up in experimentation. If you want a useful mental model for threshold discipline, this piece on managing Type I errors in experimentation is worth reading because outlier detection has the same operational penalty when teams alert on too much weak signal.
Handling High-Dimensional and Complex Data
A lot of outlier guidance falls apart the moment a dataset gets wide. Ten columns might still be manageable by inspection. Fifty correlated features usually aren't. At that point, univariate checks start flooding teams with noise or, worse, missing the records that matter.

Why univariate logic breaks down
The common shortcut is to run separate z-scores or IQR checks on each field. That sounds reasonable until correlations matter. A record may sit comfortably inside the normal range on every individual column while representing an unusual combination across the row.
The familiar rule that 99.7% of data falls within 3 standard deviations only holds for normal distributions. In many finance and healthcare datasets, the Scribbr explanation of outlier assumptions notes that real-world data is often skewed instead. In those cases, resilient multivariate approaches like Mahalanobis distance and MAD-based techniques are better suited to record-level validation across correlated features.
In practice, teams encounter the curse of dimensionality. Distance becomes less intuitive. Visual inspection stops helping. Simple thresholds create too many edge cases to maintain.
What works better in wide datasets
For broad, correlated tables, a more reliable toolkit looks like this:
Mahalanobis distance: Useful when correlation structure matters and you need row-level anomaly scoring across many fields.
MAD-based validation: Better than classical mean and standard deviation logic when features are skewed or heavy-tailed.
Density-based methods: Stronger when records form irregular groups rather than neat linear clusters.
The selection depends on the question you need answered. If you're validating customer records, entity profiles, or claim-level data, correlation-aware methods usually outperform isolated per-column rules. If you're monitoring patterns in a feature store or event graph, density methods tend to catch structures univariate checks can't see.
Don't ask whether a value is strange by itself. Ask whether the record still looks plausible when all relevant columns are considered together.
Another practical constraint is execution. High-dimensional detection becomes much more useful when you can compute metrics where the data already lives. Pulling wide production tables into notebooks for post-processing creates latency, governance headaches, and version drift between analysis and monitoring. For critical pipelines, in-database execution is usually the cleaner path.
Operationalizing Detection From Theory to Production
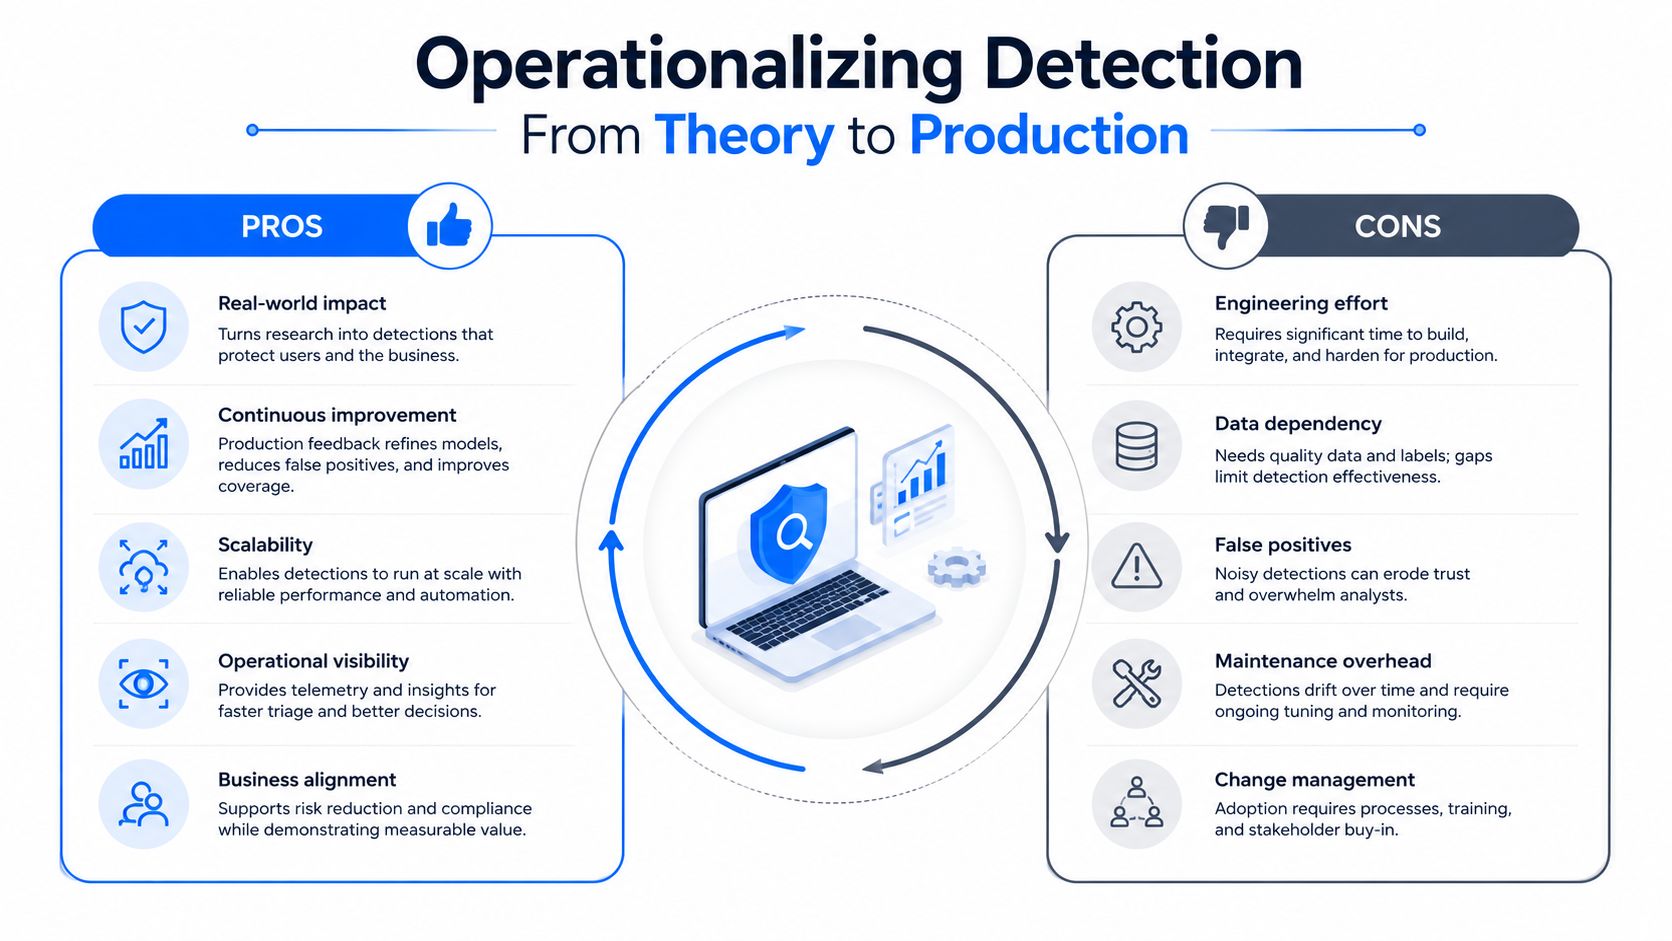
Good outlier identification methods still fail in production when teams treat the algorithm as the system. The algorithm is only one component. The complete system includes threshold management, compute placement, alert routing, ownership, and investigation workflow.
Start with alert design not algorithm choice
An alert that fires constantly isn't protection. It's background noise.
Teams need a deliberate way to decide what should page someone, what should open a ticket, and what should be logged for review. AI-powered anomaly detection systems in data platforms can learn normal behavior from historical patterns in data volume, distribution, and value ranges, then automatically flag deviations without relying on brittle static thresholds, as described in the digna platform overview.
That shift matters because static thresholds age badly. They don't handle trend changes, seasonality, or gradual metric drift well. Learned baselines usually perform better when the environment changes often, but they still need controls around sensitivity and routing.
A useful production checklist:
Define consequence first. A late finance load and a minor staging anomaly shouldn't have the same escalation path.
Require explainability. Every alert should tell engineers what changed, where, and relative to which baseline.
Separate monitor classes. Volume, timeliness, distribution, and record validation should not collapse into one undifferentiated signal.
Later in the rollout, teams usually need a practical implementation playbook. This guide on automating anomaly detection in data workflows is a good reference point for that operational layer.
Here's a useful walkthrough for teams thinking about production patterns:
Keep computation close to the data
Shipping data out to another environment for anomaly checks often creates its own reliability problem. It adds movement, delay, and another place for access controls to break. In practice, warehouse-native or in-database execution is usually the safer design.
That approach helps with three persistent issues:
Scale: Large fact tables are expensive to export repeatedly.
Privacy: Sensitive records stay in the controlled environment.
Consistency: Detection logic runs against the same data your dashboards and models use.
Production anomaly detection should be boring to operate. If it requires constant threshold babysitting, it isn't production-ready yet.
Integrating Detection into Your Data Observability Pipeline
The most reliable setup isn't one detector. It's a layered pipeline where different outlier identification methods cover different failure modes. That's what turns anomaly detection from a notebook exercise into an operational safeguard.

A layered monitoring pattern
A production observability pipeline should usually work in layers.
First, verify arrival behavior. Timeliness monitoring modules can use AI-learned expected arrival times together with user-defined schedules to detect late or missing data before dashboards are affected, and some platforms now support module-specific notification settings to reduce alert fatigue for engineers, as described in this coverage of timeliness monitoring updates.
Second, monitor aggregate behavior. Volume changes, null explosions, and distribution shifts often reveal upstream breakage faster than downstream complaints do.
Third, validate records. Some failures are neither timing issues nor aggregate anomalies. They're row-level business violations that only appear when you test actual records against domain rules.
What a production workflow should deliver
When teams integrate detection properly, the workflow should support all of these outcomes:
Fast triage: Engineers can tell whether the issue is arrival, shape, distribution, or business-rule related.
Shared visibility: Analysts, platform engineers, and governance teams can inspect the same signal history.
Minimal movement: Detection runs where the data already resides.
Targeted alerts: Different anomaly classes route to the people who can fix them.
If your current stack treats observability as only freshness checks or only schema checks, that coverage is incomplete. A modern setup needs all the layers working together. For a broader view of that operating model, this overview of data observability in practice is a useful companion read.
One detail matters more than teams expect. The output has to be operationally legible. An alert that says “anomaly detected” isn't enough. Engineers need the baseline, the affected table or metric, the timing context, and a path to drill into changed records.
Conclusion Building Proactive Trust in Your Data
Outlier detection is ultimately about trust. Not statistical elegance. Not model novelty. Trust that a dashboard reflects reality, that a feature table is safe to use, and that a pipeline reported as successful delivered usable data.
The right outlier identification methods depend on the failure mode. MAD-based statistical checks are strong for skewed metrics. Density and multivariate methods are better for complex record patterns. Timeliness monitoring catches a class of failures that ordinary value-based methods never will. In production, the winning approach is almost always layered.
Teams that do this well stop treating bad data as an occasional surprise. They build systems that expect drift, delays, strange records, and shifting baselines, then surface those issues before business users find them first.
Reliable data platforms don't happen because a warehouse is fast or an orchestrator is green. They happen because someone designed for silent failure.
If you want to move from ad hoc anomaly scripts to continuous in-database monitoring, digna gives data teams a practical way to detect anomalies, validate records, monitor timeliness, and investigate issues without moving production data out of their environment.
For the learned-baseline approach this guide recommends over brittle static thresholds, applied to volumes, distributions and values in the database, see digna Data Anomalies.
Frequently asked questions
What are the main outlier identification methods?
The article groups them into four families: statistical methods such as z-score, Modified Z-Score and IQR; distance-based k-NN approaches; density-based methods such as DBSCAN and LOF; and model-based methods such as Isolation Forest. Each suits a different data shape, from single skewed metrics to wide, correlated tables.
When should you use the Modified Z-Score instead of the standard z-score?
Use it for skewed data. The standard z-score relies on the mean and standard deviation, which extreme values distort. The Modified Z-Score, recommended by NIST, uses the median and Median Absolute Deviation instead and flags potential outliers when the absolute score exceeds 3.5.
What is an operational outlier in a data pipeline?
An operational outlier is a deviation in how data moves, arrives or changes shape, even when every value is valid. Typical examples are late arrivals, missing loads, volume anomalies and structural oddities. A 2024 study cited in the article attributes 68% of pipeline failures to latency or missing loads.
How do you detect outliers in high-dimensional data?
Per-column z-score or IQR checks break down because a row can look normal on every column yet be an unusual combination. For wide, correlated tables the article recommends Mahalanobis distance for row-level scoring, MAD-based validation for skewed features and density methods when records form irregular groups.
How do you reduce false positives in outlier detection?
Design alerts before choosing an algorithm. Define the consequence first so a late finance load and a minor staging anomaly escalate differently, require every alert to state what changed and against which baseline, and keep volume, timeliness, distribution and record validation monitors as separate classes.


