Is Your Data Still Current? Understanding Data Currency
|
7
min read

You can have a dashboard that loads fast, shows green status lights, and still gives a team the wrong answer. The central question isn't whether the data arrived, it's whether it still matches the decision in front of you. That gap is where data currency lives, and it's the reason a “healthy” pipeline can still support a bad call.
For teams working in analytics, engineering, finance, healthcare, telecom, and public sector environments, the distinction matters every day. A dashboard can be current enough for one use case and useless for another, which is why this topic belongs in governance, observability, and AI discussions at the same time. If you need a practical companion to that idea, Bridge Global's guide to real-time healthcare dashboards shows how delivery speed and decision usefulness can diverge in operational settings, and digna's overview of what data freshness means for business decisions frames the business side of that problem clearly.
Table of Contents
When Fresh Dashboards Still Lie to You
What Data Currency Actually Means
A loaf of bread and two different decisions
Why the same table can be current for one use case and stale for another
The Three Clocks That Decide If Data Is Current
Event time, ingest time, publish time
Setting Tiered Freshness SLAs by Dataset
Different datasets deserve different clocks
Tie the SLA to decision criticality, not system type
Enforcing Currency at Scale
Three enforcement patterns that fit different jobs
Thresholds that reduce noise
Why Stale Data Is Now an AI Risk Too
AI doesn't wait for someone to notice the numbers look odd
A Practical Playbook for Fit-for-Purpose Currency
Stop asking every table to be real time
A Monday morning checklist
When Fresh Dashboards Still Lie to You
Monday morning starts clean. An analyst opens a revenue dashboard, the page renders in under three seconds, every tile is green, and no ETL job is in a failed state. Then the first chart on the screen still reflects the previous quarter, and the team is already late for a meeting about this week's forecast.
That's the part people miss. Freshness is about delivery, whether data got loaded and became queryable on time. Currency is about fitness for the decision, whether the value still reflects the real-world state the user needs right now. A dashboard can pass a latency check and still fail the actual business test.
The operational mistake is treating pipeline health as the same thing as decision readiness. If a warehouse task completed, that only tells you the job ran. It doesn't tell you whether the underlying business event changed after capture, or whether the downstream consumer can trust the number for the question they're asking.
Practical rule: a green load check is not a green business decision. Always ask, “current for what?”
That's why articles about reliability need more than generic uptime language. In practice, the useful question is not whether the dataset exists, but whether it is current enough to act on. If you want a single sentence to keep in mind, use this one, a dashboard is only useful when the data is still current for the decision in front of it.
What Data Currency Actually Means
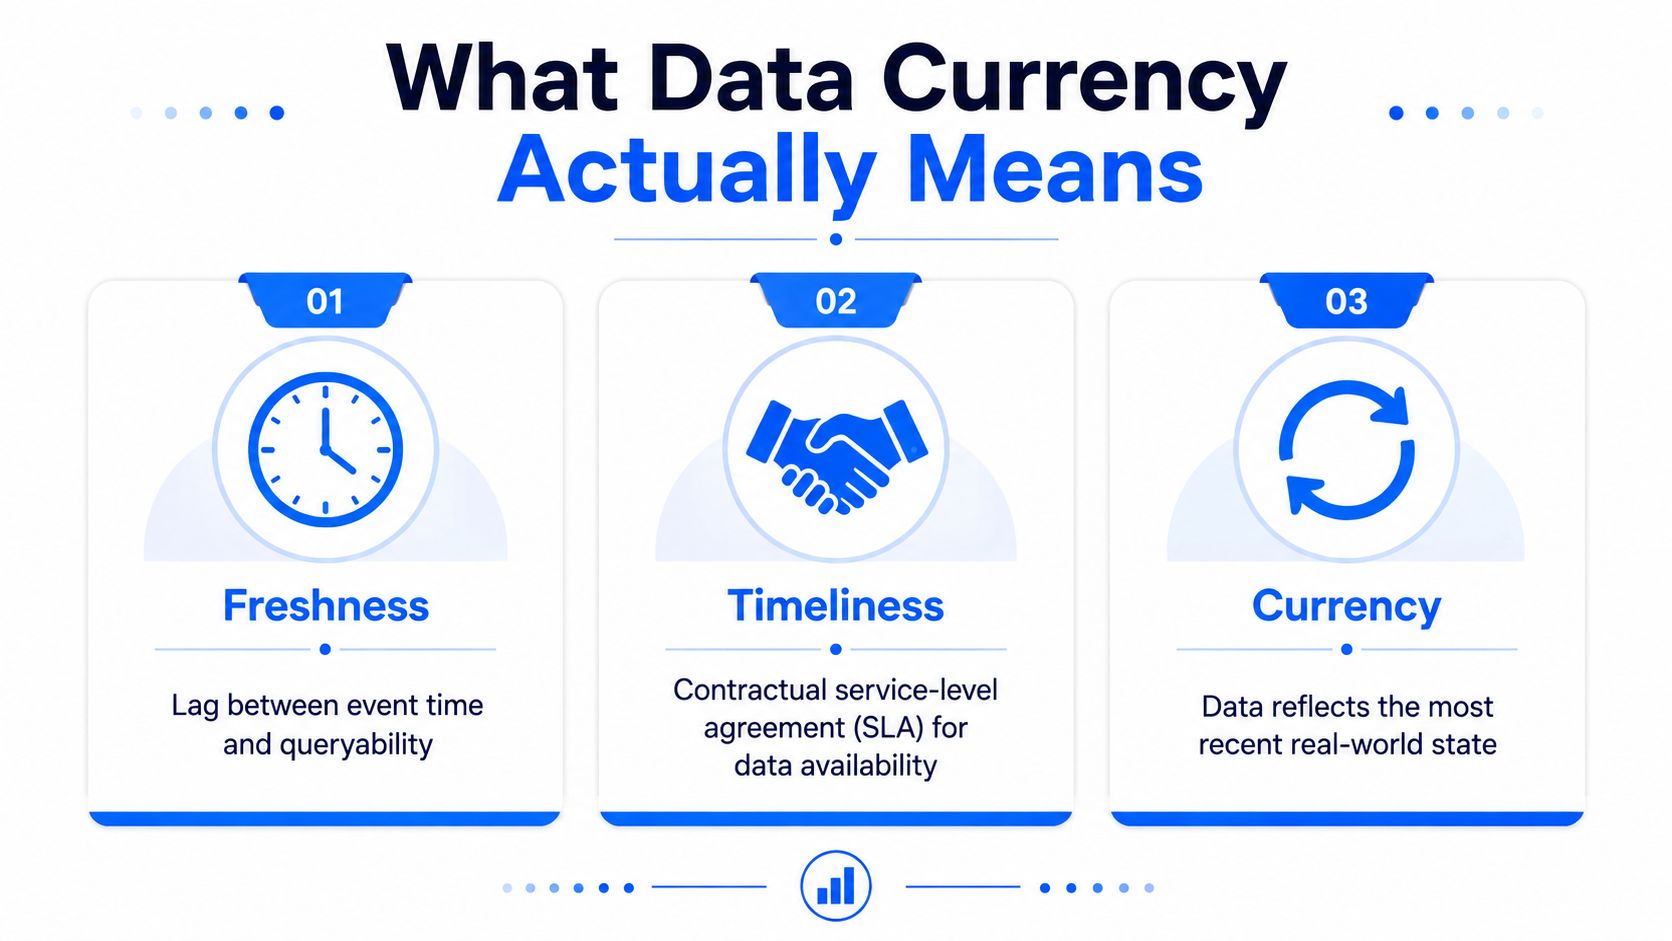
Three terms get mixed together all the time, and the confusion creates bad controls. Freshness is the lag between when something happened and when the record becomes queryable. Timeliness is the expected window a stakeholder accepts for delivery. Currency is the judgment about whether the data still reflects the current state closely enough to use.
A loaf of bread and two different decisions
A loaf of bread can be fresh because it arrived this morning. It can still be the wrong bread for tomorrow's lunch. That's the easiest way to separate freshness from currency, because one describes age and the other describes fit.
A fraud detection feature is a good example. If a transaction feature lags behind the event stream, the model can miss a change in behavior that already happened in the source system. The same feature might still be good enough for a monthly executive revenue summary, where the decision doesn't hinge on minute-by-minute movement. That's why currency is contextual, not absolute.
A useful way to think about it is this. Freshness asks when the data arrived. Currency asks whether the data still deserves to be used. Timeliness asks what the business promised. Those are different questions, and the control should match the question.
If you've only ever looked at a freshness dashboard, the blind spot is easy to miss. A table can be very recent and still be wrong for a specific decision because the source changed after capture. That's why groups that care about data timeliness versus data currency need SLA thinking, not just load monitoring.
Why the same table can be current for one use case and stale for another
A daily finance rollup might be current enough for a weekly planning meeting. The same table would be too stale for a fraud analyst looking for live risk shifts. The data didn't change, the decision did.
The right threshold follows the use case, not the storage layer. That means teams should write down what “current enough” means for each KPI, model input, or report, then enforce that definition consistently. Without that discipline, a single dashboard becomes a substitute for judgment, and that's where confusion starts.
The Three Clocks That Decide If Data Is Current
Event time, ingest time, publish time
Three timestamps usually decide whether a value is current. Event time is when the action happened in the source system. Ingest time is when the record landed in the warehouse. Publish time is when the transformed table became queryable for downstream users.
A package shipping analogy makes the difference obvious. A parcel might be created at 8 a.m., scanned at the warehouse at 2 p.m., and delivered at 6 p.m. Only the final timestamp tells the customer when the package is in hand. Data works the same way, because a record can land in a warehouse long before a consumer can use it.
The useful metric is the gap between event time and publish time. That is the total delay between reality and what downstream users can see. If teams only watch ingest time, they can miss the extra delay created by transformations, semantic layers, or downstream refresh cycles.
Here's the trap. A web event stream backfills event time by two hours, ingest takes twenty minutes, and a dbt run adds another thirty minutes. The pipeline still looks healthy, but the currency gap is three hours. No job failed. The business just made a decision from old reality.
Clock | What it measures | Where it is captured | Contributor to currency gap |
|---|---|---|---|
Event time | When the source action happened | Source system or event payload | Baseline reality timestamp |
Ingest time | When data arrived in storage | Warehouse load metadata | Adds transfer and landing delay |
Publish time | When users can query the transformed data | Semantic layer or curated table | Captures transformation and release delay |
For teams that want a formal monitoring model, data timeliness metrics and how to monitor it is the right conceptual anchor. The important part is that the clock you alert on should match the business delay you care about, not just the one that's easiest to measure.
Operational takeaway: if publish time is late, the data is late, even when ingestion looks perfect.
Setting Tiered Freshness SLAs by Dataset
Different datasets deserve different clocks
Not every table needs real-time delivery, and pretending otherwise creates noisy alerts. A better pattern is to assign tiered freshness SLAs by dataset family, then tie each tier to source, target, and alert windows. That turns “current enough” into something people can enforce.
The structure is simple. A source window defines how late source events can be. A target window defines how late the curated table can be. An alert window defines when the team is notified versus when they are only warned. That split matters because the slowest stage determines actual freshness, even if the upstream job itself finished on time.
Dataset Tier | Source Window | Target Window | Alert Window | Example |
|---|---|---|---|---|
Operational | 15 minutes | 30 minutes | 5 minutes | Orders table used by live support and fulfillment |
Analytical | 4 hours | 6 hours | 30 minutes | Salesforce lead extract used by sales ops |
Regulatory | 24 hours | 24 hours with grace | 2 hours | Finance close table used for compliance and reporting |
Tie the SLA to decision criticality, not system type
A revenue dashboard sits higher than an internal sandbox mart because the decision impact is higher. That sounds obvious, but many teams still set the same freshness expectations for every table in a warehouse. That's how alert fatigue starts.
The right way to govern this is in metadata. Store the SLA in a table, version it when the business changes, and review it with consumers on a quarterly cadence. A contract that never gets revisited eventually becomes fiction, especially when new reports, new sources, or new downstream users appear.
The source window and the target window should be explicit, not implied. If a lead extract can wait four hours at the source and six hours at the target, say that plainly. If the alert window is thirty minutes, define who gets paged, who gets a ticket, and who only gets a warning.
Teams that use dbt source freshness often stop at the check itself, but the value comes from attaching those checks to business tiering. That way, freshness becomes a contract, not a generic metric.
Enforcing Currency at Scale
Three enforcement patterns that fit different jobs
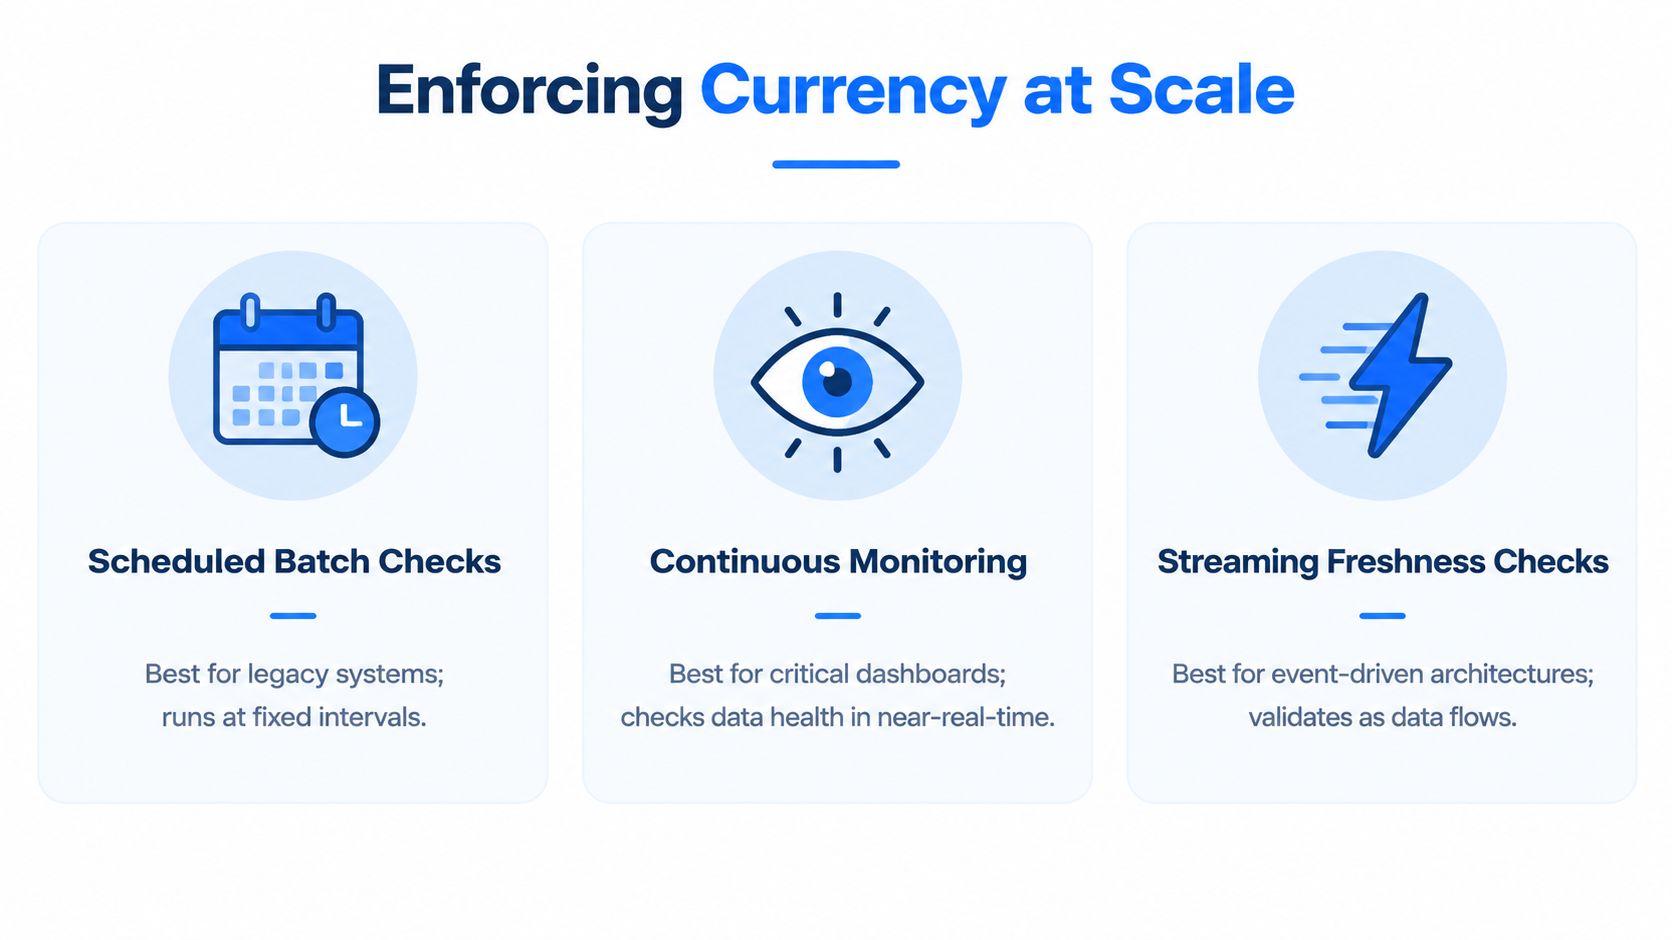
Scheduled batch checks, continuous monitoring, and streaming freshness checks solve different problems. A nightly warehouse scheduler works well for low-cost control runs and compliance-oriented jobs. It's cheap, easy to reason about, and fine when human review happens later.
Continuous monitoring looks at metadata, row counts, and load timestamps on a short tick interval. It catches silent stalls, partial loads, and delayed feeds that batch jobs can miss. That makes it a strong fit for critical dashboards and broad warehouse coverage.
Streaming freshness checks go further by watching event-time watermarks while data flows. They can expose deep lag in near real time, which is useful for high-value journeys, but they also cost more in compute and tooling. The tradeoff is simple, more immediacy usually means more operational overhead.
Good layering pattern: use batch for compliance, continuous monitoring for coverage, and streaming checks for the journeys where delay changes the outcome.
Thresholds that reduce noise
Alerts need a hierarchy, or people will ignore them. A practical pattern is warning at 50% of SLA, critical at 100%, and paging only after a second consecutive breach. That last rule helps suppress flapping when a source recovers briefly and then fails again.
This is also where teams can use tools that watch timeliness, schema shifts, and business metrics together. In practice, that means the same observability layer should show the delay, the load metadata, and the downstream impact in one place. digna is one option that monitors timeliness, schema changes, validation, and business metrics inside the customer's own environment, which fits this kind of layered control model.
The point of enforcement isn't perfection. It's to know when the data has crossed the line from acceptable lag to decision risk, and to notify the right people before the wrong report drives action.
Why Stale Data Is Now an AI Risk Too
AI doesn't wait for someone to notice the numbers look odd
Stale data used to be a reporting problem. Now it's also a model-risk problem. When an AI system consumes outdated inputs, it can generate answers, scores, or recommendations that are technically well-formed and still wrong for the moment.
A churn model is the clearest example. If it retrains weekly but the feature set lags by 48 hours, the model can keep missing the most recent user behavior. The dashboard might still look acceptable to a human reviewer, but the model acts on stale context without hesitation.
That difference matters because humans notice suspicious output. Automated systems don't. A BI analyst might catch a weird spike and ask for a rerun. An agentic workflow, retrieval system, or scoring service can keep moving, which turns currency into a trust issue rather than just a report-quality issue.
The governance angle is getting sharper too. For decisions touching credit, eligibility, and pricing, teams need to know when the data was current at the point of inference, not just when the table last loaded. That's the kind of question auditors and risk reviewers ask because it connects the data state to the decision state.
If you want a concise way to frame the change, think of timeliness as a model-trust primitive. That's the same idea behind stale data meaning, but the consequences are more significant now because more systems act automatically on the result.
Rule of thumb: if an AI system can act faster than a human can question the output, stale input becomes an operational risk, not just a data quality issue.
A Practical Playbook for Fit-for-Purpose Currency
Stop asking every table to be real time
Universal real-time is a bad default. Some datasets need tight freshness, others don't, and forcing every pipeline into the same latency target usually creates cost without better decisions. The better approach is fit-for-purpose currency.
Start by classifying tables by decision impact. Operational data supports fast-moving work, analytical data supports slower decision cycles, and regulatory data often tolerates longer windows because the control objective is traceability and correctness rather than immediacy. Then attach two timestamps to every important dataset, an event-time watermark and a publish-time SLA.
Wire currency checks into the observability layer you already use, instead of building a parallel dashboard no one opens twice. That way, breaches show up next to schema changes, validation failures, and load delays. Review those breaches in the same incident channel as pipeline errors so the response stays consistent.
Classify by impact: assign each table to operational, analytical, or regulatory use based on the decision it supports.
Attach explicit clocks: track event time and publish time together, so you can measure the delay.
Codify the SLA: store the threshold in metadata and version it when consumers or business rules change.
Review breaches together: handle currency incidents in the same workflow as other reliability alerts.
A Monday morning checklist
Open the critical dashboards and ask one question for each one, “current enough for what decision?” Then check whether the SLA is written down, whether the publish lag matches the SLA, and whether the alert path reaches the person who can act. If any of those answers is vague, the control is still ad hoc.
That's the point of treating data currency as a control, not an afterthought. It gives analysts a defensible threshold, gives engineers a measurable delay, and gives governance teams a consistent way to judge when data is no longer safe to use.
If you want to turn currency from a one-off review into a durable control, digna provides an enterprise platform for monitoring timeliness, validation, schema changes, anomalies, and business metrics inside your own environment. Visit digna to see how its observability modules can help your team define current enough, detect stale data earlier, and keep decision-critical datasets aligned with the reality they're supposed to represent.
Frequently asked questions
What does data currency mean?
Whether data is still current enough for the decision in front of you. The useful habit is to stop asking whether data is current and start asking "current for what?", because the answer changes with the decision rather than with the table.
Which three terms get confused?
Currency, freshness and timeliness. Mixing them creates bad controls, because a team that monitors one while believing it has covered all three ends up with a signal that cannot explain the failure it eventually sees.
Why isn't pipeline health the same as decision readiness?
Because a green load check is not a green business decision. A dashboard can load fast, show green status lights and still give a team the wrong answer, since the load succeeded against a source that had not yet moved.
Who needs this distinction most?
Teams in analytics, engineering, finance, healthcare, telecom and public sector environments, where the gap between a technically current table and a decision-ready one shows up daily rather than occasionally.
How do you turn currency into a control?
By binding it to the decision it serves rather than to the load schedule. An SLA expressed as "arrives by 06:00" is a pipeline statement; one expressed as "available before the risk committee meets" is a currency statement.



