How to Measure Data Accuracy: 8 Practical Methods
|
9
min read

Accuracy is measured by comparing data with a trusted expectation or ground truth, then strengthening that comparison with validation, reconciliation, sampling, anomaly detection, and historical analysis. For critical datasets, one practical benchmark defines accuracy as correct records ÷ total records × 100, with a suggested target of at least 98% for critical data, although the right threshold depends on business risk and use case (Acceldata's practical framework).
The popular advice is to run a few null checks, confirm that dates use the right format, and call the dataset accurate when the pipeline turns green. That approach measures completeness and validity, not necessarily truth. A customer address can be complete and correctly formatted while still being wrong. A transaction amount can pass technical validation and differ from the amount charged. A date such as 31 December 2099 can be syntactically valid but inaccurate as a customer's date of birth.
Data Accuracy is the degree to which data correctly represents the world object, event, or value it describes. The required level depends on intended use. A small discrepancy may be tolerable in exploratory analysis but unacceptable in financial reporting, healthcare records, regulatory data, or an automated decision.
A rigorous assessment separates bias, precision, uncertainty, validity, reasonableness, timeliness, and structural change. Measurement science describes accuracy through closeness to a true or reference value, while bias reflects systematic deviation and precision reflects the spread of repeated measurements (National Physical Laboratory guidance). The methods below treat accuracy as accumulated evidence that data reflects reality, not as one universal score.
Table of Contents
1. Comparison Against Trusted Data Sources
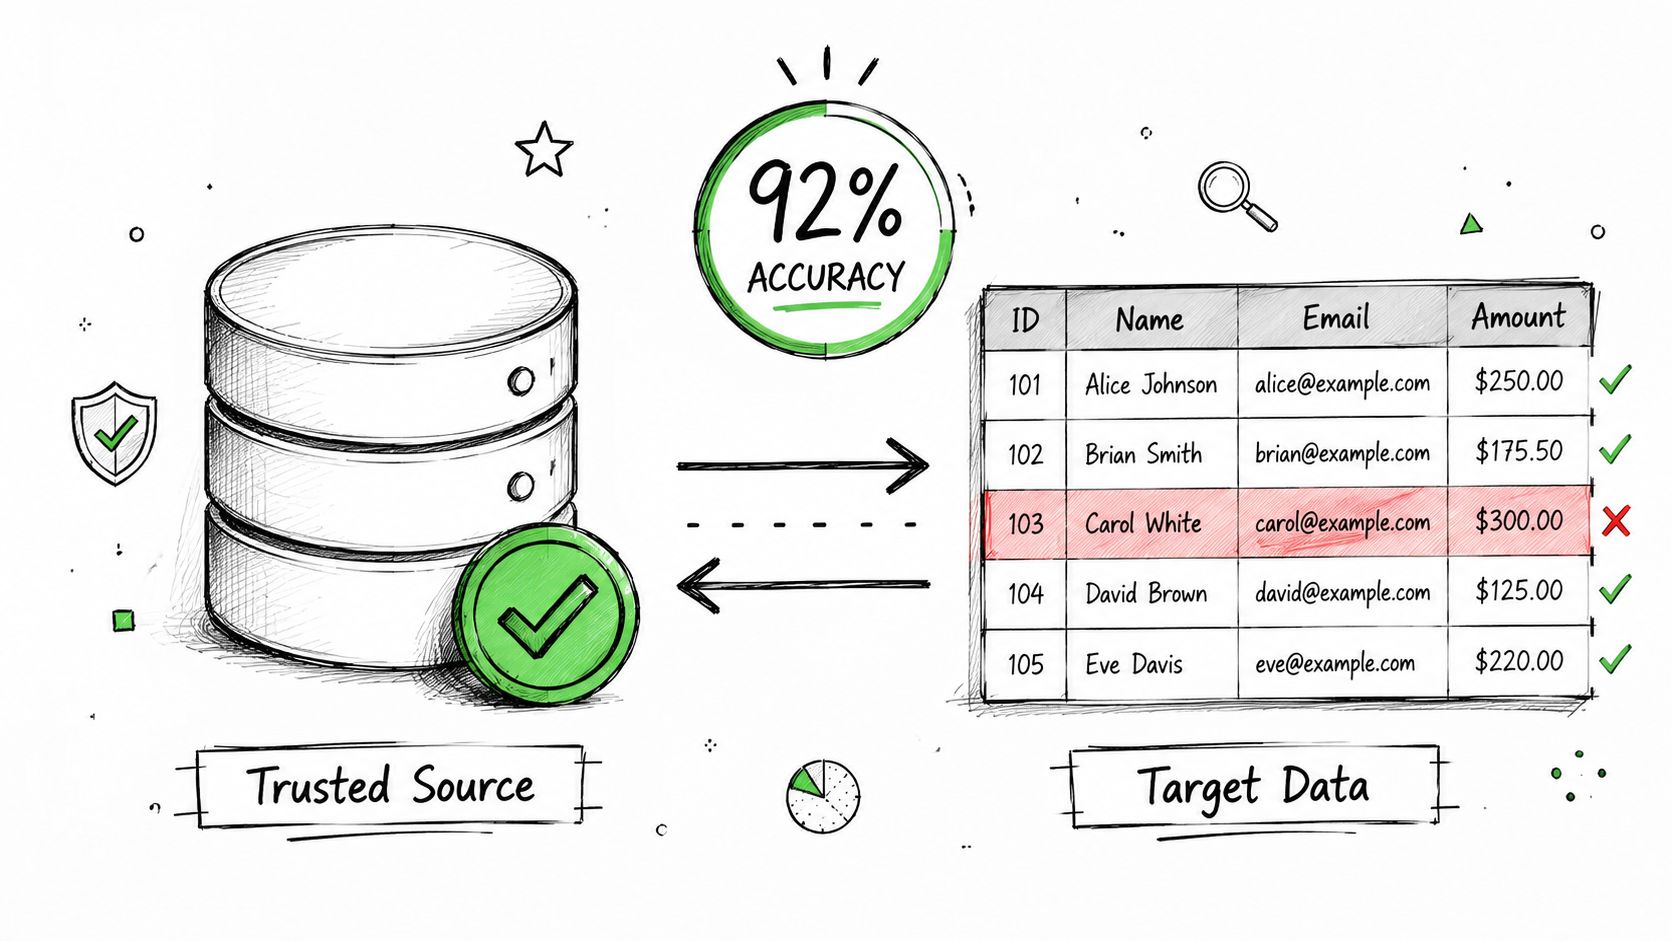
Direct comparison provides the strongest initial evidence when a source has defined authority and controls. A warehouse dataset can be checked against a master customer database, an analytics price against an approved pricing system, and a reporting amount against a verified transaction log. The question is specific: does the recorded value match the reference used to represent the expected object, event, or value?
A basic measure is:
Accuracy rate = correctly matching records ÷ records assessed × 100
This rate has meaning only after the team defines “matching.” Exact equality may suit a transaction identifier or approved product price. An address may require normalization, while a status field may need an effective-date rule because systems update at different times. The result therefore measures agreement under a stated comparison method, not accuracy in every possible sense.
Define the reference before calculating
Record the trusted source, owner, update frequency, fields in scope, matching key, and acceptable timing window. A warehouse load that briefly trails a master system may reflect normal processing latency rather than an incorrect value. A reference can also contain stale or biased records, so its authority should be supported by controls rather than assumed.
Practical rule: A comparison proves agreement with the selected reference. It does not prove that the reference itself represents the underlying object, event, or value unless that source has its own quality controls.
Applications include:
Customer identity: Compare warehouse addresses with the master CRM record, and record whether matching is exact, normalized, or effective-date based.
Financial reporting: Compare transaction amounts in a reporting database with the source banking system.
Product governance: Verify analytics prices against the approved pricing reference.
Customer lifecycle: Check status fields against authoritative business records.
Teams can use digna Data Reconciliation to automate recurring source-to-target comparisons, investigate failed matches, and track whether discrepancies are isolated or persistent. Set acceptance thresholds according to business consequences. A perfect match is not always required, while a small mismatch may be unacceptable for a high-impact field.
2. Business Rule Validation
Business rules convert an accuracy expectation into a deterministic test. An invoice total should equal its line items plus tax. A customer discount should remain within the limit for that customer tier. A product's cost should not exceed its approved selling price. Each rule produces auditable evidence that a defined relationship holds.
The method is useful because its scope is explicit. A failed check identifies the expectation that was violated and often isolates the affected record, field, or transformation. Rule validation fits critical fields, compliance controls, calculated metrics, and relationships that can be evaluated without subjective judgment.
A passing rule proves conformance to the logic encoded in that rule. It does not establish that the underlying value reflects reality. An internally consistent invoice may still show the wrong amount charged, and a non-negative inventory quantity may still differ from the physical count. As illustrated by odometer fraud detection advice, passing format checks does not guarantee that a value reflects the world condition.
Design rules with people who understand the process they represent. For each rule, document the protected fields, business rationale, failure response, and conditions under which an exception is legitimate. Test the rules against historical records to establish expected behavior, then review them when products, policies, statuses, or transformations change.
digna Data Validation supports record-level checks using values, ranges, thresholds, reference data, and business conditions. Teams can use those checks to enforce explicit expectations at scale while retaining failure details for investigation.
A practical control set should give priority to:
Critical metrics: Start with revenue, balances, regulated fields, and operational measures.
Business ownership: Have domain stakeholders approve rules and documented exceptions.
Traceable outcomes: Store failed records, exact failure reasons, rule versions, and investigation status.
Layered coverage: Combine deterministic validation with trusted-source comparison and anomaly signals.
Rule coverage should be monitored as part of the pipeline, not treated as finished configuration. A rule can continue executing successfully while becoming incomplete because the business process has changed. That limitation is why validation contributes one class of evidence within a broader accuracy monitoring strategy.
3. Cross-System Reconciliation
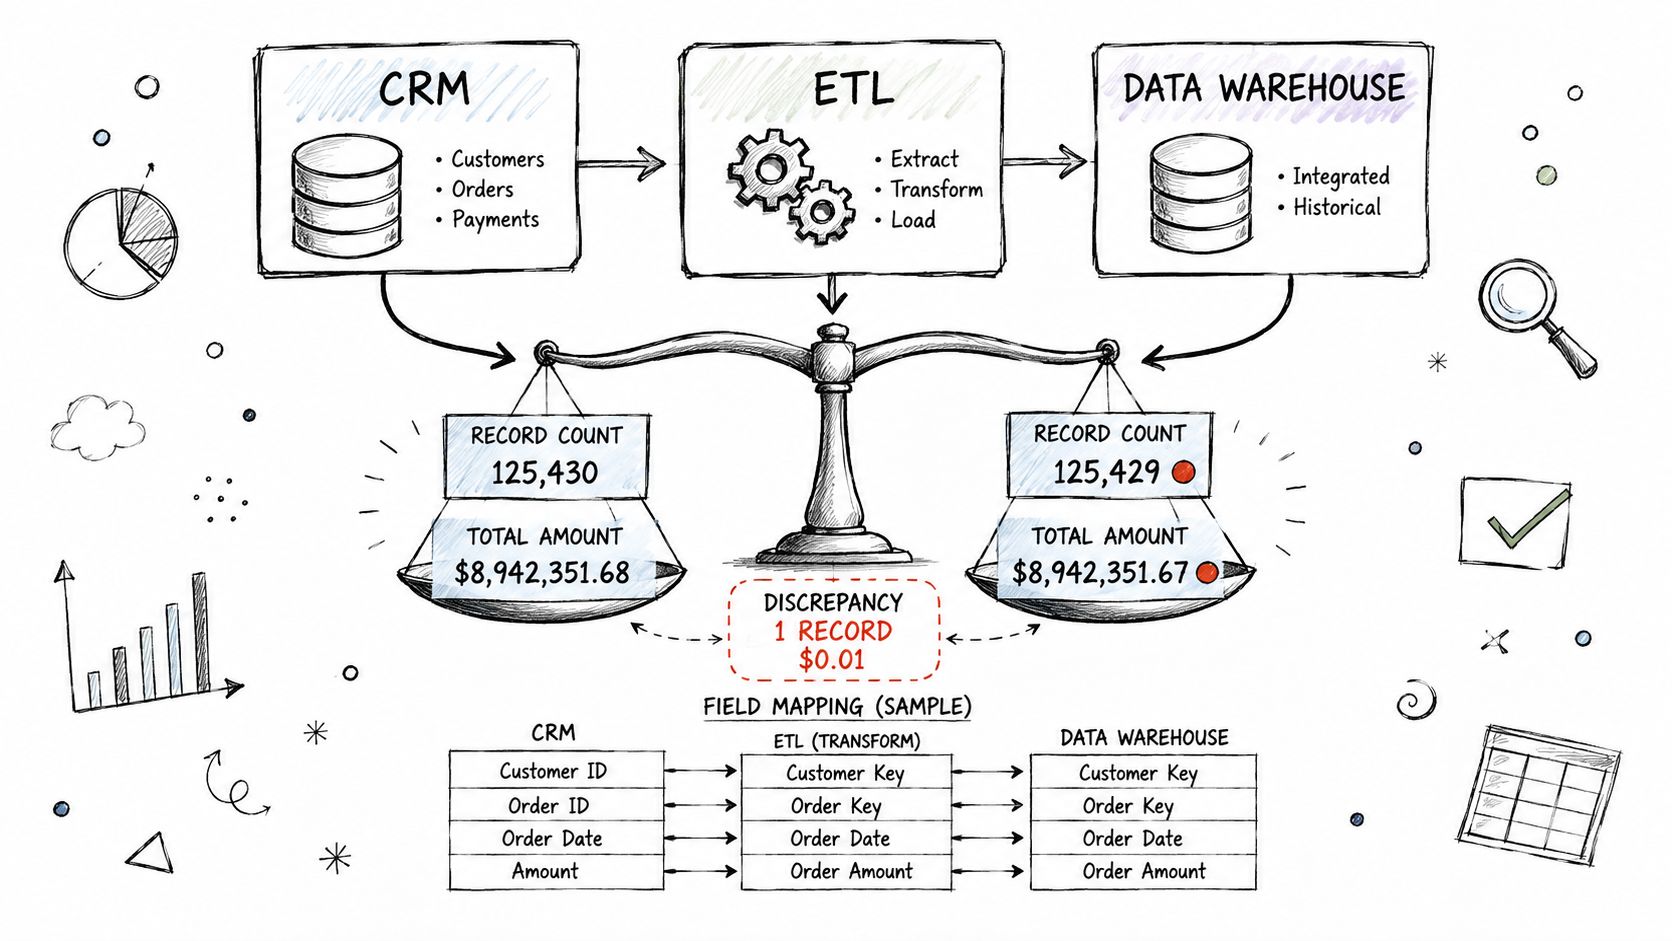
Cross-system reconciliation tests whether a transformation preserved the information required downstream. It compares records between a source and target system, rather than checking whether individual fields use valid formats. The comparison can cover counts, aggregates, business metrics, and statistical profiles.
A financial pipeline shows why this matters. The source may hold transaction records while a warehouse stores transformed reporting data. Both systems can contain valid dates and non-null amounts, yet the warehouse total may differ because records were filtered, duplicated, truncated, or transformed incorrectly.
Reconciliation should operate at several levels. Record-level checks identify missing or unexpected entities. Aggregate checks compare transaction totals, revenue, balances, or other approved measures. Profile checks examine distributions and value frequencies that a single total could hide.
Set a reconciliation window that allows for known latency and processing delays. Define tolerances, alert conditions, ownership, and resolution steps before discrepancies occur. A difference beyond tolerance should create an investigation record with enough context for diagnosis.
Useful controls include:
Counts: Compare source and target record numbers after applying documented filters.
Aggregates: Compare sums, averages, and other approved business metrics.
Coverage: Confirm that expected invoice or customer records reach downstream systems.
Trend behavior: Track recurring differences to separate isolated incidents from systemic transformation defects.
Use digna Data Reconciliation to support regular comparisons across source and target datasets. The result is evidence of consistency, not proof that every value is accurate. A source can be outdated or wrong, and matching totals can conceal offsetting errors. Document which system supplies the trusted expectation and when each system should be current, then combine reconciliation results with validation, anomaly signals, and human review.
4. Statistical, Historical Analysis and Anomaly Detection
A value can satisfy every predefined rule and still behave unlike the process it represents. Statistical and historical analysis adds context by examining distributions, trends, volatility, timing, and recurring deviations. Anomaly detection extends that approach by identifying unexpected changes that teams may not have encoded as rules.
Suppose the average transaction value increases by 300% overnight. That doesn't prove the data is wrong. The change could reflect a legitimate pricing decision, a large customer purchase, or a business event. It does create a high-priority signal because the observed behavior differs sharply from the established pattern.
Investigate deviations, don't label them automatically
Useful signals include sudden changes in customer age distributions, unusual product price variance, unexpected transaction-count changes, and revenue patterns that depart from historical behavior. Teams should monitor counts, aggregates, distributions, and timing together because an isolated metric can conceal the shape of a problem.
digna's statistical methods for data analysis can support analysis of trends, volatility, and historical behavior. AI-driven baseline learning can help surface deviations without requiring every threshold to be configured manually, but the baseline still needs operational context.
An anomaly is evidence that behavior changed. It isn't evidence, by itself, that the changed value is inaccurate.
Start with a warm-up period that gives the system enough historical behavior to model normal variation. Adjust sensitivity during known campaigns, migrations, seasonal events, or system upgrades. Record the explanation when an anomaly is legitimate. That decision improves future triage and prevents teams from treating every unusual observation as a data defect.
Statistical analysis also helps distinguish accuracy from uncertainty. The Food and Agriculture Organization explains that analytical accuracy cannot be quantified directly and involves random and systematic error, while standard errors and confidence intervals communicate uncertainty around measurements (FAO data-quality methodology). A stable pattern can still be systematically biased.
5. Reference Data Comparison
Reference data comparison tests whether a field matches an approved external list, master table, or controlled vocabulary. It provides evidence of validity, especially for categorical and dimensional fields, but it does not by itself establish accuracy. A value may follow the expected format and still be inappropriate for the business context.
For example, a country field can contain a correctly formatted two-letter code that is not accepted. A product category may be populated and unique while pointing to an obsolete branch of the product hierarchy. A department code can exist in a record even after the department has been removed from the organization's master data.
Preserve the applicable reference state
Reference data changes. Currency lists, tax rates, product hierarchies, organizational structures, and status tables can add, remove, or rename values. Store the reference version and effective date used for each validation. Otherwise, historical records may be judged against a later business state, producing false failures or hiding legitimate discrepancies.
Apply the check to fields such as:
Country codes: Compare customer values with the ISO 3166 country-code standard.
Product taxonomy: Match category codes to the approved hierarchy.
Currencies: Validate transaction currency codes against an official currency list.
Organization structure: Compare employee department codes with current master data.
Statuses: Check transaction status values against the defined status table.
The result proves that a value matches an accepted reference. It does not prove that the reference is appropriate for the transaction date, or that the source record reflects reality. Add effective dates, documented exceptions, and audit trails when reference data supports regulated reporting.
Reference comparison also strengthens business-rule validation. A rule may require a department to exist, while the reference check determines whether its code is approved. If the reference changes, update the control and record the change. This keeps the validation layer aligned with the business instead of treating an outdated lookup as evidence of accuracy.
6. Sampling and Manual Verification
Automated checks are efficient, but manual verification exposes error types that rules and comparisons can miss. Teams select representative records and verify them against invoices, source systems, customer confirmation, research, or other evidence of the actual-world state.
A sample might include customer records whose addresses are checked against authoritative business records, transaction records compared with source invoices, or suspicious product prices reviewed against approved documents. The result isn't just a pass rate. It also reveals whether errors come from stale data, transformation logic, human entry, source-system defects, or an unclear definition of truth.
Design the sample deliberately
Random selection can estimate general conditions, while stratification ensures that high-risk or high-value records receive attention. Document the population, selection method, verification evidence, reviewer, date, decision criteria, and error classification. Statistical sampling methods can help determine an appropriate sample size, but the method should match the risk and intended use.
Manual verification should validate the automated control, not merely repeat it.
Use sampling to challenge the assumptions behind automated accuracy rates. If a source comparison reports strong agreement, manual checks can test whether the supposed source is current and authoritative. If anomaly detection flags unusual records, targeted review can determine whether those records reflect legitimate business events.
Human review also creates qualitative evidence. Reviewers may discover that “correct” depends on effective dates, customer consent, geographic conventions, or business exceptions that weren't represented in the data model. Those findings should feed back into rules, reference data, reconciliation logic, and monitoring thresholds.
Sampling is labor-intensive, so schedule it around critical datasets and known risk areas. Track recurring error patterns rather than treating each reviewed record as an isolated event. Over time, the organization learns which automated checks deserve expansion and which signals generate too many legitimate exceptions.
7. Completeness and Timeliness as Accuracy Indicators
Accuracy is evidence that delivered data reflects reality. Completeness and timeliness do not prove that individual values are true, but they test whether the dataset represents the relevant population at the required moment. Missing records, omitted critical fields, or delayed loads can make correct values unsuitable for their intended use.
A daily transaction dataset may contain accurate records yet arrive after the reporting deadline. The report then describes only the records received, not the business state available when decisions were required. A customer master load that excludes newly created customers creates an accurate partial view and can mislead downstream analysis.
Track coverage and delivery as separate operational signals:
Arrival behavior: Compare delivery times with the established schedule to identify late, missing, or unexpectedly early loads.
Coverage: Compare delivered records with the expected population or trusted source count.
Critical fields: Measure population for fields used in joins, calculations, eligibility decisions, or regulatory outputs.
Change points: Investigate abrupt coverage shifts after a source, schema, or pipeline change.
Define acceptable gaps before monitoring begins. A late incremental load may be expected during planned maintenance, while an unexplained delay can indicate a source or pipeline failure. Coverage checks also need a clear denominator. A record count alone cannot show whether the missing population is concentrated in a high-impact segment.
digna's Timeliness capability monitors arrival patterns and expected delivery times. Schema Tracker detects structural changes, including added or removed columns and modified data types. These signals do not establish value-level truth. They can, however, identify when a previously reliable accuracy process may no longer be safe, prompting source comparison, rule validation, or targeted review.
Data-quality guidance places accuracy alongside completeness, consistency, reliability, and timeliness (Canadian government data-quality guidance). Treating these dimensions together gives teams stronger evidence of data fitness: values should be correct, coverage should match the intended population, and information should arrive in time to support its use.
8. Integrated Multi-Method Accuracy Monitoring Strategy
The strongest operating model combines the methods rather than asking one score to carry the entire burden. Trusted-source comparison tests agreement with an expected state. Business validation tests explicit logic. Reconciliation tests movement across systems. Anomaly detection and historical analysis test behavior. Sampling tests whether automated assumptions survive contact with real evidence.
A financial reporting pipeline shows how the layers work together. The source system contains transaction data, and the warehouse supports reporting. Required fields are populated and the pipeline completes, but the warehouse total differs from the trusted source.
The investigation can proceed as follows:
Reconcile source and target metrics to identify the discrepancy and its scope.
Validate business rules for transaction amounts, dates, identifiers, and calculated fields.
Inspect anomalies to determine whether the affected values or counts changed unexpectedly.
Use historical analytics to identify when the deviation began and whether it recurs.
Sample selected records against source evidence to classify the error.
Check timeliness and schema changes for late loads, structural changes, or altered pipeline behavior.
Map methods to risk
Healthcare data may need completeness monitoring, reference validation, anomaly detection, and periodic manual review. Telecom billing may require revenue reconciliation, charge rules, usage-pattern analysis, and structural-change monitoring. Public-sector data may require traceable reference versions, repeatable validation, and audit-ready investigation records.
Use business impact to decide where to begin. Map each critical data element to its trusted expectation, rules, reconciliation checks, behavioral signals, sampling plan, and escalation path. Correlating findings across methods helps teams distinguish a local bad record from a pipeline-wide failure.
A platform such as digna can bring Data Validation, Data Reconciliation, Data Anomalies, Data Analytics, Timeliness, and Schema Tracker into a shared monitoring workflow. The platform runs in the customer's environment and performs analysis in-database, which supports data remaining in place while engineers, analysts, and governance teams review incidents and trends.
8-Method Comparison: Measuring Data Accuracy
Method | Implementation Complexity 🔄 | Resource Requirements & Maintenance ⚡ | Expected Outcomes 📊⭐ | Ideal Use Cases 💡 | Key Advantages ⭐ |
|---|---|---|---|---|---|
Comparison Against Trusted Data Sources | Medium, mapping and match logic; maintain trusted source | Moderate, compute for large sets; ongoing source upkeep | High, measurable accuracy rates; clear mismatch evidence | Structured data with authoritative masters (CRM, pricing, finance) | Objective, scalable, field-level mismatch identification |
Business Rule Validation | Low–Medium, formalize and version rules | Low–Medium, rule authoring and stakeholder maintenance | Clear pass/fail audits; strong compliance evidence | Regulated processes and deterministic checks (invoices, discounts) | Auditable, efficient at finding systematic rule violations |
Cross-System Reconciliation | Medium–High, mapping, timing windows, pipeline knowledge | Medium, integrations, scheduled comparisons, compute | Detects data loss/corruption; validates end-to-end integrity | Multi-system ETL pipelines, financial and reporting systems | Reveals transformation/transfer errors with remediation evidence |
Statistical, Historical Analysis & Anomaly Detection | Medium, baseline learning and model tuning | Low–Medium, historical data, analytics expertise | Surfaces outliers, trends, and gradual degradation signals | Trend monitoring, early-warning on novel issues, new datasets | Adaptive detection of issues rules/reference checks miss |
Reference Data Comparison | Low, lookup-based checks; manage reference versions | Low–Medium, reference data management and updates | Ensures categorical/dimensional consistency and comparability | Standard codes/masters (ISO codes, tax rates, product hierarchies) | Enforces standards; prevents aggregation/classification errors |
Sampling and Manual Verification | Low complexity but high operational effort 🔄 | High, labor-intensive, trained staff, limited scale ⚡ | Qualitative, high-confidence evidence for sampled records 📊 | Audits, validation of automated checks, regulatory proof | Finds error types automated methods miss; root-cause context |
Completeness & Timeliness as Accuracy Indicators | Low–Medium, define schedules and baselines 🔄 | Low, monitoring tools; set thresholds; optional AI scheduling ⚡ | Early warning of missing/delayed data; improves data trust 📊 | Pipelines with SLAs, operational reporting, time-sensitive data | Proactive detection of pipeline delivery issues |
Integrated Multi-Method Accuracy Monitoring Strategy | High, coordinate multiple techniques and tuning 🔄 | High, multiple modules, integration, ongoing maintenance ⚡ | Comprehensive coverage, faster incident response, audit-ready 📊⭐ | Critical domains (finance, healthcare, telecom, public sector) | Multiple lines of evidence; catches diverse accuracy scenarios |
Turn Accuracy Checks Into Continuous Evidence
No single accuracy score proves that data reflects reality in every context. A percentage of matching records can conceal a biased reference source. A validation score can show that records follow business rules while missing a transformation defect. A reconciliation can expose a discrepancy without explaining whether the source, target, or timing window is responsible.
The practical answer is to build a chain of evidence. Start by defining the intended use and the level of error the business can accept. Establish the trusted expectation, whether that means a master system, approved reference data, a verified transaction log, or a documented real-world observation. Then define what constitutes a match and record the timing, version, ownership, and exceptions behind that decision.
Encode the most important expectations as deterministic rules. Rules should protect critical metrics, compliance obligations, relationships, and calculations. Test them against historical data, retain failed records and exact failure reasons, and revise them as products, policies, schemas, and business processes change.
Reconcile source and target metrics at the points where data moves. Compare counts, aggregates, coverage, and profiles, while allowing for known processing latency. A discrepancy is not automatically proof that the target is inaccurate, but it is evidence that the pipeline requires investigation.
Use anomaly detection and historical analysis to supply context that explicit checks can't provide. A sudden shift may reveal a source-system error, a broken transformation, schema drift, or a legitimate business event. Analysts should document the explanation, not just close the alert. That history improves future triage and helps teams tune baselines without suppressing meaningful changes.
Manual verification remains important for high-risk data and for testing whether automated controls measure the right thing. Sampling can uncover systematic bias, unclear reference definitions, and error categories that no existing rule captures. Treat the findings as input into the monitoring design.
Timeliness, completeness, and schema changes act as early warnings. A late or partial dataset may be accurate for the records it contains but unreliable for the decision it supports. A structural change can invalidate downstream logic without producing an obvious field-level error. Monitoring these indicators alongside accuracy checks gives teams a more realistic view of data fitness.
digna supports this evidence-based workflow through Data Validation, Data Reconciliation, Data Anomalies, Data Analytics, Timeliness, and Schema Tracker. Teams can begin with high-impact datasets, set business-based thresholds, document investigations, and expand coverage as requirements and observed risks evolve.
Independent user evidence also shows why technical measurement should be paired with stakeholder perception. In a 2023 user survey, 72% of users rated statistical data accuracy as good or very good, with an average score of 4.03, while another survey reported only 29.39% satisfaction with data quality (Results of the 2023 User Satisfaction Survey). The contrast demonstrates that a technically acceptable dataset and a trusted dataset aren't always the same thing.
Measure agreement with reality, test the logic that supports it, investigate behavioral change, and preserve the evidence behind every decision. That is how data teams move from a green pipeline indicator to data they can responsibly use.
digna provides in-environment data quality and observability through Data Validation, Data Reconciliation, Data Anomalies, Data Analytics, Timeliness, and Schema Tracker. Visit digna to see how your team can turn data accuracy checks into continuous evidence across warehouses, lakes, and pipelines.
Frequently asked questions
How is data accuracy measured?
By comparing data with a trusted expectation or ground truth, then strengthening that comparison with validation, reconciliation, sampling, anomaly detection and historical analysis. No single method carries the whole judgement.
What is a practical accuracy benchmark?
Correct records divided by total records, times 100, with a suggested target of at least 98% for critical data. The right threshold still depends on business risk and use case rather than on the number itself.
Why isn't a green pipeline evidence of accuracy?
Because syntax is not truth. A date such as 31 December 2099 can be syntactically valid and still be an inaccurate customer date of birth, so null checks and format checks confirm shape while saying nothing about correctness.
Which properties should a rigorous assessment separate?
Bias, precision, uncertainty, validity, reasonableness, timeliness and structural change. Collapsing them into one accuracy score hides which of them actually moved, and they call for different corrective actions.
When is direct comparison the strongest evidence?
When a source has defined authority and controls. Comparing against a trusted system gives the firmest initial answer, and sampling, reconciliation and anomaly detection cover the ground where no such authority exists.



