10 Bigeye Alternatives for Data Observability
|
7
min read

Choosing a Bigeye alternative based on anomaly detection alone repeats the problem buyers are trying to solve. Most established platforms can identify unusual volume, freshness, schema, or distribution behavior. They differ more sharply in where checks run, how teams validate records, how lineage and pipelines are covered, how alerts enter operational workflows, how pricing scales, and how much infrastructure control the customer retains.
That distinction matters because observability teams still spend substantial time reacting after users encounter bad data. A survey of data management leaders found that only 7% resolve data issues before users are impacted, while 39% spend 20–40% of their time fixing pipeline problems. The same research found that 51% need a few hours and 36% need a few days or more to resolve a single incident, making prevention, investigation speed, and deployment fit more important than a long feature list. (CDO Magazine's summary of the Kensu report)
The comparison below evaluates ten Bigeye alternatives against practical enterprise criteria: data location, anomaly coverage, validation, timeliness, schema monitoring, deployment, pricing signals, and migration effort. It also maps each option to digna's modular capabilities, so teams can distinguish a broad SaaS observability suite from an in-database platform designed for private cloud, VPC, or on-premises operation.
Table of Contents
1. digna
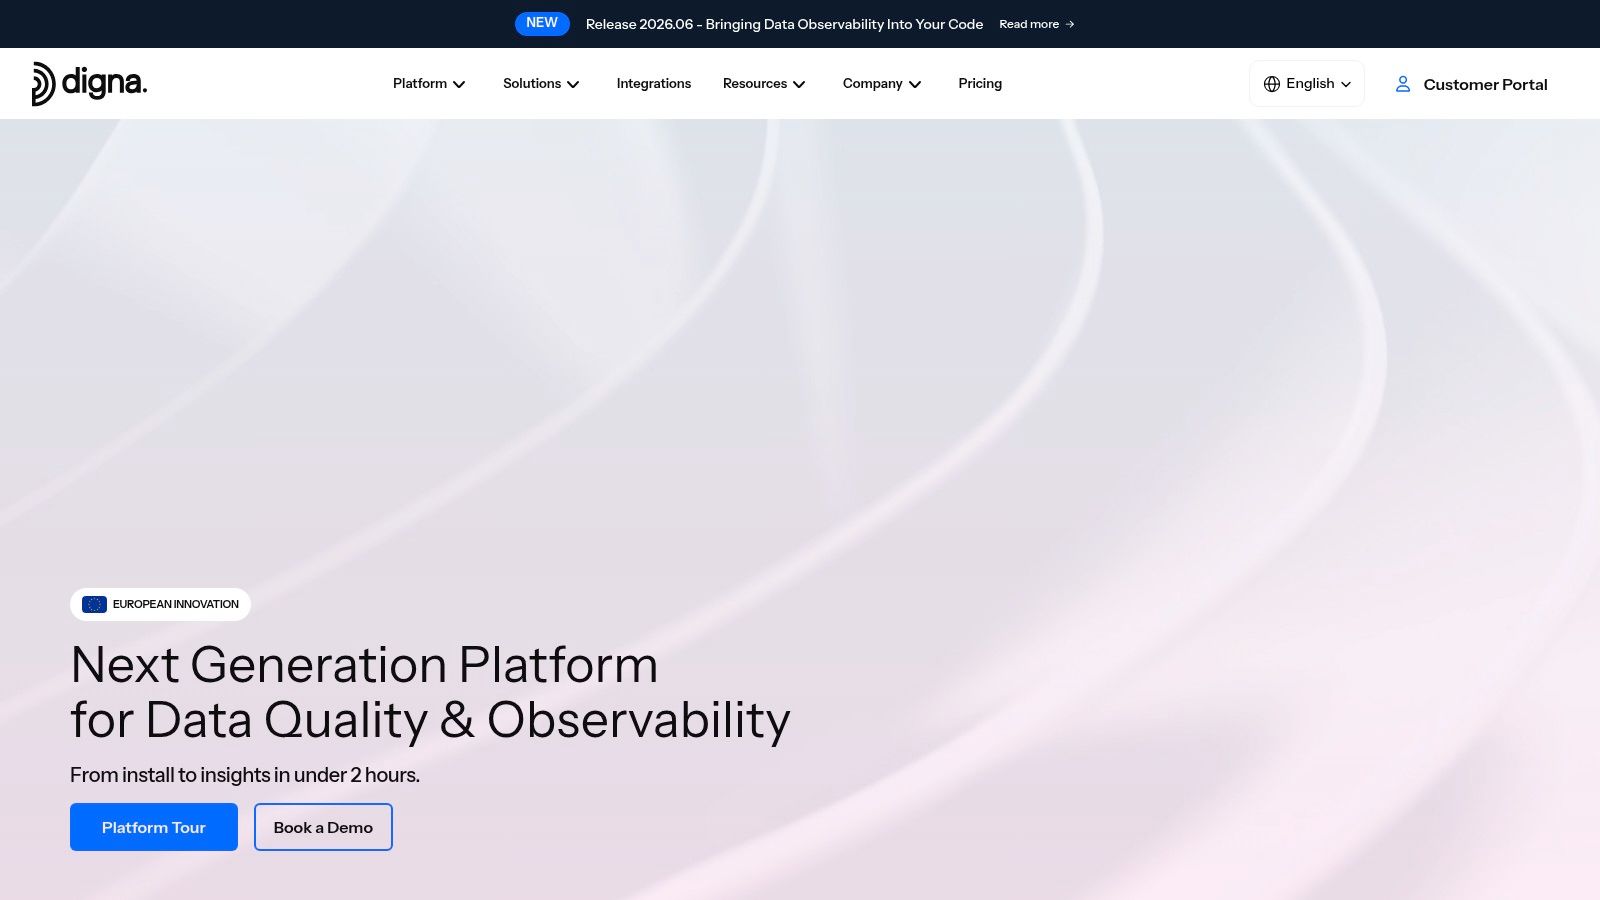
digna is the strongest choice when deployment control and data residency sit alongside observability coverage. It runs inside the customer's own environment, including a private cloud, VPC, or on-premises data center, and performs metric computation and checks inside the customer's databases. That architecture keeps production data in place, reduces unnecessary movement, and supports governance requirements for sensitive financial, healthcare, telecommunications, and public-sector data. Guidance on in-database monitoring supports this model because checks can run where the data lives instead of copying sensitive records elsewhere. (Digna's data quality monitoring guidance)
The platform combines automatic detection with deterministic controls. Data Anomalies learns normal behavior and continuously identifies unusual changes without requiring teams to write every monitoring rule. Timeliness learns expected delivery patterns and flags missing, late, or early arrivals. Data Validation applies record-level business rules, while Schema Tracker detects structural changes such as added or removed columns and modified data types. Data Analytics adds historical trend and volatility analysis, which helps teams separate a one-time event from a worsening reliability pattern.
Where digna fits best
digna's modular design lets a team begin with one capability and expand as its operating model matures. The scheduler, data catalog, integrations, and collaboration features are available from the initial module selection, and a shared dashboard gives data engineers, analysts, and stakeholders a common view of incidents, trends, and status. The vendor states that installation to first insights takes under two hours, a claim that should still be tested against the buyer's permissions, database topology, and security review.
Pricing uses a base fee plus a per-active-table, per-module charge. The model has no API, scan-volume, or alert-volume fees, which gives procurement a clearer usage signal than pricing that changes with every query or notification. The trade-off is that a very large table footprint can require careful sizing, and private deployment places infrastructure, permissions, and maintenance responsibilities with the customer.
Practical rule: Choose digna when keeping data inside your environment is a first-order requirement, then validate total cost against active tables and selected modules before signing.
See the digna data observability platform for the architecture and module model.
Pros: In-database execution, private deployment, AI-driven anomaly and timeliness monitoring, record-level validation, schema tracking, shared workflows, and modular licensing.
Cons: Per-active-table, per-module pricing needs sizing for large estates, and private deployment requires internal operational ownership.
2. Monte Carlo Data
Monte Carlo Data is a broad observability suite for organizations monitoring warehouses, lakes, ETL systems, BI assets, and AI or agent pipelines. Its automated monitors cover freshness, volume, schema, and distribution, while machine-learning-based anomaly detection identifies changes from expected behavior. Column-level and dashboard-level lineage connect incidents to downstream assets, helping teams assess impact beyond the affected table.
The platform also supports operational response. Incident triage and alert routing to Slack, Jira, and related tools connect detection with ownership and remediation. This makes Monte Carlo a candidate for large modern data stacks with many connectors and established workflows. Buyers should verify that lineage reaches the specific columns, dashboards, and pipeline stages used by their teams.

The trade-off against in-database control
Monte Carlo's differentiator is operational breadth. digna takes a different approach by running checks inside customer databases and combining anomaly detection with timeliness, validation, schema tracking, and historical analytics through a modular interface. The decision therefore depends on the operating model: Monte Carlo suits teams prioritizing lineage and ecosystem coverage, while digna suits teams requiring data to remain in their environment.
Deployment and migration require their own proof of concept. Teams should test connector coverage, lineage accuracy, alert ownership, validation rules, and the effort required to translate existing Bigeye monitors. Monte Carlo pricing is not publicly shown, so procurement should request a quote based on monitored scope and integration requirements.
Pros: Broad connector coverage, end-to-end lineage, incident workflows, and enterprise-scale scope.
Cons: Pricing is quote-led, and the breadth may exceed the immediate needs of a smaller team.
Review this Monte Carlo enterprise data observability alternative to compare its architecture and modular approach with Monte Carlo's broader operating model.
3. Acceldata
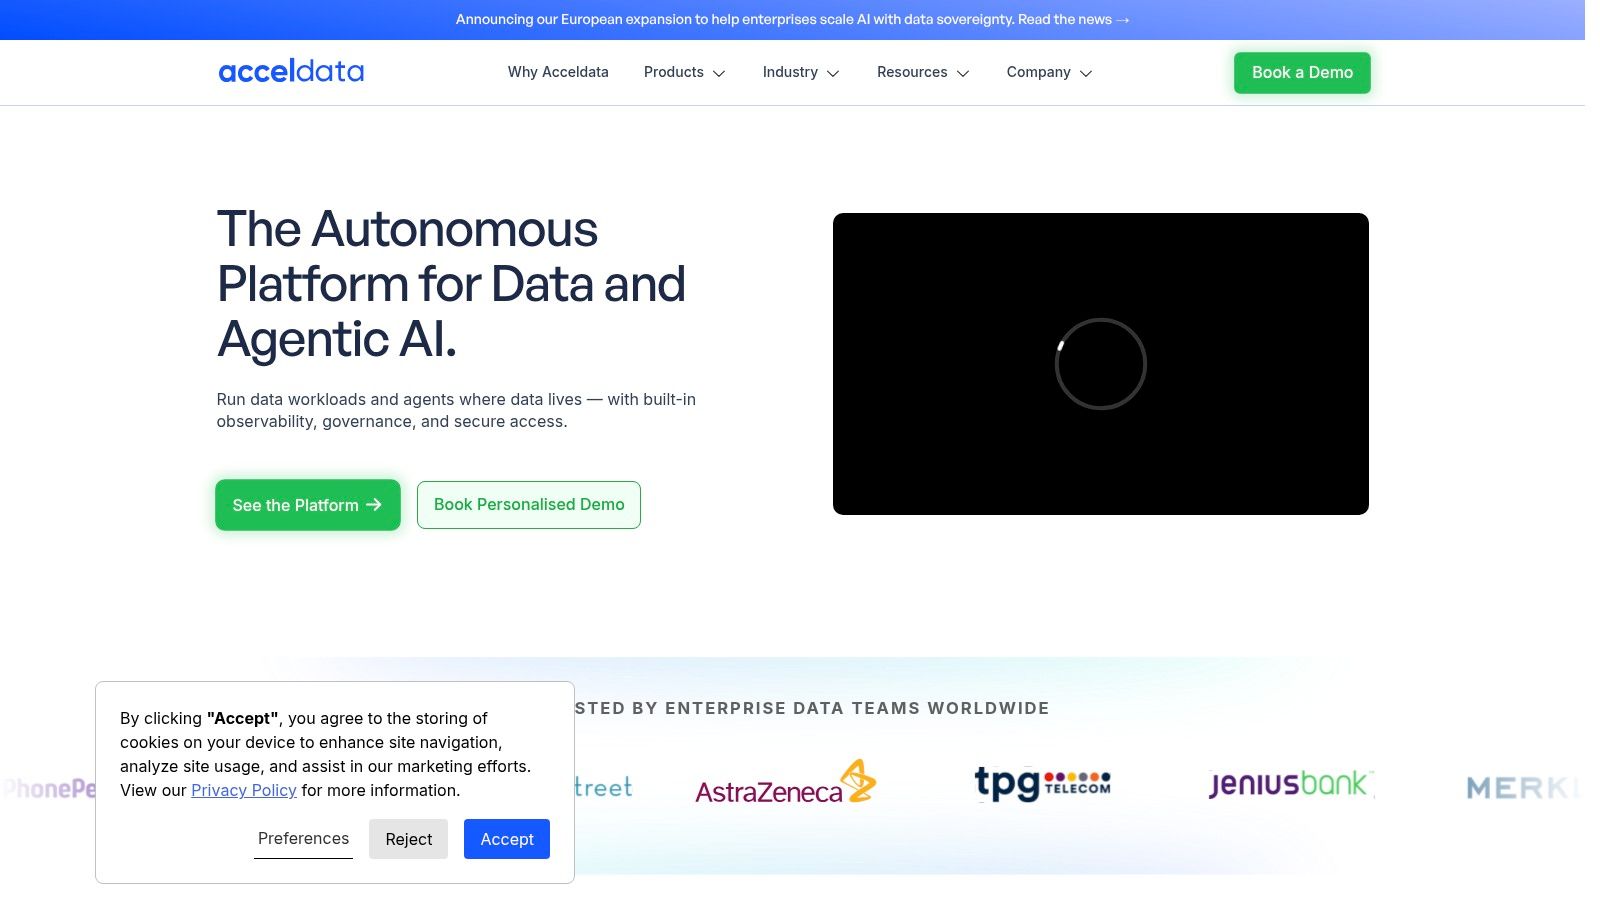
Acceldata targets heterogeneous environments where data quality is only one part of reliability. Its scope spans data platforms, pipelines, jobs, costs, and performance, including cloud, on-premises, hybrid, Hadoop, and broader big-data estates. That makes it especially relevant for platform teams modernizing legacy infrastructure without re-platforming every workload before observability can begin.
The platform organizes operations around an observe, detect, diagnose, and act model. In practice, buyers should assess how well that workflow connects quality signals to pipeline execution, platform behavior, governance, and optimization. Acceldata's Data Observability Cloud adds productized workflows and documentation, while its hybrid positioning addresses a common blind spot in cloud-first tools.
Broad coverage versus focused adoption
Acceldata can be a strong fit for large estates with multiple generations of technology, but its breadth may exceed what a small analytics team needs. Pricing is sales-led and gated, so a proof of concept should include deployment effort, ownership boundaries, and the cost of activating capabilities that the team may not use immediately.
digna approaches the same enterprise concern through modularity and in-database execution. Its Data Anomalies, Timeliness, Data Validation, Schema Tracker, and Data Analytics modules focus on data behavior and reliability while keeping computations inside the customer's databases. Acceldata is the more natural shortlist candidate when platform performance, infrastructure, and governance must sit in the same operational view. digna is more compelling when controlled deployment and incremental module adoption are the primary constraints.
Use data observability tools from digna as a reference point when comparing platform breadth with focused data-resident monitoring.
Pros: Hybrid and on-premises support, broad platform visibility, and combined observability, governance, and optimization.
Cons: The scope can be excessive for smaller teams, and pricing requires sales engagement.
4. Anomalo
Anomalo is an AI-native data quality platform built around automated issue detection with minimal rule writing. Its unsupervised approach is designed to identify abnormal behavior across structured, semi-structured, and unstructured data, then support root-cause investigation. That makes it attractive to teams that want anomaly coverage quickly without maintaining a large library of manually authored checks.
Its ecosystem emphasis is clear. Deep integrations with Databricks, Snowflake, and catalog partners can reduce setup friction when those systems already anchor the data estate. Enterprise deployment options and service-level agreements are available, but the buyer still needs to distinguish anomaly detection from deterministic control. A model may identify that a dataset changed unexpectedly, while a business-critical rule still requires an explicit validation condition.
Anomaly detection is not the whole control layer
digna covers the same low-configuration anomaly use case through Data Anomalies, but adds separate modules for Data Validation, Timeliness, and Schema Tracker. That separation matters for teams that need both learned baselines and auditable business rules. A schema-drift control, for example, compares an incoming structure with a baseline or target schema and alerts when columns or data types change. (Practical schema-drift detection guidance)
Anomalo's pricing isn't public and requires sales engagement. Published self-serve details are also more limited than those of some SaaS competitors, so migration planning should include a technical evaluation, security review, and commercial discovery rather than relying on a product demonstration.
Pros: Minimal rule writing, fast anomaly-focused onboarding, enterprise deployment options, and strong warehouse integrations.
Cons: Pricing is not public, and teams may need additional controls for explicit business-rule enforcement and in-database deployment requirements.
5. Soda
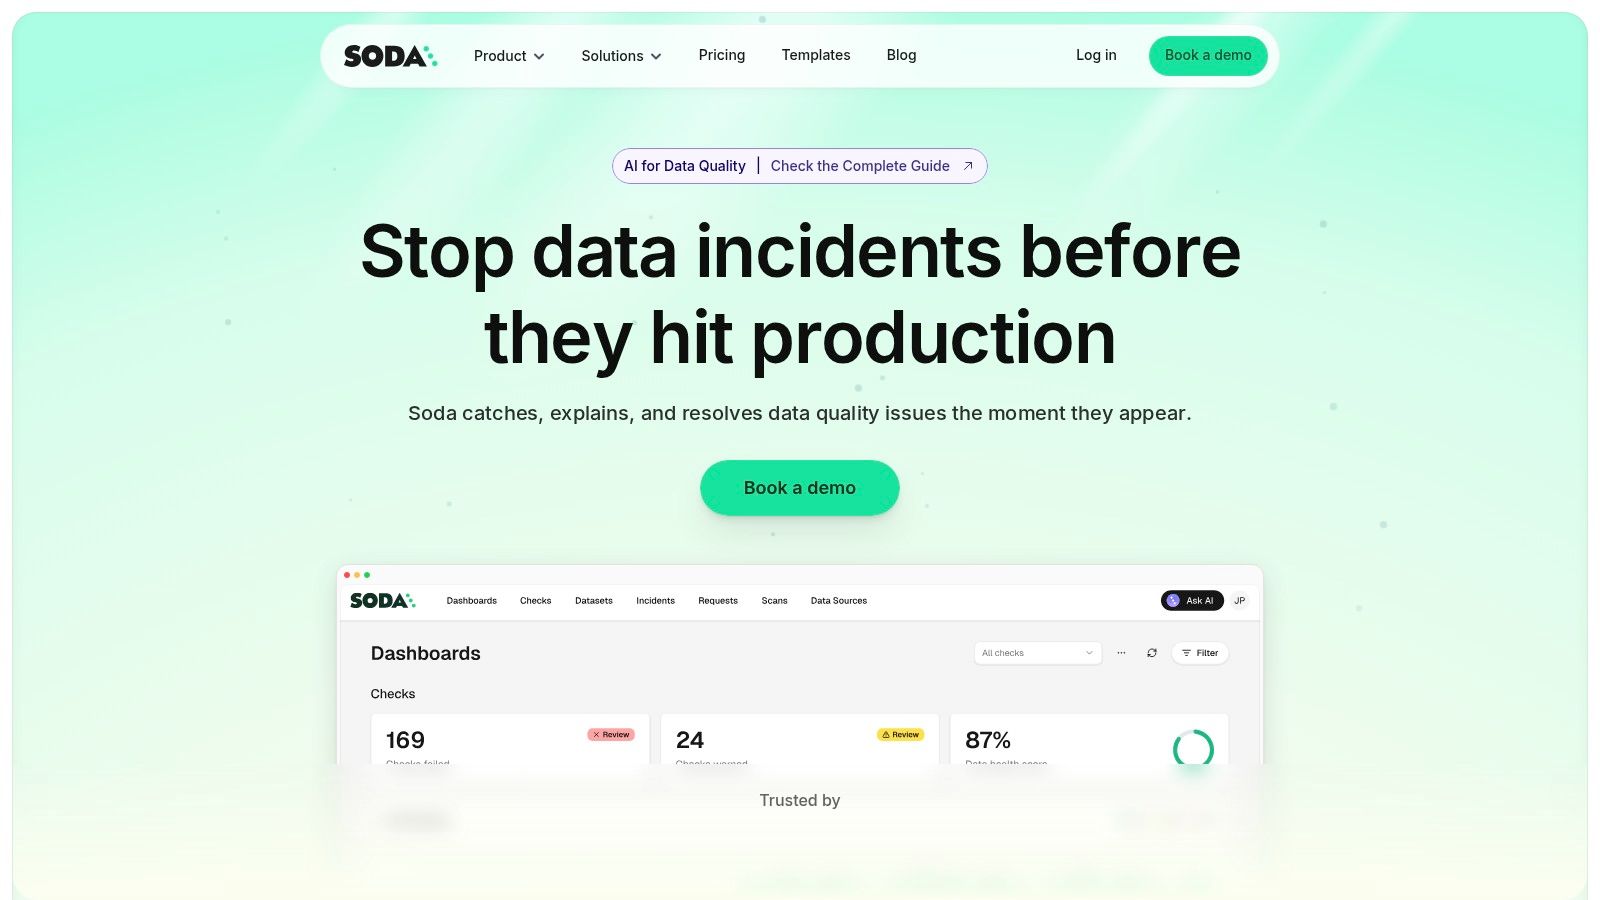
Soda combines an open-source entry path with a managed observability product. Soda Core supports checks and data contracts as code, including YAML-based definitions and built-in checks, so engineers can place validation inside pipeline development and CI/CD workflows. Soda Cloud adds metric monitoring, historical baselining, anomaly detection, collaboration, and governance workflows.
That dual model changes the migration question. A team can begin with a CLI and open-source workflow, then move into managed capabilities when it needs centralized monitoring and collaboration. The path can reduce lock-in, but advanced observability and governance remain associated with the managed Cloud product, not the open-source layer alone.
Where rule ownership matters
Soda fits teams that want engineers to express data quality expectations close to code and orchestration. It's less directly aligned with organizations that want learned anomaly and delivery monitoring without maintaining extensive test definitions. digna provides both sides through automatic Data Anomalies and Timeliness, plus explicit Data Validation and Schema Tracker modules.
Freshness and timeliness should be tested separately during migration. Freshness checks whether records arrived inside an expected window, while timeliness asks whether the data became usable within the decision window. (Enterprise data quality control guidance) That distinction can expose gaps hidden by a generic “freshness” monitor.
Public list pricing for Soda Cloud isn't published, so buyers need a quote based on sources, checks, users, and managed scope.
Pros: Open-source entry, checks as code, pipeline embedding, and a clear path to managed observability.
Cons: Advanced collaboration and governance require Soda Cloud, and Cloud pricing is sales-led.
Compare the operating models in this Soda alternative for enterprise data quality.
6. Metaplane now part of Datadog
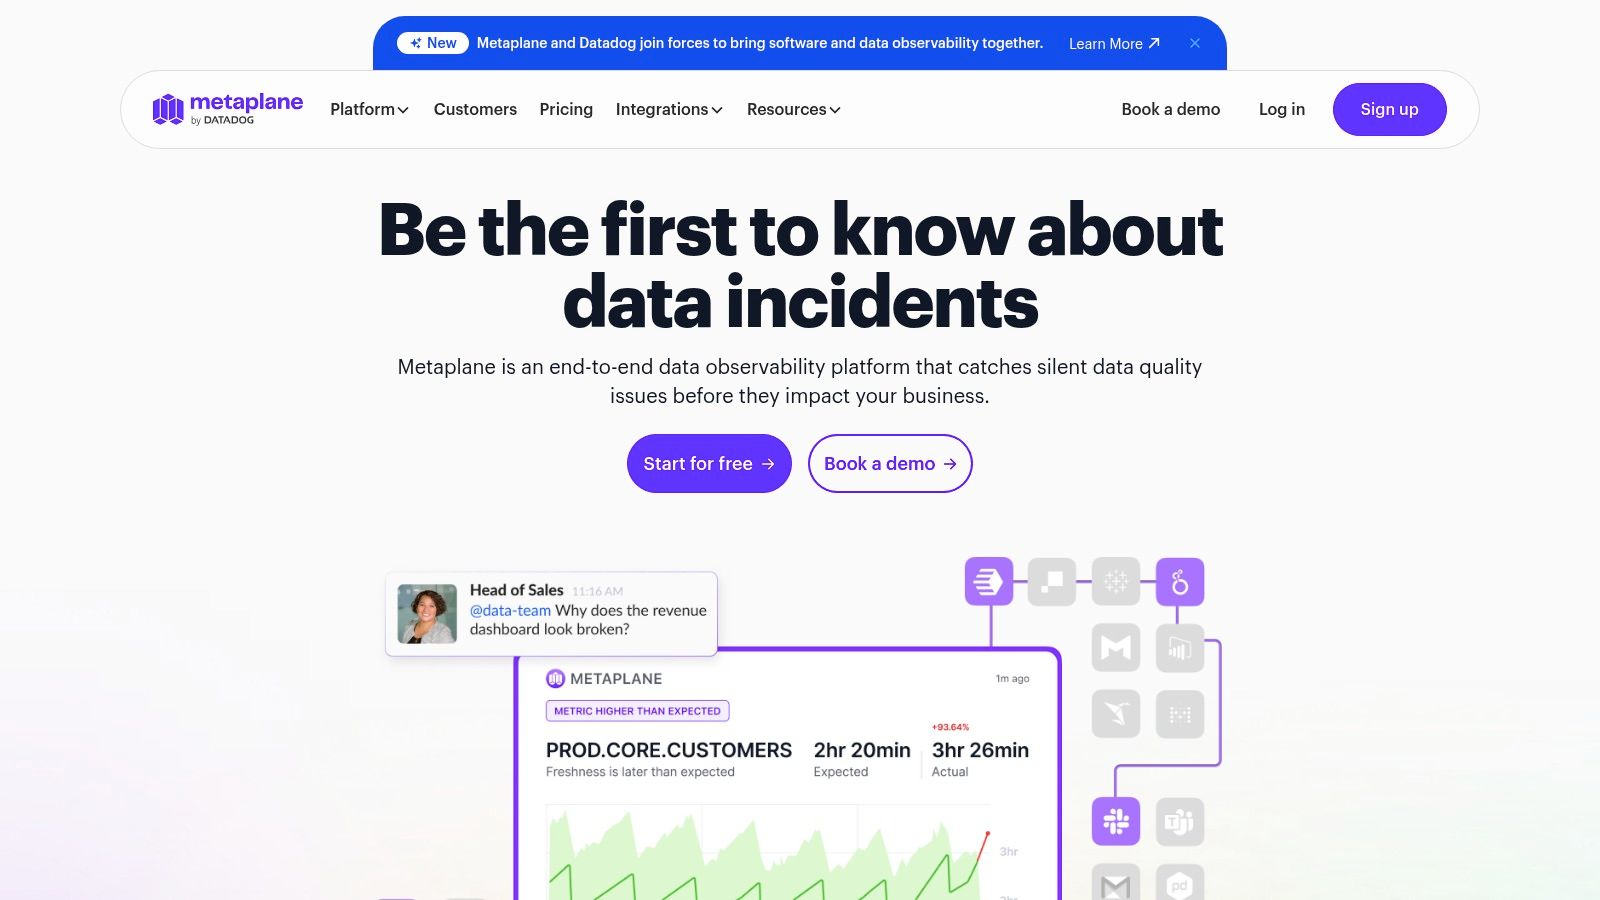
Metaplane focuses on fast SaaS onboarding for modern data stacks. Its machine-learning-based anomaly detection accounts for seasonality and trends, while column-level lineage and impact analysis help teams understand downstream consequences. Data CI/CD catches regressions in pull requests, and Slack or Microsoft Teams alerting connects detection to existing engineering communication.
The Snowflake Native App option is a meaningful architectural distinction. It keeps data in the warehouse and allows payment through Snowflake credits, which can simplify security review and procurement for Snowflake-centered teams. That isn't the same as broad private-cloud or on-premises control, however. Buyers with heterogeneous or regulated environments should test how feature depth changes outside the Snowflake path.
Fast start, narrower enterprise perimeter
Metaplane's free-forever entry path supports experimentation, and its read-only access model can make initial security discussions easier. The trade-off is feature breadth. It may not replace a larger enterprise suite when teams need broad governance, multiple deployment models, or deep coverage across older platforms.
digna's comparison point is not onboarding speed alone. It offers in-database execution, private cloud or on-premises deployment, a shared dashboard, and modules that cover anomalies, timeliness, validation, schema changes, and historical analytics. Teams should compare the time required to connect a representative source, configure permissions, investigate an alert, and produce evidence for governance.
A useful starting point is this explanation of what an observability platform does, then validate the details against your own warehouse and orchestration stack.
Pros: Fast onboarding, free entry, read-only access, lineage, CI/CD checks, and a Snowflake-native deployment option.
Cons: The suite is narrower than the largest enterprise platforms, and capabilities vary across data systems.
7. IBM Data Observability by Databand
IBM Data Observability by Databand is centered on pipeline and job reliability. It monitors jobs, tracks service-level agreements, and alerts teams to failures or delivery risks across orchestration and warehouse tooling. The IBM support, procurement, documentation, and contracting framework can be decisive for regulated enterprises that already standardize on IBM services.
This option is less about lightweight self-service and more about fitting observability into an established enterprise operating model. Teams should expect a procurement and implementation process shaped by internal standards, support requirements, and integration governance. The experience can be appropriate for organizations that value vendor accountability and contracting continuity over rapid trial activation.
Fit depends on ownership and procurement
Pricing is contract-led and can use resource-unit licensing in some SKUs. That makes a like-for-like comparison difficult unless the buyer defines monitored jobs, environments, users, support expectations, and renewal assumptions before requesting a quote.
digna provides a different route. Its modular licensing starts with one module and expands by active table and module, while its in-database architecture keeps analysis inside the customer environment. The practical comparison is therefore between an IBM-centered pipeline reliability model and a modular data quality and observability model that includes Data Anomalies, Data Analytics, Timeliness, Data Validation, and Schema Tracker.
IBM is a sensible shortlist candidate when existing IBM support and procurement channels carry substantial weight. digna deserves closer evaluation when data engineers and governance teams need one shared interface for both learned behavior and explicit quality controls.
Pros: IBM support, enterprise contracting, documentation, governance alignment, and pipeline SLA monitoring.
Cons: The experience may be less self-serve, and pricing is sales-led with resource-unit licensing possible in some offerings.
8. Lightup
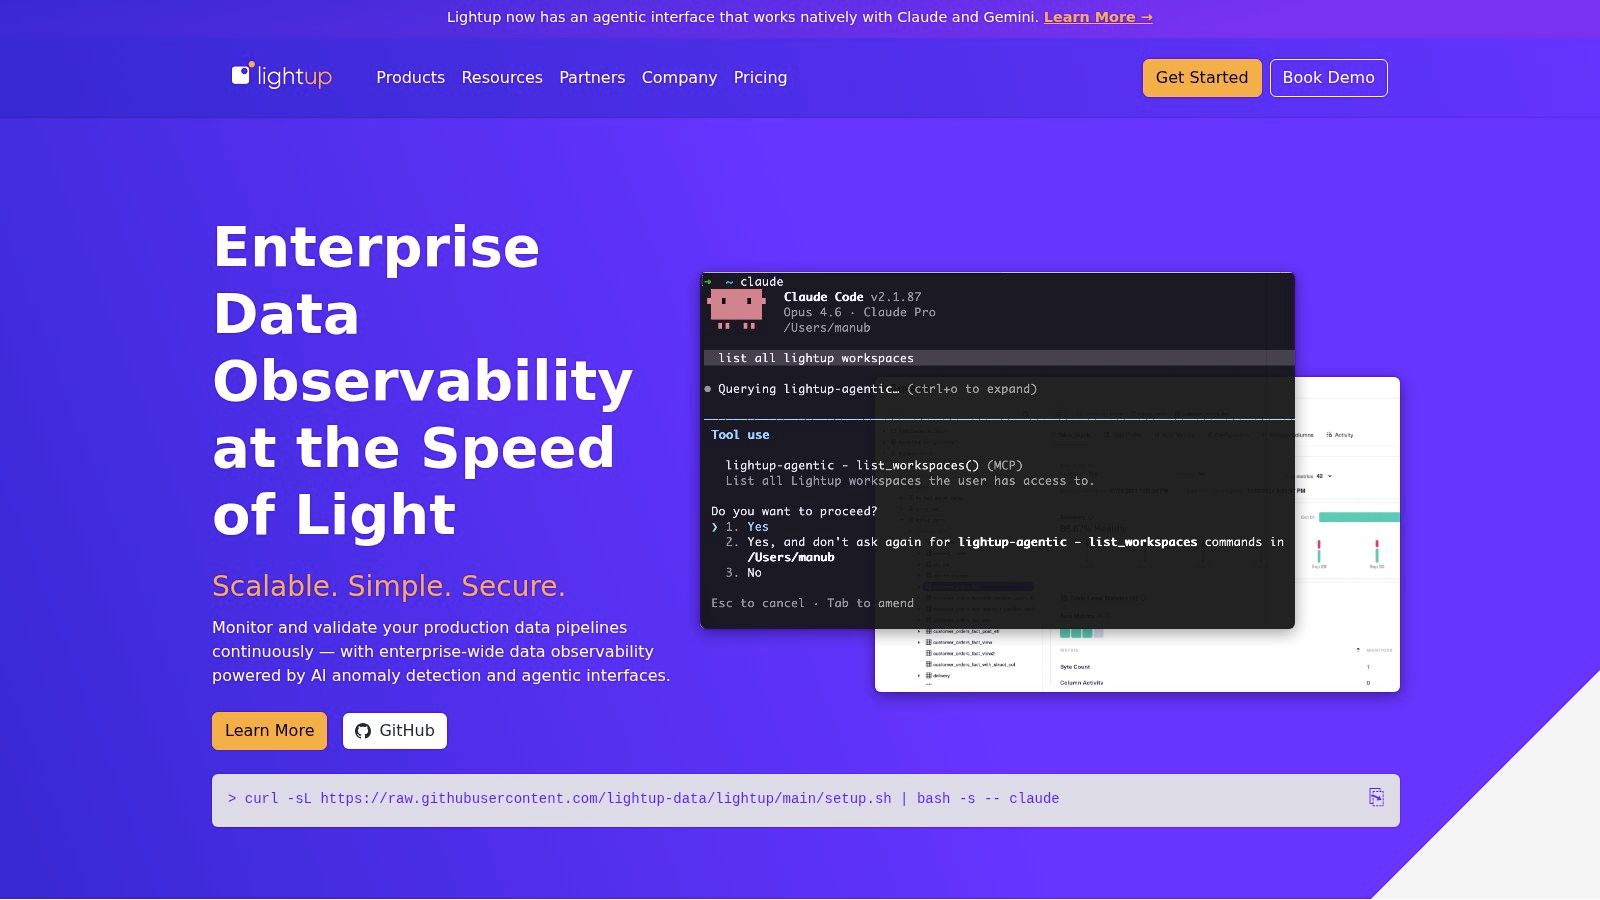
Lightup combines rule-based checks with AI anomaly detection, lineage, reconciliation, and incident management. Its Zero-Config Auto Metrics approach is intended to create baseline coverage quickly, while AI recommendations help teams identify where additional monitoring may be useful. Integrations with Collibra, Alation, ticketing systems, and alerting tools extend the platform into governance and incident workflows.
The Cloud and Enterprise plan structure gives buyers a useful deployment question rather than a simple feature question. A cloud deployment may reduce operational responsibility, while enterprise or hybrid options may better fit data-residency and access constraints. The evaluation should confirm where metric computation occurs, what production data leaves the environment, and how permissions are administered.
Auto-activation versus controlled modular rollout
Lightup's rapid activation can shorten time to first coverage. digna offers a similar incremental adoption idea through modular licensing, but its differentiator is that checks and metric computation execute inside the customer's databases. That can matter more than initial setup speed for teams handling sensitive production data.
No public dollar pricing is available, so the quote should separate platform fees, monitored scope, deployment tier, integrations, and support. Buyers should also test whether auto-generated metrics produce useful incidents or merely expand the alert surface. The objective isn't to activate every possible monitor. It's to identify failures early without making engineers review low-value events.
Pros: Quick baseline setup, AI anomaly detection, lineage, reconciliation, governance integrations, and cloud or enterprise deployment paths.
Cons: Pricing requires a quote, and its ecosystem visibility is smaller than that of the largest market leaders.
9. Telmai
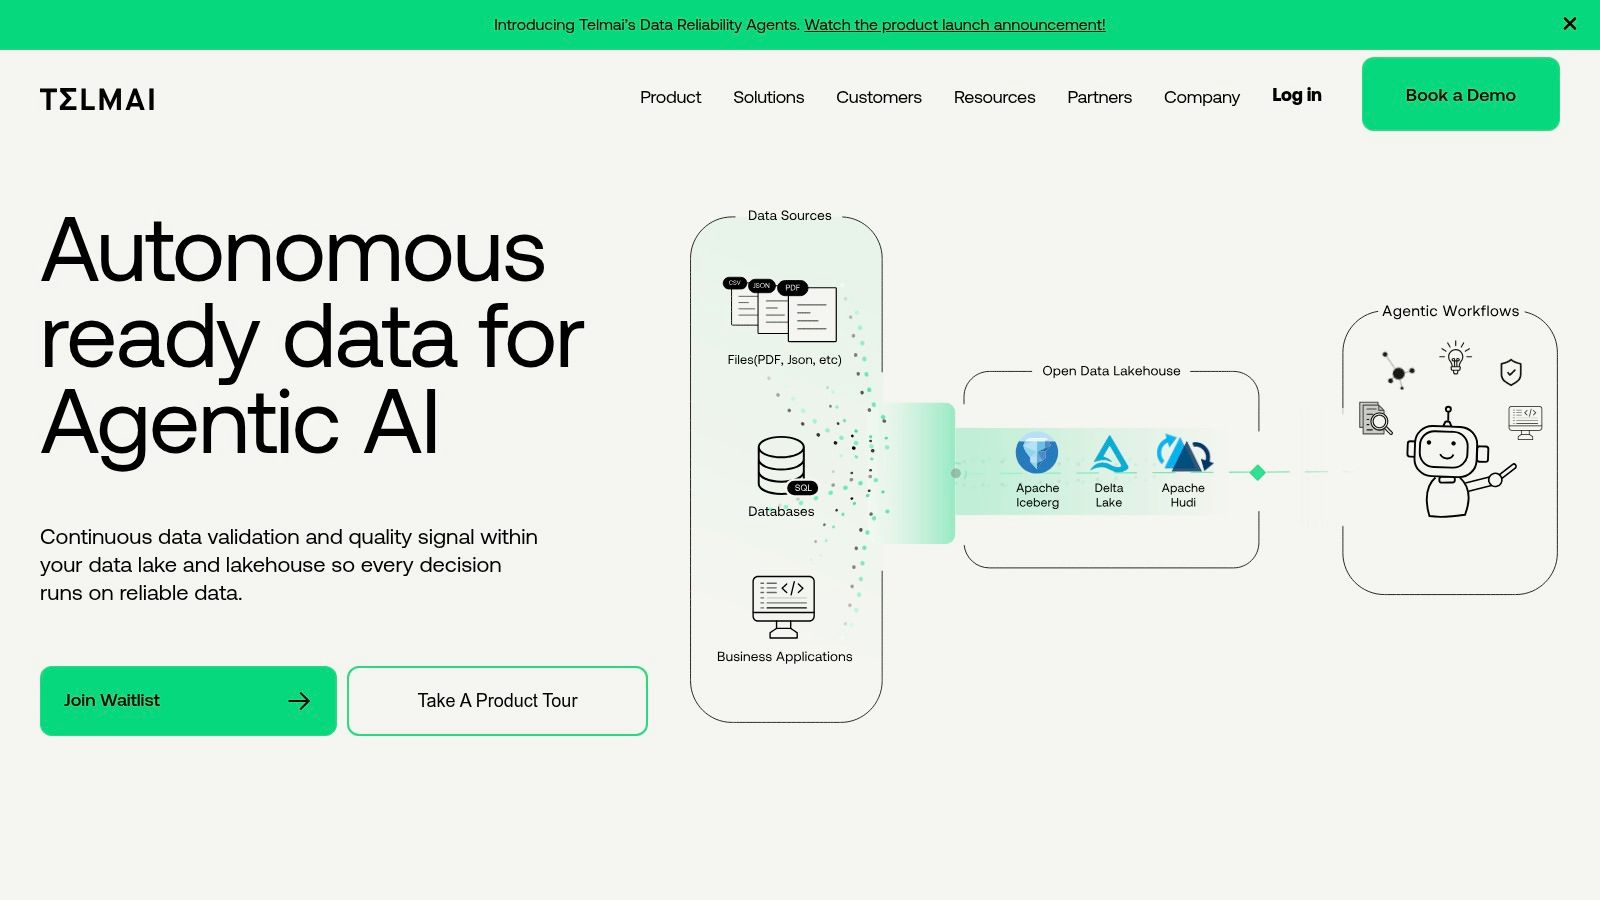
Telmai is designed for open architectures and lakehouse environments built around Iceberg, Hudi, or Delta. Its no-code and low-code positioning, rule-free anomaly detection, drift monitoring, timeliness checks, schema monitoring, and plain-English issue queries address teams that want broad coverage without building every detector manually.
The platform's Root-cause Investigator is aimed at moving beyond the first alert toward explanation. AWS Marketplace availability can also simplify an initial trial or procurement path for teams already operating through AWS. That convenience doesn't remove the need to model monitored scope, deployment responsibilities, and the way the platform interacts with open table formats.
Open formats change the migration test
Telmai is a strong candidate when lakehouse openness is the main architectural requirement. digna's fit is strongest when the team also needs in-database execution, private deployment, record-level validation, AI-learned timeliness, and a shared interface spanning engineers, analysts, and governance stakeholders.
Data observability practice generally groups quality, freshness, lineage, and schema changes as core monitoring signals, with real-time checks helping prevent downstream analytics and AI failures. (Research on data observability signals) During a POC, compare not only whether both platforms detect the same drift, but also whether each can explain the issue in the team's preferred operational language.
Telmai pricing isn't public and depends on monitored scope and deployment. Its community footprint is also smaller than that of longer-established vendors, so buyers should assess documentation, implementation support, and internal ownership.
Pros: Strong lakehouse and open-format fit, rule-free anomaly coverage, natural-language investigation, and AWS Marketplace availability.
Cons: Pricing is quote-dependent, and the community footprint is smaller than that of established vendors.
10. Kensu
Kensu uses deployable agents to observe data in motion and at rest. Its approach instruments pipelines where data is used, collecting real-time lineage, schema, and quality metrics across tools such as dbt, Databricks or Spark, Azure Data Factory, and Snowflake. That can reduce blind spots in distributed environments where a warehouse-only monitor sees the destination but not the transformation path that produced it.
Circuit-breaker-style controls and incident workflows extend Kensu beyond passive notification. A Community Edition and proof-of-concept options can help developers evaluate the instrumentation model before committing to a wider rollout. The key migration question is whether the team wants agents embedded across pipelines or prefers checks that execute directly in the database.
Instrumentation depth versus data-resident execution
Kensu's observe-where-data-is-used model can reveal context that table-only monitoring misses. digna takes a different path with in-database execution, keeping metric computation and analysis inside the customer's databases while covering anomalies, analytics, timeliness, validation, and schema changes through separate modules.
Kensu pricing isn't published and is typically sales-led. Website detail is also lighter than that of larger vendors, with some material delivered through documentation or professional channels. The evaluation should therefore include an implementation walkthrough, agent permissions, failure behavior, upgrade responsibility, and evidence retention.
Pros: Real-time pipeline instrumentation, lineage and schema monitoring, distributed visibility, and community evaluation options.
Cons: Pricing is not public, and teams must assess the operational overhead of deploying and maintaining agents.
Top 10 Bigeye Alternatives: Feature Comparison
Vendor | Core capabilities | Unique selling points | Target audience | Deployment & Security | Pricing & Value |
|---|---|---|---|---|---|
🏆 digna | Anomaly detection, Timeliness, Record validation, Schema tracker, In‑DB metrics & analytics | ✨ In‑DB execution, AI baseline learning, modular rollout, rapid TTV ★★★★★ | 👥 Data engineers, BI/analytics, governance; finance/healthcare/telecom/public sector | Runs inside customer infra (private cloud/VPC/on‑prem); vendor does not access production data | 💰 Transparent modular pricing: base + per‑active‑table/module; predictable but scale-dependent |
Monte Carlo Data | Freshness, volume, schema & distribution monitors; column/dashboard lineage; incident workflows | ✨ Broad connector/stack coverage; strong enterprise references ★★★★ | 👥 Large enterprises with diverse stacks and analytics teams | Cloud/SaaS connectors across warehouses, lakes, ETL, BI | 💰 Quote-based enterprise pricing; can be heavyweight for small teams |
Acceldata | Platform/pipeline/job observability, costs, performance, productized workflows | ✨ Hybrid/on‑prem support + governance & optimization focus ★★★★ | 👥 Large, heterogeneous environments; enterprises modernizing big‑data | Cloud, on‑prem & hybrid deployment options; enterprise controls | 💰 Sales-led pricing; suited to large estates |
Anomalo | Unsupervised anomaly detection, root‑cause analysis, integrations (Databricks/Snowflake) | ✨ Rule-free detection, rapid time‑to‑value ★★★★ | 👥 Teams needing fast anomaly detection without heavy rules | SaaS with enterprise deployment options; strong cloud integrations | 💰 Quote-based; enterprise SLAs available |
Soda | Checks/contracts-as-code (Soda Core OSS); Soda Cloud for baselining & alerts | ✨ OSS entry (50+ checks) → managed Cloud migration path ★★★ | 👥 Devs/engineers wanting OSS-first path and pipeline embedding | OSS (CLI) + managed Cloud; integrates with warehouses & orchestrators | 💰 OSS free; Soda Cloud = sales contact for pricing |
Metaplane (Datadog) | ML anomaly detection, column lineage, Data CI/CD, Snowflake Native App | ✨ Fast onboarding, free‑forever tier, Snowflake‑native option ★★★★ | 👥 Small→mid teams, Snowflake-first orgs, rapid POCs | SaaS + Snowflake Native App (data stays in warehouse) | 💰 Free tier available; paid plans / Datadog pricing |
IBM Data Observability (Databand) | Pipeline/job observability, SLA tracking, orchestration & warehouse integrations | ✨ IBM support, procurement & enterprise/regulatory fit ★★★ | 👥 Regulated enterprises and IBM‑standardized buyers | Enterprise deployments, IBM support/product frameworks | 💰 Contract/sales‑led pricing; enterprise procurement model |
Lightup | Rule checks + AI anomaly detection, lineage, reconciliation, incident mgmt | ✨ Zero‑config Auto Metrics for fast coverage ★★★ | 👥 Teams wanting rapid auto‑coverage and collaboration | Cloud & Enterprise plans; hybrid options | 💰 Quote-based; Cloud vs Enterprise plan clarity |
Telmai | Lake/lakehouse observability (Iceberg/Hudi/Delta), drift/timeliness/schema, plain‑English queries | ✨ Open‑format focus, plain‑English issue queries, AWS Marketplace availability ★★★ | 👥 Lakehouse teams, open‑format environments, GenAI prep | Cloud deployments; marketplace (AWS) procurement option | 💰 Pricing by scope; sales engagement required |
Kensu | Agent‑based lineage, schema & quality metrics, real‑time observations & profilers | ✨ Observe‑where‑data‑is‑used; community/POC edition ★★★ | 👥 Teams needing real‑time instrumentation and dev evaluation | Agent deployment across pipelines; real‑time telemetry | 💰 Sales-led pricing; Community Edition for evaluation |
Turn the Shortlist Into a Safe Migration Decision
The right Bigeye alternative depends less on the number of monitors in a demo than on how the platform behaves against your actual data location, ownership model, and incident process. Market demand is moving in that direction. One market study projects the data observability category from USD 3.51 billion in 2026 to USD 6.03 billion by 2031, with an expected 11.42% compound annual growth rate during that period. (2026 data observability market study) Growth alone doesn't identify the right product, but it does indicate that teams are making a long-term infrastructure decision rather than buying a temporary alerting layer.
Start with an inventory, not a vendor scorecard. List critical tables, pipelines, dashboards, models, and operational consumers. Mark which assets contain sensitive data, which systems run in private networks or on-premises, and which workloads cannot tolerate copied production data. Then classify the required controls:
Anomaly coverage: Identify the behaviors that need learned baselines, including volume, distribution, business metrics, and platform signals.
Timeliness requirements: Define expected arrival and decision windows separately. A dataset can arrive within a nominal freshness interval and still miss the point at which a business process needs it.
Validation rules: Document record-level business logic, regulatory controls, reconciliation conditions, and checks that must remain explicit rather than inferred.
Schema monitoring: Specify how added columns, removed fields, and type changes should affect downstream consumers.
Investigation workflow: Measure whether an engineer can move from alert to affected asset, likely cause, owner, and remediation without switching between disconnected tools.
Run the finalists against representative workloads, not a clean sample. Include a high-value table, a delayed pipeline, a planned schema change, an unexpected distribution shift, and a rule violation. Compare alert quality, investigation time, lineage usefulness, and the effort required to tune monitors. Don't count alerts as success. Count the alerts that lead to a clear action.
Cost modeling needs the same realism. Some vendors quote by monitored scope, some use resource or usage signals, and digna uses a base fee plus per-active-table, per-module pricing without API, scan-volume, or alert-volume fees. Ask each vendor to model growth using your active tables, selected modules, environments, integrations, and support requirements. The tool-sprawl evidence is important here: 46.7% of organizations run two to three observability tools in parallel, while only 7.4% rely on a single unified platform. (Independent observability survey summary) Consolidation can improve workflow clarity, but only if the replacement covers the controls that forced teams to add supplementary tools.
digna's module mapping provides a practical comparison baseline:
Data Anomalies: AI-driven baseline learning and continuous anomaly detection without manual rule setup.
Data Analytics: Historical trend, volatility, and statistical analysis for understanding reliability over time.
Timeliness: AI-learned delivery schedules, expected delivery times, late loads, missing data, and early arrivals.
Data Validation: Record-level business-rule enforcement for quality, audit, and compliance controls.
Schema Tracker: Continuous detection of added or removed columns and data type changes.
In-database execution: Metric computation and analysis inside the customer's databases, keeping data in place.
Deployment options: Private cloud or on-premises installation inside the customer's cloud, VPC, or data center.
Shared dashboard: One interface for engineers, analysts, governance teams, and other stakeholders.
Included components: Scheduler, data catalog, integrations, and collaboration features from the initial module selection.
Modular licensing: Start with one module and expand by active table and module.
Migration discipline: Keep Bigeye and the selected alternative running against the same representative workloads long enough to compare detection, investigation, cost behavior, and ownership effort.
Document rollback criteria before the migration starts. Decide what constitutes unacceptable alert noise, missed incidents, unexpected compute, failed integrations, or insufficient evidence for governance. Move in phases, beginning with a bounded set of critical assets and expanding only after owners confirm that the new workflow works. Retire Bigeye after the replacement has demonstrated coverage, incident handling, access controls, and cost behavior in production, not merely after procurement has approved the contract.
The best choice may be Monte Carlo for broad lineage, Acceldata for full-stack hybrid environments, Soda for checks as code, Metaplane for fast modern-stack onboarding, Telmai for open lakehouse formats, Kensu for agent-based pipeline instrumentation, or IBM Data Observability by Databand for IBM-centered enterprise operations. It may be digna when the deciding requirements are private deployment, data-resident execution, modular adoption, learned anomaly and timeliness monitoring, explicit validation, and schema control. Fit depends on architecture and operating model, so the shortlist should end with a workload test and an ownership decision, not a generic ranking.
digna combines AI-driven anomaly detection, timeliness monitoring, record-level validation, schema tracking, historical analytics, and in-database execution inside your own environment. Visit digna to evaluate a modular Bigeye alternative for your data platform, governance, and reliability requirements.
Frequently asked questions
How should you compare Bigeye alternatives?
Not on anomaly detection alone, which repeats the problem buyers are trying to solve. Evaluate against practical enterprise criteria instead: data location, anomaly coverage, validation, timeliness, schema monitoring, deployment model, pricing signals and migration effort.
Which alternative fits teams with residency requirements?
digna is the strongest choice when deployment control and data residency sit alongside observability coverage, because it combines automatic detection with deterministic controls and runs in-database. The trade-off is that private deployment requires internal operational ownership.
How does Monte Carlo compare with an in-database platform?
Monte Carlo's differentiator is operational breadth, with wide connector coverage, end-to-end lineage and incident workflows suited to large modern stacks. The decision depends on the operating model: Monte Carlo suits teams prioritizing lineage and ecosystem coverage, an in-database platform suits teams that must keep data in their environment.
What does observability pricing usually look like?
It varies enough that procurement should model it. digna uses a base fee plus a per-active-table, per-module charge, which needs sizing for large estates, while several competitors including Monte Carlo do not publish pricing and require a quote based on monitored scope and integration requirements.
How much time do teams still lose to data issues?
A survey of data management leaders found that only 7% resolve data issues before users are impacted, while 39% spend 20 to 40% of their time fixing pipeline problems. That reactive share is the real benchmark a replacement platform has to move.


