8 Data Governance Benefits That Drive Real Results
|
6
minuto de lectura
Most governance programs are sold as control overhead, yet the strongest data governance benefits appear in places operators feel every day: faster decisions, fewer dashboard failures, cleaner audit evidence, and less time spent explaining whether a number can be trusted. A 2022 Ventana Research benchmark found that 77% of organizations identified improved data quality for decision-making as a governance benefit, while 64% reported better reporting and business intelligence accuracy and 60% reported improved regulatory compliance (benchmark summary).
That changes the practical question. Governance isn't about writing policies or assigning stewards. It can become an operating capability that detects bad records before reporting, documents controls before an auditor asks, gives analysts confidence in shared metrics, and exposes platform consumption that would otherwise remain hidden. The most effective programs connect each control to an outcome someone can measure, such as outage count, audit preparation time, incident response time, or time-to-insight.
The eight benefits below follow that approach. Each one pairs a governance capability with a repeatable enterprise pattern, including where automation helps, where human judgment remains necessary, and how digna's modules can support the work without replacing ownership, policy, or accountability.
Table of Contents
6. Improved Data Governance Maturity and Organizational Knowledge
7. Enhanced Business Performance Monitoring and KPI Insights
8. Strengthened Data Security and Compliance with Privacy Regulations
1. Improved Data Quality and Reduced Data Errors
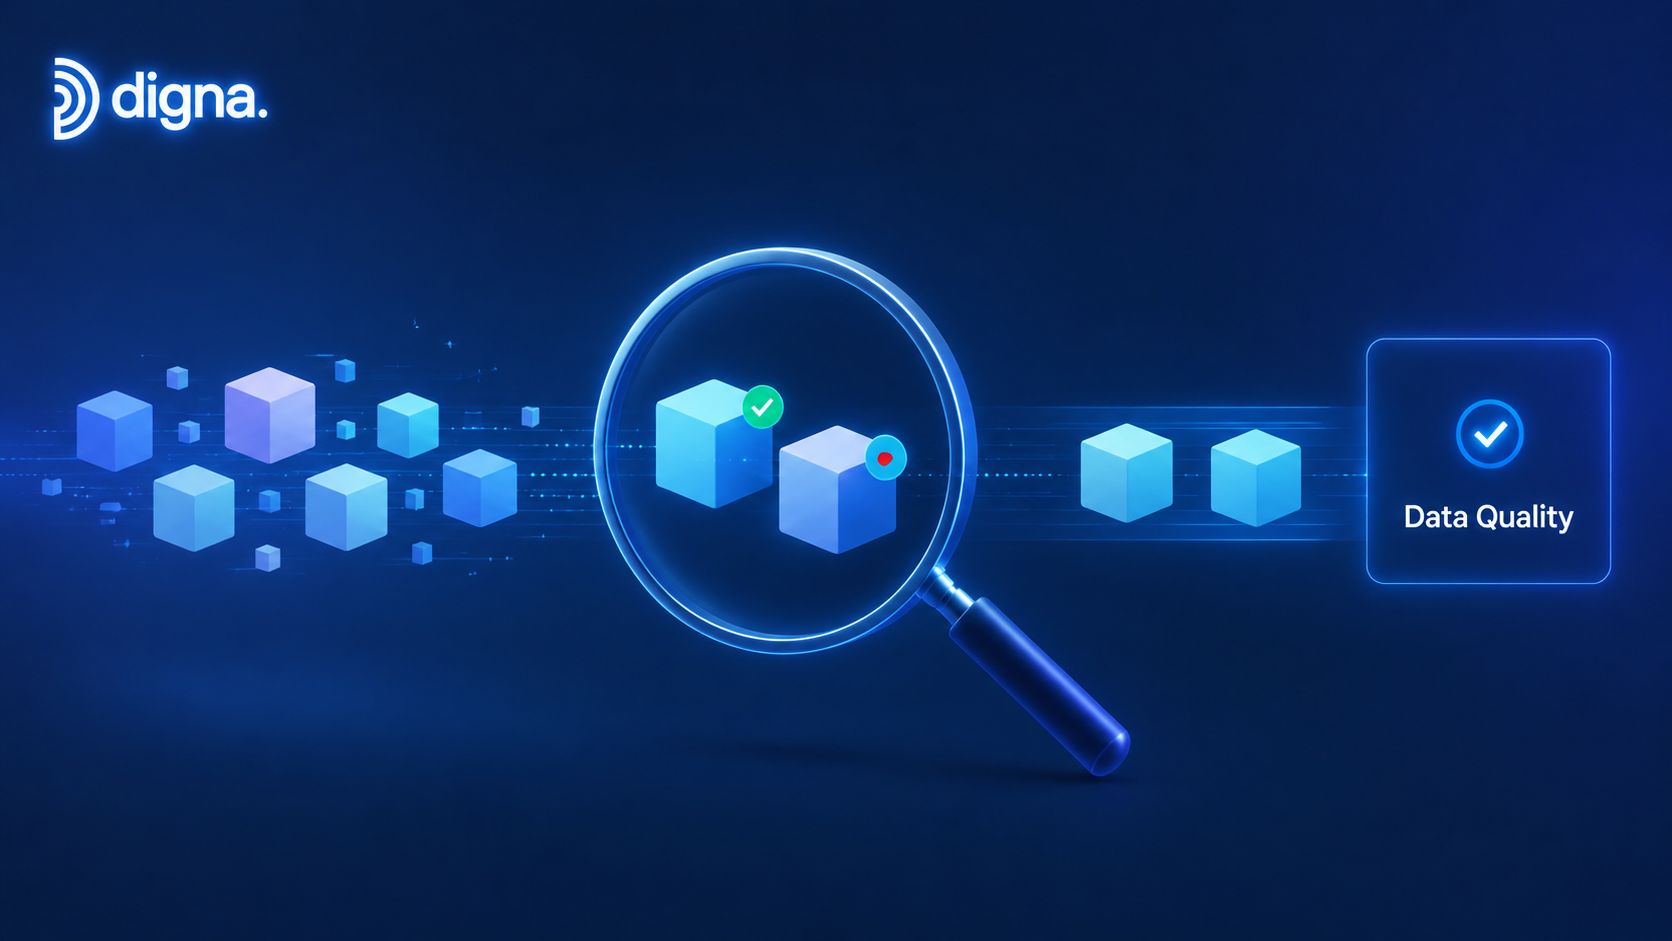
Data quality improves when controls catch failures before they reach reports, models, and operational teams. Governance defines the standard, assigns ownership, and sets the response path. Monitoring applies those decisions continuously across warehouses, lakes, and pipelines, where a single upstream defect can affect many downstream consumers.
A financial services team can validate transaction records against business rules and investigate unusual patterns before risk reporting is published. A healthcare organization can monitor clinical data for missing, late, or structurally inconsistent records. Telecommunications teams face high-volume customer and operational data moving through distributed pipelines, so a small source change may create widespread downstream errors.
digna's Data Quality Management solution combines record-level validation, AI-driven anomaly detection, timeliness monitoring, and schema tracking. Its data quality capabilities fit best when teams begin with datasets tied to regulatory reporting or material business decisions, then extend coverage as ownership and response processes mature.
Build controls that catch failure early
Establish normal behavior for priority datasets, then add deterministic rules wherever the business requirement is explicit. Anomaly detection can expose unexpected shifts before teams have defined a rule for every failure mode. Domain experts still need to confirm whether an unusual pattern represents a defect, a legitimate business event, or a source-system change.
Monitor critical datasets first: Select sources that feed board-level metrics, regulatory reports, customer operations, or AI products.
Track arrival behavior: Alert on late, missing, or unexpectedly early deliveries so pipeline failures surface before users open a dashboard.
Record structural changes: Document added or removed columns and data type modifications. Unannounced changes can break downstream pipelines, a pattern commonly described as schema drift.
Review trends regularly: Use monthly quality reviews to distinguish isolated incidents from recurring process defects and assign remediation to the responsible team.
Practical rule: A quality score without an owner, threshold, and response path is a report, not a control.
2. Enhanced Regulatory Compliance and Audit Readiness
Regulatory readiness depends on reconstructing what happened to data, not assembling a polished document after an incident. A defensible control record identifies the rule applied, when the check ran, what failed, who investigated it, and whether the data structure changed. Governance assigns ownership and defines retention requirements, so that evidence remains usable during an audit.
The operating pattern differs by industry. A financial institution can validate transaction data and retain schema-change history for reporting controls. A healthcare provider can monitor clinical data quality and delivery timeliness. A public sector agency may require traceability across systems, while a telecom team may need to prove that regulated reporting inputs arrived on schedule.
Research has linked governance-enabled data quality with regulatory and compliance risk mitigation and with cost reduction (Precisely report). The figures should be treated as directional, not as a promise for every program. They support a practical conclusion: compliance works better as a routine operating workflow than as a periodic scramble.
Turn monitoring into evidence
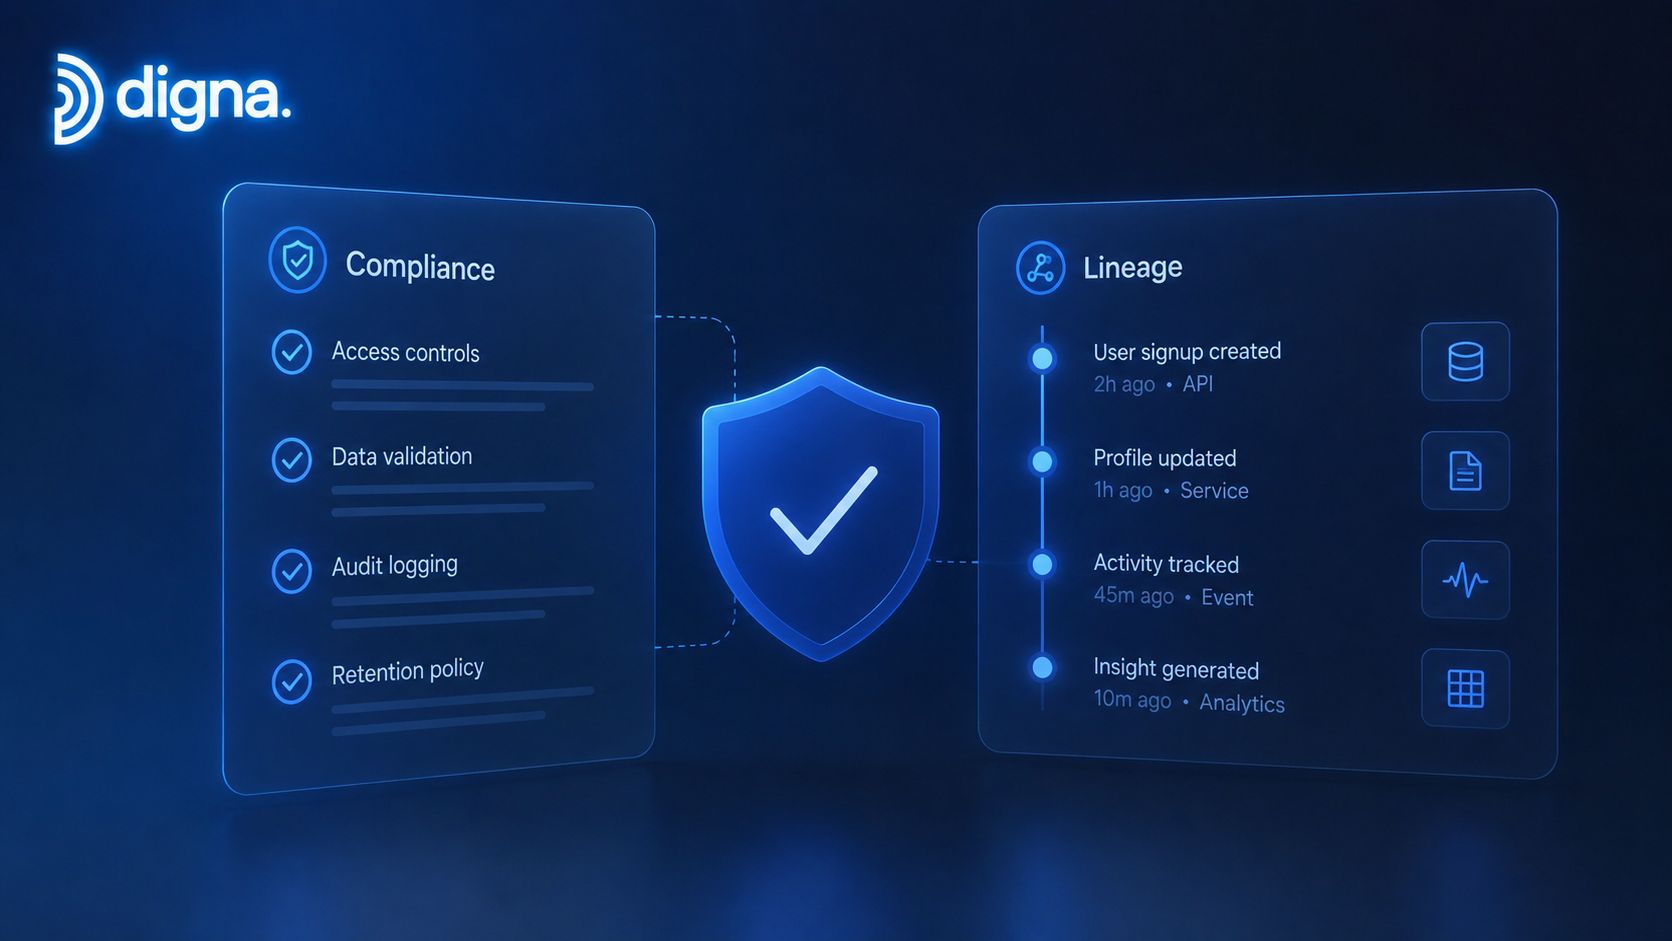
digna supports this workflow through continuous monitoring, validation logs, timeliness tracking, and schema-change detection. Its data compliance guidance is most useful when each monitored control maps to a specific obligation and teams agree in advance on evidence retention.
Map controls to requirements: Link validation rules and alerts to the relevant SOX, GDPR, HIPAA, or industry requirement.
Retain investigation history: Store validation and schema-change records according to audit and retention policies.
Include compliance in design: Have audit and compliance teams define business rules, thresholds, and escalation paths with data owners.
Review controls periodically: Reassess monitoring rules when regulatory expectations, source systems, or data flows change.
The trade-off is clear. More logging can strengthen evidence, but poorly designed alerts create noise and encourage teams to ignore the system. Retain records that support accountability, assign an owner to each exception, and make every entry useful to an investigator.
3. Accelerated Time-to-Insight and Faster Decision-Making
Fast decisions depend on how quickly analysts can establish that a dataset is usable. They need to confirm the latest load, compare current values with normal behavior, investigate unexpected changes, and verify whether a schema changed. Governance brings those checks into a shared workflow, so analysis starts with visible information about quality, timeliness, and structure.
digna reports initial monitoring insights in under two hours from installation, according to the platform description provided for this article. That supports quicker diagnosis, not a guaranteed business insight within the same period. Results still depend on dataset access, ownership, alert design, and the team's response process.
The replicable pattern is narrow and measurable: select the datasets behind decision-critical metrics, establish expected delivery and value ranges, then track how long it takes to identify and resolve an issue. An analytics team can find stale dashboard metrics after a delivery failure rather than after a stakeholder complaint. Analysts can examine unusual revenue or customer-activity movement while business context remains available, and engineers can address a schema change before it breaks a downstream model or report.
Shorten the trust delay
A shared reliability view supports self-service analytics by giving analysts and data teams the same operational context. It also reduces engineering interruptions, although broader access requires clear ownership and definitions to prevent inconsistent interpretations.
Prioritize decision inputs: Monitor the datasets supporting strategic KPIs, executive dashboards, and operational decisions.
Alert on actionable conditions: Distinguish delivery failures requiring intervention from informational changes that can wait for review.
Show reliability context: Display anomalies, timeliness status, validation results, and structural changes beside the datasets analysts use.
Review baseline behavior: Examine trends regularly and adjust expectations when seasonality or business processes change.
A quality score alone does not shorten decision time. If a dashboard reports “data quality: 92” without identifying the failed rule, affected process, owner, or next action, analysts still have to investigate manually. The useful outcome is a shorter path from detection to a business-ready explanation.

4. Reduced Data-Related Operational Costs and Rework
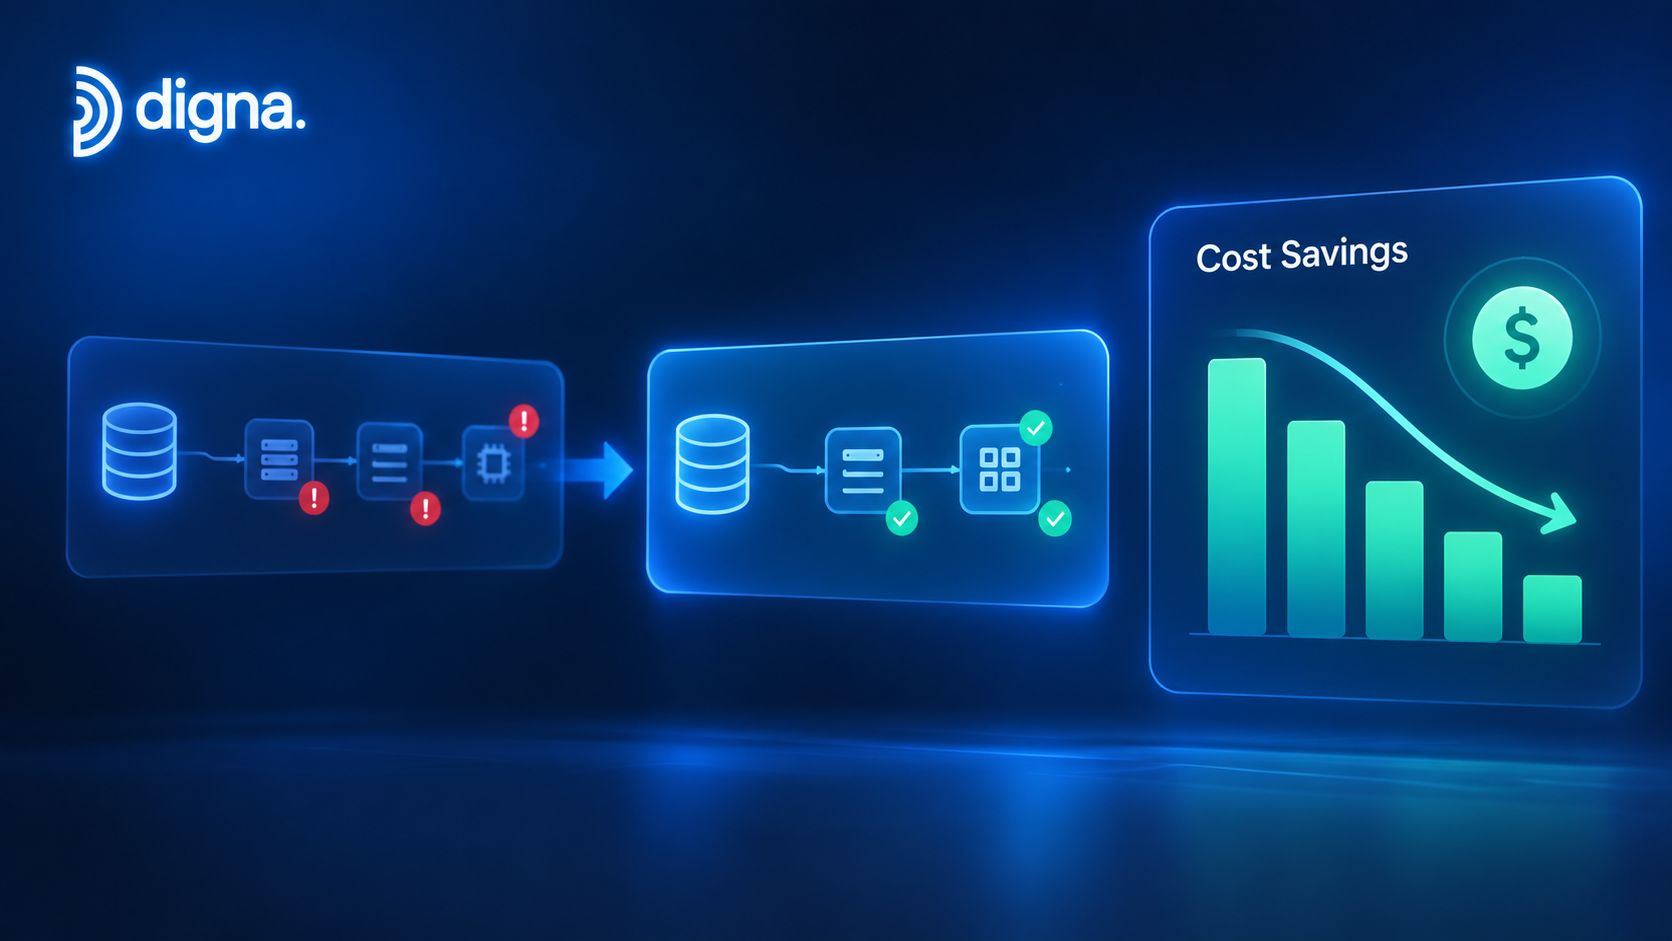
Data-related cost is usually distributed across several teams. Engineers investigate failed pipelines, analysts rebuild reports, managers wait for corrected figures, and platform teams absorb inefficient workloads. Governance reduces this drag by detecting failures near the source, assigning ownership, and preserving the context needed for a practical fix.
The repeatable pattern is straightforward: identify a costly failure mode, instrument the affected data flow, then compare incidents and recovery effort with the pre-governance baseline. A manufacturer could detect a schema change before it disrupts downstream reporting jobs. A financial services team might use proactive monitoring to reduce dashboard outages from 8 per month to 1 per month, but that remains a scenario for this article, not a verified benchmark. A telecom operator could also examine unexpected pipeline consumption and optimize workloads, provided it measures its own starting point first.
The business case should begin with internal incident records. Track the hours spent on investigation, report reconstruction, escalations, delayed decisions, and unnecessary platform usage. The data quality business case is stronger when finance and engineering agree on the definition of a data incident and the method for assigning cost.
Turn operational waste into a measurable baseline
digna's Data Platform Observability can help teams examine workload consumption, availability, and operational behavior. The tool does not remove the need for ownership or maintenance. It gives teams a way to connect technical signals with the operational work those signals create.
Use a small set of measures:
Set delivery and quality SLAs: Define violation conditions, owners, response targets, and escalation paths.
Count rework explicitly: Record troubleshooting time, rebuilt reports, repeated manual checks, and decisions delayed by unreliable data.
Inspect consumption changes: Investigate inefficient workloads, unexpected pipeline activity, and platform behavior that increases spend.
Compare before and after: Review incident volume, recovery time, and effort against the pre-governance baseline.
Governance pays back outside compliance when teams measure work they previously accepted as normal.
Automation has its own cost. Configuration, ownership, and maintenance require capacity. The trade-off works when controls target expensive failure modes, produce actionable alerts, and replace repeated investigation rather than adding checks nobody uses.
5. Increased Trust in Data and Analytics
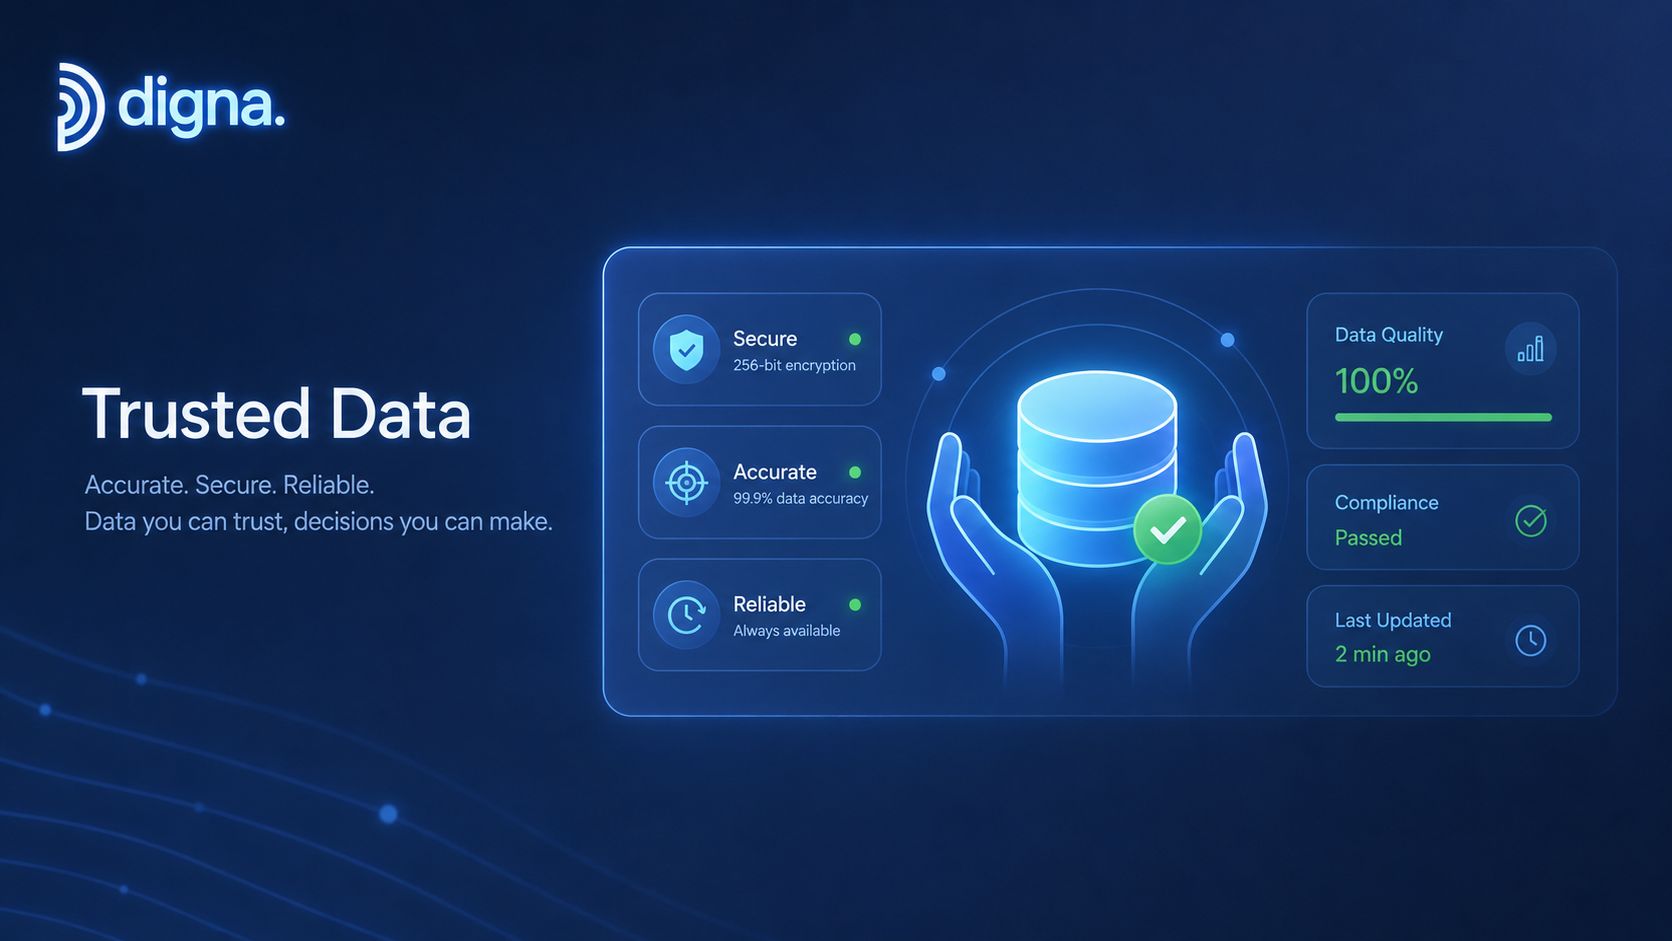
Trust changes how people work. Analysts stop maintaining private spreadsheet copies, risk teams investigate monitored alerts with less hesitation, and executives spend less time disputing metric definitions. Those behaviors appear only when governance provides repeatable evidence about a metric's inputs, status, and ownership.
A healthcare organization can build confidence in operational dashboards by running quality validation continuously and showing unresolved exceptions alongside healthy results. In financial services, an anomaly alert becomes more useful when investigators can review the affected data conditions before deciding whether the event requires escalation. An enterprise KPI view also needs a published definition, accountable owner, and stated limits. A clean dashboard without that context can still support the wrong decision.
The benchmark reports that 77% of organizations identified improved data quality for decision-making as a governance benefit (benchmark summary). The practical lesson is narrower than “trust the data.” Users need enough information to judge whether a number is fit for a particular purpose, including its lineage, freshness, coverage, and known limitations.
Make reliability visible to business users
digna dashboards can bring anomaly, timeliness, validation, and business-monitoring results into a shared workspace. That visibility should include failures, remediation activity, and current ownership. Concealing incidents may preserve confidence briefly, but it removes the evidence teams need to assess control performance and prevent recurrence.
Use a review pattern that connects technical reliability with business use:
Show remediation evidence: Record what changed after an issue, who owned the fix, and whether the check passed afterward.
Pair quality with outcomes: Review business KPI movement alongside the data conditions that can affect it.
Publish shared definitions: Set the metric meaning, scope, and calculation before debating performance.
Review trust signals regularly: Bring quality trends, open exceptions, and aging actions into established business reviews.
A technically healthy dataset may still be unsuitable for a decision if its definition, coverage, or freshness does not match the use case. Governance should expose that fit-for-purpose context. The measurable outcome is fewer unsupported assumptions, faster review of exceptions, and clearer accountability when a metric is challenged.
6. Improved Data Governance Maturity and Organizational Knowledge
Maturity shows up when the organization can answer practical questions about ownership, quality standards, and incident history, rather than producing a score. Teams build that capability by documenting business rules, assigning owners, recording schema changes, reviewing historical behavior, and applying the findings to the next control. Over time, the record becomes organizational knowledge instead of remaining with one engineer or steward.
A healthcare system might document clinical data standards and use historical monitoring to identify recurring quality patterns. A telecommunications company can track schema changes to understand how source systems evolve and which downstream consumers depend on them. A financial services organization may start with anomaly detection, then add validation, timeliness, and structural monitoring as ownership becomes clearer.
Let maturity follow evidence
digna supports this progression by automating monitoring, retaining validation and schema history, and surfacing trends in data behavior. A governance council that includes engineering, analytics, compliance, and business representatives can use that evidence to prioritize improvements and measure whether controls are being adopted.
Assign accountable owners: Give each critical dataset an owner responsible for quality and incident response.
Document business rules: Store validation expectations where engineers and business stewards can review them together.
Study schema history: Use repeated structural changes to improve contracts, communication, and dependency management.
Assess progress annually: Check whether controls are adopted, incidents are understood, and evidence supports decisions.
Expand in modules: Add capabilities as the organization develops the ownership and processes needed to use them.
A practical outcome is faster incident response, clearer handoffs, and less dependence on individual memory. Teams can also identify recurring control failures and direct improvement work toward the standards, dependencies, or ownership gaps causing them.
Maturity can become bureaucracy if teams optimize for completed documents instead of reduced uncertainty. A useful governance artifact helps someone find, interpret, validate, protect, or operate data. Its value is visible in shorter investigations, clearer accountability, and repeatable decisions.
7. Enhanced Business Performance Monitoring and KPI Insights
A technically successful pipeline can still deliver a business failure. The load may complete on time while transactions fall, churn rises, or an operational process changes unexpectedly. Business performance monitoring connects data behavior with the outcomes leaders must manage.
For example, a retailer can investigate a sharp decline in daily transactions while the event is still recent. A SaaS company can track customer activity for early signs of churn before the trend affects planning. A financial institution may monitor trading volumes and unusual patterns as inputs to further risk analysis. Each case requires defined business context, not only technical pass or fail thresholds.
digna's Business Monitoring solution evaluates business and operational KPIs against underlying data. Its monitoring and reporting capabilities can help teams relate an unusual KPI movement to timeliness, validation, anomaly, or schema evidence. The practical outcome is a shorter path from “what changed?” to “which process or decision needs review?”
Design KPI monitoring around decisions
Begin with metrics that business leaders already use, then document what action each metric should trigger. The supplied guidance recommends starting with 5 to 10 critical KPIs. Treat that range as a practical starting point, not a fixed limit.
A useful operating pattern is:
Define normal behavior: Record seasonality, planned events, and recurring operational cycles before setting alerts.
Set alert severity: Separate a material business signal from a temporary fluctuation.
Connect evidence: Compare KPI movement with late data, source-quality failures, anomalies, and structural changes.
Review trends: Use regular trend reviews to identify patterns that warrant strategic attention.
A KPI alert should answer two questions quickly: what changed, and which decision might need to change with it?
Alert fatigue remains the main risk. If every variation produces an urgent notification, business users stop treating alerts as credible signals. Teams should measure whether alerts lead to investigation or action, then tune thresholds and ownership accordingly. Governance creates value when it distinguishes meaningful change from normal volatility and preserves enough evidence to explain the difference.
8. Strengthened Data Security and Compliance with Privacy Regulations
Security improves when governance connects sensitive data to accountable controls. Teams need to know where regulated data resides, how its structure changes, who can access it, and what evidence supports those decisions. Governance does not replace identity management, encryption, or incident response. It gives those controls consistent context across data products and pipelines.
Deployment choices should follow the risk profile. A European healthcare provider may keep workloads in a private cloud to meet data residency requirements. A financial services firm can monitor sensitive transaction data without transferring it to an external processing environment. A public sector organization may record structural changes to government data and preserve evidence for an audit. In each case, the repeatable pattern is to monitor data within the customer's infrastructure and privacy boundaries.
digna performs metric computation and analysis in customer databases, with private cloud and on-premises deployment options. Keeping sensitive data in place reduces unnecessary movement, but it does not remove the need for access controls, retention rules, secure alert handling, or documented links between monitoring and the privacy program. The By Design Law Firm privacy guide offers further context on the legal and organizational aspects of privacy obligations.
Use structural change as a security signal
Schema tracking can surface added fields, removed columns, and changed data types. A change is not automatically unauthorized, yet it can invalidate assumptions behind trusted reports, models, and downstream controls. NIST CSF 2.0-related guidance connects this risk with GV.OC-01 and continuous schema tracking (schema drift and governance risk).
Set the operating rules before alerts arrive:
Match deployment to risk: Choose private cloud or on-premises installation where the security posture requires it.
Restrict monitoring access: Limit dataset visibility and alert details to authorized users.
Review modifications: Investigate unexpected structural changes as possible control or security events.
Document retention: Align monitoring records with privacy, legal, and data lifecycle policies.
Controls also have a cost. Restrictions that are too broad slow legitimate analysis, while weak controls expose sensitive information. Owners, security teams, and data users should agree on access, retention, and evidence requirements together. The measurable outcome is a clearer audit trail and fewer unresolved questions about who changed what, when, and why.
8-Point Data Governance Benefits Comparison
Item | 🔄 Implementation Complexity | ⚡ Resource Requirements | 📊 Expected Outcomes | 💡 Ideal Use Cases | ⭐ Key Advantages |
|---|---|---|---|---|---|
Improved Data Quality and Reduced Data Errors | Medium, initial rule setup and integrations required | Moderate, data engineers, monitoring compute, baseline data | Fewer downstream errors, more reliable analytics and models | High-volume transactional systems, regulatory reporting datasets | ⭐ Catch errors at source; reduces rework and dashboard outages |
Enhanced Regulatory Compliance and Audit Readiness | Medium–High, must map controls to regulations and audits | High, compliance and audit involvement, retention/storage of logs | Audit-ready evidence, timeliness tracking, reduced compliance risk | SOX/GDPR/HIPAA environments, financial & healthcare institutions | ⭐ Automated evidence trails and schema tracking for audits |
Accelerated Time-to-Insight and Faster Decision-Making | Low–Medium, rapid install but needs dataset/KPI definitions | Low, dashboards, AI baseline compute; quick ROI | Faster anomaly detection and shorter time-to-insight (<2 hours initial) | Analytics teams, BI, rapid-response business monitoring | ⭐ Very fast deployment and reduced investigation time |
Reduced Data-Related Operational Costs and Rework | Medium, monitoring infra and optimization processes needed | Moderate, observability tooling, ops to act on alerts | Reduced outages, lower cloud costs, fewer manual investigations | Organizations with costly pipeline incidents (manufacturing, telecom, finance) | ⭐ Prevents outages and surfaces optimization opportunities |
Increased Trust in Data and Analytics | Medium, ongoing monitoring, governance processes and culture change | Moderate, shared dashboards, cross-functional collaboration | Higher data adoption, fewer disputes over data accuracy | C-suite decision-making, cross-functional analytics consumers | ⭐ Builds stakeholder confidence and accelerates adoption |
Improved Data Governance Maturity and Organizational Knowledge | Medium–High, sustained commitment to policies and documentation | Moderate–High, governance council, cataloging, periodic reviews | Institutional memory, documented lineage, continuous improvement | Enterprises formalizing governance and knowledge transfer | ⭐ Progressive maturity and documented governance evidence |
Enhanced Business Performance Monitoring and KPI Insights | Medium, requires KPI definitions and baseline tuning | Moderate, business stakeholder engagement, anomaly detection compute | Real-time KPI alerts, trend detection, faster business responses | Retail, SaaS, finance teams monitoring revenue or churn KPIs | ⭐ Detects KPI anomalies early and correlates root causes |
Strengthened Data Security and Compliance with Privacy Regulations | High, private/on-prem deployment, security policy alignment | High, infrastructure provisioning, security/ops management | Data residency compliance, reduced exposure, demonstrable controls | GDPR/CCPA-sensitive orgs, healthcare, financial services, public sector | ⭐ In-database execution and private deployment to protect sensitive data |
Turning Data Governance Benefits into Operating Reality
The eight data governance benefits reinforce one another. Quality controls create trusted data. Trusted data gives analysts and leaders the confidence to make faster decisions. Those decisions produce business outcomes worth monitoring, and business monitoring reveals new requirements for quality, ownership, lineage, timeliness, and access. The loop then feeds governance with evidence instead of assumptions.
The benchmark evidence points in the same direction. Ventana Research found that organizations connected governance with better decision-making data quality, reporting and BI accuracy, and regulatory compliance (benchmark summary). Precisely's research also associated governance-enabled data quality with operational efficiency, data-powered business models, compliance risk mitigation, and cost reduction (Precisely report). These findings don't eliminate the work of implementation. They clarify where to look for value.
Start with one high-stakes dataset. Choose a source that feeds a regulatory report, executive KPI, risk process, clinical workflow, customer operation, or AI product. Assign an owner, document what acceptable quality means, and instrument the dataset for the failure modes that matter most, such as invalid records, late delivery, anomalies, or schema changes.
Next, define the outcome before deploying controls. You might measure dashboard outage count, audit preparation hours, time-to-insight, incident resolution effort, or unexplained KPI changes. The metric should belong to a real stakeholder. If nobody owns the outcome, the governance program will drift toward activity measures, such as the number of rules written or assets cataloged.
Then expand module by module. Once the first dataset has a working response process, add related sources, business KPIs, platform consumption, or lineage where the operating need justifies it. digna offers anomaly detection, data validation, timeliness monitoring, schema tracking, Business Monitoring, and Data Platform Observability within a modular platform that runs in the customer's environment. Its stated ability to provide initial monitoring insights in under two hours can help teams begin seeing signals in days rather than waiting for a large program to mature, but the benefits come from disciplined ownership and response, not from any single tool.
Treat governance as a service to the people who make decisions with data. When controls prevent rework, explain failures, preserve audit evidence, and clarify whether a metric is fit for use, adoption becomes easier to sustain. That is how policy becomes operating reality.
digna provides in-environment data quality and observability modules for anomaly detection, validation, timeliness, schema changes, business KPIs, and platform behavior. Visit digna to explore a practical way to connect data governance controls with reliable analytics, AI, compliance evidence, and measurable operational outcomes.