Enterprise Data Quality Management: A Practical Guide
|
8
min read

At 8:47 a.m., an analytics lead opens the executive KPI dashboard and sees flat revenue. Last week's forecast promised double-digit growth. The chief revenue officer is already asking in a message thread who owns the number, while the source-of-truth report shows an overnight refresh with no obvious error.
Three pipelines feed the affected table. None logged a clear failure. The team checks the warehouse, traces the upstream event stream, inspects the dbt models, and finally reviews the BI layer. Two days earlier, a vendor had renamed a field in its payload. The resulting join failure removed rows without stopping the pipeline.
This is the operational gap that enterprise data quality management must close. It should detect schema drift, freshness gaps, missing-row anomalies, and unexpected business changes before they reach an executive meeting. The discipline isn't a quarterly cleanup exercise. It's a continuous control system for the data that powers reporting, analytics, compliance, and AI.
Table of Contents
When the Morning Dashboard Breaks and Nobody Knows Why
What Enterprise Data Quality Management Actually Means
Start with behavior, not only rules
Make contracts explicit
Treat freshness as a quality dimension
Track structure and connect the signals
Core Capabilities and the Metrics That Make Them Work
Architecture and Deployment Patterns for the Enterprise
Keep computation close to the data
Match isolation requirements to deployment
Buy capability in operational stages
Best Practices and a Realistic Implementation Roadmap
Phase one focuses on visible failures
Phase two turns assumptions into contracts
Phase three makes quality part of delivery
How a Modular Platform Solves Operational Problems
Rethinking Data Quality as an Operating Discipline
When the Morning Dashboard Breaks and Nobody Knows Why
The dashboard didn't fail in the way many expect. No warehouse outage appeared. No orchestration job turned red. No alert announced that the vendor payload had changed. From the platform's perspective, data continued moving, models continued running, and the BI tool continued serving queries.
From the business's perspective, the dashboard was wrong.
The investigation followed the usual path. The analytics lead compared the dashboard with a warehouse query, checked whether the overnight table had arrived, and reviewed pipeline logs. An engineer inspected the event stream for missing messages, then opened the transformation code to trace the affected join. The failure was downstream of ingestion but upstream of the dashboard, which left every team with partial evidence and no shared explanation.
Operational rule: A successful pipeline run doesn't prove that the data is fit for use.
The silent field rename was only one part of the incident. A schema tracker could have identified the structural change when the vendor payload arrived. A timeliness control could have flagged that the source was later than its normal delivery pattern. An anomaly detector could have noticed the missing-row pattern in the transformed table. A shared observability view could have connected those signals instead of forcing engineers to search four systems.
The difference matters because poor data quality creates a financial risk, not merely an engineering inconvenience. Gartner's estimate, cited in industry summaries of data management statistics, puts the average annual cost of poor data quality at $12.9 million per organization. The same source notes that MIT Sloan research is frequently cited as associating poor data quality with revenue losses of 15% to 25%. These figures frame quality management as an operating expense and revenue-protection discipline for large enterprises.
A working program would have treated the dashboard's revenue table as a monitored production asset. It would have defined expected volume, freshness, schema, and join behavior, assigned ownership, and routed meaningful deviations to the people who could respond.
The aim isn't to prevent every imperfect record. It's to ensure that a broken dashboard doesn't become the first monitoring signal.
For practical guidance on turning those signals into useful stakeholder views, see this approach to building data quality dashboards that actually work.
What Enterprise Data Quality Management Actually Means
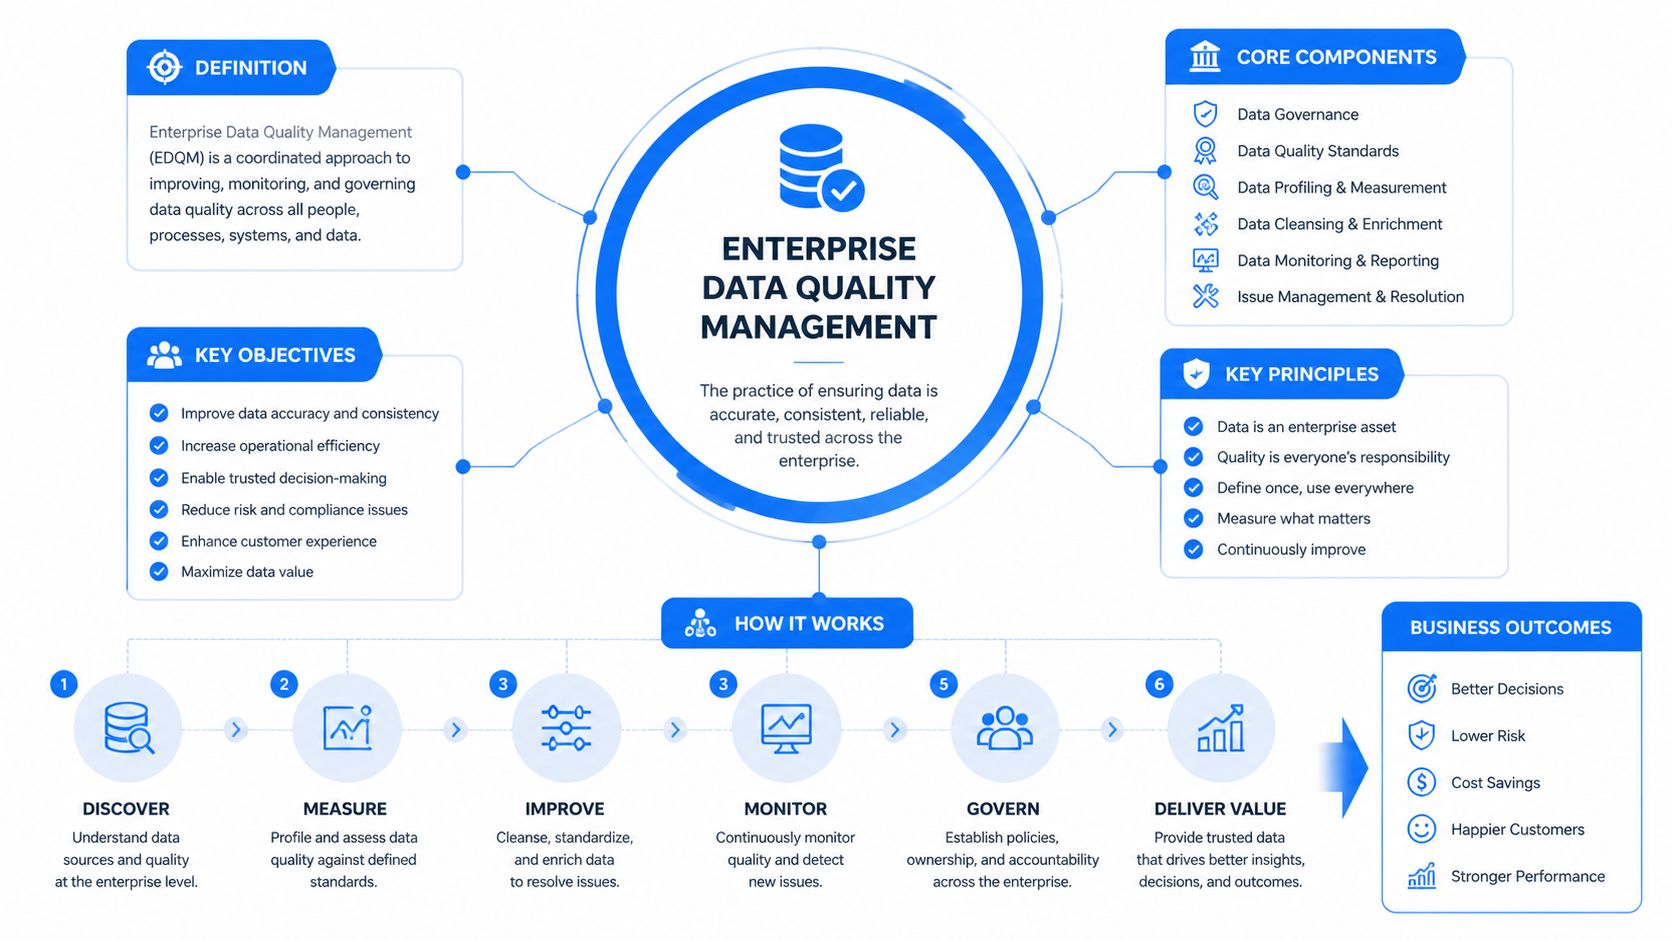
Enterprise data quality management is an operating discipline for keeping data fit for use as it moves through ingestion, transformation, storage, and consumption. It treats quality as a control loop, not a cleanup project: define expected behavior, check what arrives, explain deviations, assign response, and record the outcome. The EDM Council describes this work across the full data lifecycle, and its global data management benchmark report supports a maturity-oriented approach built around repeatable dimensions and scorecards.
That distinction matters during operational failures. A stale dashboard points to freshness controls, schema drift requires structural checks, pipeline delays require delivery monitoring, and an unexpected KPI may require reconciliation or anomaly analysis. Each capability should answer a recurring question and lead to a practical action.
Start with behavior, not only rules
Anomaly detection finds changes in data behavior before a team knows which rule to write. A sudden volume shift, unusual null pattern, or distribution change can expose an upstream failure even while the table still matches its declared schema.
A deterministic rule and a learned baseline serve different purposes. A rule can reject a missing required value. A baseline can flag a sharp change in that field's historical null rate. Scaled programs use both, because known violations and unfamiliar patterns require different signals.
Make contracts explicit
Validation rules enforce business and technical contracts. They can check formats, allowed values, field relationships, referential integrity, and conditions such as whether a transaction date precedes account creation.
A rule has operational value only when its meaning and response are clear. Each failed check should identify what changed, which consumers may be affected, and whether the pipeline should stop, quarantine records, or continue with an incident. Without an owner and response threshold, a growing rule set becomes noise.
Treat freshness as a quality dimension
Timeliness monitoring answers whether data is available and current when a dashboard, model, or operational process needs it. Data quality commonly includes accuracy, completeness, consistency, timeliness, validity, uniqueness, integrity, reliability, and accessibility, as outlined in this data quality dimensions guide.
The data quality dimensions guide also provides a useful vocabulary for discussing those dimensions. A dashboard can contain accurate values and still fail if its data is several days old. Timeliness controls should therefore compare expected arrival patterns with actual delivery, rather than checking only whether a scheduled job eventually finished.
Track structure and connect the signals
Schema tracking catches added or removed fields, data type changes, nullability changes, and altered nested paths. Observability connects schema, freshness, volume, quality, lineage, and platform signals so an engineer can investigate one operational event instead of searching separate systems.
Together, these components form a feedback loop. The system establishes expected behavior, detects a deviation, supplies context, routes the incident, and records the result. That loop protects trust in analytics and AI more effectively than a static catalog of checks.
Core Capabilities and the Metrics That Make Them Work
A scorecard becomes useful when each dimension leads to a decision. The nine commonly used dimensions provide a vocabulary, but engineers need measurable signals tied to tables, streams, models, owners, and escalation paths.
Accuracy is rarely a single universal percentage because the expected value may come from a reference system, a reconciliation process, or a trusted business calculation. At row level, teams can monitor outlier flags, unexpected value ranges, and mismatches against authoritative records. The metric matters only when someone knows whether the result should trigger investigation, quarantine, or acceptance.
Completeness needs more than a generic null check. Track null rates for required fields, missing business keys, gaps in date or event sequences, and absent partitions. A table can have a low overall null rate while a critical segment is missing the values that drive a regulatory report.
Consistency connects systems that should agree. Reconcile customer, account, order, or transaction counts across source and warehouse layers. Check referential integrity between fact and dimension tables, and flag incompatible definitions of the same KPI. Cross-system comparisons often expose issues that row-level validation misses.
Timeliness should use freshness lag, expected delivery windows, and the number of late or missing loads. The data timeliness monitoring guide is useful when defining freshness measures for tables and event streams. A scheduled expectation can state when a load should arrive, while a learned expectation can detect unusual drift in a normal delivery pattern, an approach described by digna's data pipeline best practices.
Validity covers schema conformance, permitted values, formats, and business rules. Uniqueness checks duplicate identifiers, repeated records, and unresolved entity matches. Integrity and accessibility can be added where relationships, permissions, and availability are material to the data product.
Dimension | Key Metrics | Operational Signal |
|---|---|---|
Accuracy | Outlier flags, reference mismatches, reconciliation results | Investigate unexpected values or source disagreements |
Completeness | Null rate, missing-key count, sequence gaps | Quarantine incomplete records or contact the producer |
Consistency | Cross-system variance, referential integrity failures | Trace conflicting definitions or broken relationships |
Timeliness | Freshness lag, late-load count, expected delivery variance | Escalate before a report or model uses stale data |
Validity | Schema conformance, allowed-value failures, rule violations | Reject, quarantine, or remediate invalid records |
Uniqueness | Duplicate count, duplicate-key rate, entity-resolution exceptions | Merge records or correct identity logic |
The scorecard should operate at the dataset and field level where possible. A table-level quality score can hide the exact column causing a failure, while a field-level view helps an engineer identify the broken contract quickly.
Teams building these controls may also need specialized hiring support, particularly when they need to recruit data quality engineers in LATAM. People remain part of the control system. Every metric needs an owner, a threshold, a notification route, and a response playbook.
Without those elements, measurements populate a report. With them, the scorecard tells the team what to do next.
Architecture and Deployment Patterns for the Enterprise
Architecture determines whether data quality controls become part of production operations or remain an isolated monitoring project. The right pattern depends on where sensitive data lives, how much infrastructure the team can operate, and how quickly security and procurement teams can approve a new service.
Keep computation close to the data
In-database or in-pipeline execution runs profiling, validation, and metric computation inside systems such as Snowflake, BigQuery, Databricks, or an orchestration layer. This reduces unnecessary movement of sensitive rows and lets controls run alongside the workloads they protect.
This pattern fits teams with strict PII boundaries or a preference for keeping raw data within existing governance controls. It also limits a common implementation problem, where monitoring requires a second copy of production data and introduces another synchronization path.
Match isolation requirements to deployment
Banks, healthcare organizations, and government teams may require private cloud, VPC-isolated, or on-premises deployment. The decision isn't only about technical preference. It can depend on data residency, internal security reviews, network architecture, and whether a vendor can operate without accessing production records.
A deployment that satisfies security requirements but demands extensive infrastructure ownership may overwhelm a small platform team. Conversely, a convenient hosted option may stall during vendor review if it conflicts with the organization's handling rules.
Buy capability in operational stages
Modular licensing lets a team begin with a focused problem, such as anomaly detection or timeliness, then add schema tracking, validation, or broader observability as ownership and response routines mature. This avoids paying for controls that the organization can't yet operate effectively.
Pattern | Where It Runs | Best Fit | Key Trade-off |
|---|---|---|---|
In-database or in-pipeline | Warehouse, lakehouse, or orchestrator | Teams minimizing data movement | Must fit existing compute and pipeline patterns |
Private or isolated deployment | Customer cloud, VPC, or data center | Regulated or security-sensitive estates | Requires infrastructure and approval capacity |
Modular adoption | Selected capabilities first, broader coverage later | Small teams proving value incrementally | Coverage can remain fragmented without a growth plan |
Architecture is also a procurement story. A technically capable engine won't create value if legal review blocks deployment, budget approval arrives too late, or engineers must maintain an architecture that doesn't fit their stack. Teams evaluating the surrounding enterprise data platform should include security boundaries, integration effort, ownership, and operating cost in the same decision.
Best Practices and a Realistic Implementation Roadmap
A rollout should begin with business-critical failure modes, not an attempt to monitor every asset at once. The first objective is to stop the organization from learning about data breakage through executive escalation.
Phase one focuses on visible failures
Start by instrumenting the top five revenue-critical tables. Set volume and freshness alerts, then route them to the team's existing Slack or PagerDuty workflow. The exact channel matters less than ensuring that the people responsible for the data see the signal before dashboard consumers do.
Use the first phase to establish baselines and ownership. Record the normal arrival pattern, expected volume behavior, critical fields, downstream consumers, and escalation contact for each table. Don't add complex business rules until the team can respond reliably to basic freshness and volume incidents.
Phase two turns assumptions into contracts
Next, work with producing teams to define validation rules for the fields and relationships that matter. A data contract should identify the schema, accepted values, required fields, ownership, and what happens when the producer changes the structure.
Schema-change notifications should arrive before drift reaches downstream models. The notification should include the changed field, type or structural difference, first observed occurrence, affected dataset, and known consumers. That context helps the producer fix the source rather than asking every downstream team to rediscover the same break.
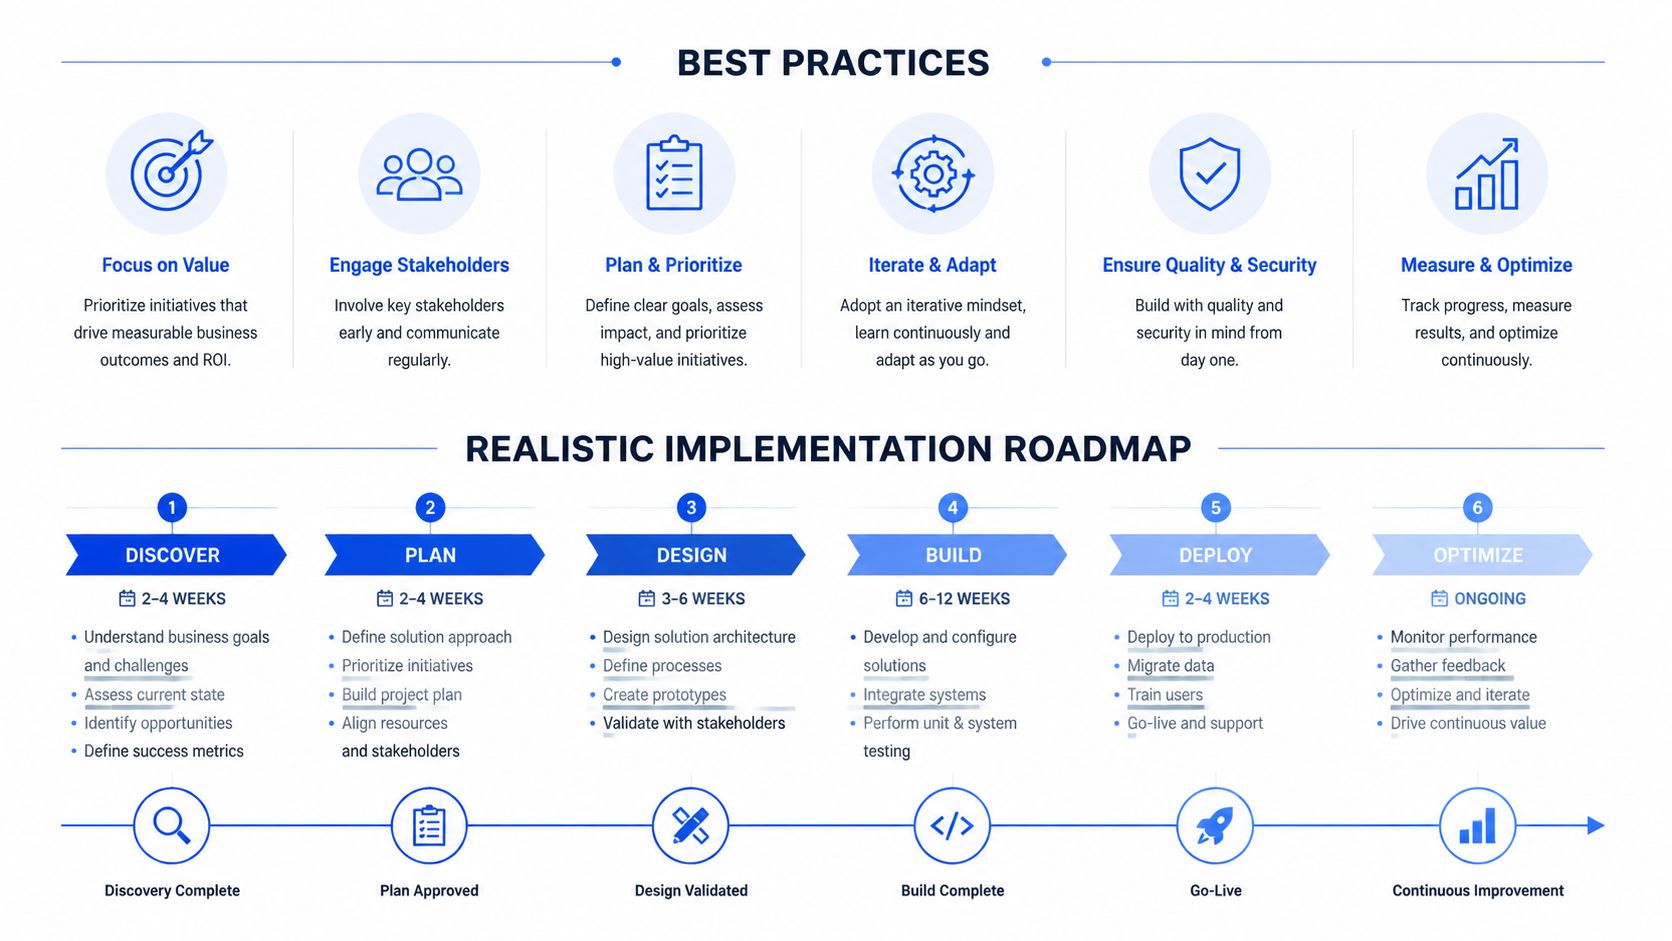
Phase three makes quality part of delivery
Embed important checks into CI for pipeline code and schema changes. A pull request that changes a model or contract should show which quality controls are affected and whether known consumers remain compatible.
Standardize incident postmortems around the failure mechanism, detection gap, ownership gap, and preventive control. Tie quality KPIs to SLA reviews so recurring incidents affect planning and service discussions, not just an engineering backlog.
A practical data quality implementation approach should also include the habits that keep coverage from degrading:
Use shared names: Apply consistent naming for dimensions, metrics, alerts, datasets, and severity levels.
Maintain one rule source: Store active contracts and validation definitions in a location teams can find and review.
Assign dataset owners: Give every critical asset a named business owner and a technical responder.
Review alert behavior: Examine which alerts still fire, which are ignored, and which no longer represent meaningful risk.
Document exceptions: Record accepted deviations so temporary waivers don't become invisible permanent failures.
The program becomes sustainable when each new check has a reason, an owner, and a response path. Coverage should expand because the team has learned from incidents, not because a dashboard looks more complete.
How a Modular Platform Solves Operational Problems
A modular platform is easier to evaluate when each module is connected to a failure mode. The question isn't whether a feature exists. The question is what someone can detect or prevent with it during a real operating week.
Anomaly detection addresses the surprise-dashboard problem. A retailer might monitor promotional revenue, order volumes, and customer activity against learned baselines. An unusual movement can prompt investigation before an executive review, even when the underlying pipeline reports success.
Schema tracking addresses the broken-nightly-job problem. A logistics team receiving fleet telemetry may need to know when a source adds a field, removes one, changes a type, or alters a nested path. Comparing field sets and structural properties gives engineers an early signal before downstream transformations fail. Practical monitoring guidance recommends recording the source, dataset, contract version, first occurrence, and affected consumers, which makes remediation more direct. These details are covered in schema drift monitoring guidance.
Timeliness controls address stale-report incidents. A finance team can define expected delivery behavior for risk or transaction data and distinguish a late load from an expected calendar variation. The result is a response signal based on business availability, not merely job completion.
Validation rules address regulatory-filing risk. A bank can test counterparty fields, permitted values, required relationships, and audit conditions before a submission workflow consumes the data. The control doesn't replace governance. It turns governance requirements into repeatable pipeline behavior.
Observability addresses the problem of not knowing what the team doesn't know. It connects freshness, schema, volume, validation, business metrics, and platform behavior so engineers can investigate a deviation in context.
A platform such as digna combines anomaly detection, timeliness monitoring, record-level validation, schema tracking, historical analysis, and in-database execution, with deployment inside a customer's cloud, VPC, or data center. Its modular structure allows teams to start with a narrow operational need and expand only when they can assign ownership and response capacity.
That approach also protects existing investments. Teams don't need to replace every pipeline to add monitoring. They can place controls around the most important data products, prove that incidents become easier to detect and resolve, and then extend coverage across finance, healthcare, telecommunications, or public-sector domains.
Rethinking Data Quality as an Operating Discipline
Adding more validation rules feels productive because the rule count is easy to display. It doesn't guarantee trustworthy data. A rule without an owner, a threshold without a response plan, and a dashboard without escalation create the appearance of control while the same failures continue.
The operational measure is different. Ask whether the team detects incidents earlier, identifies root causes faster, protects reporting cycles, and reduces repeated reconciliation work. Enterprise survey findings show why this matters: in a 2024 industry brief, 95% of data leaders and practitioners reported a data quality issue with direct business impact, 95% said observability alone wasn't enough to determine root cause, and 87% said traditional rules-based approaches didn't scale. Those figures are reported in Anomalo's State of Enterprise Data Quality executive brief.
Three operating shifts make the difference:
Assign ownership: Every critical dataset needs a named business owner and technical responder.
Tie metrics to outcomes: Connect freshness, completeness, and anomaly signals to reports, models, regulatory workflows, and business KPIs.
Review failure modes: Examine recurring incidents quarterly and remove or revise controls that teams routinely ignore.
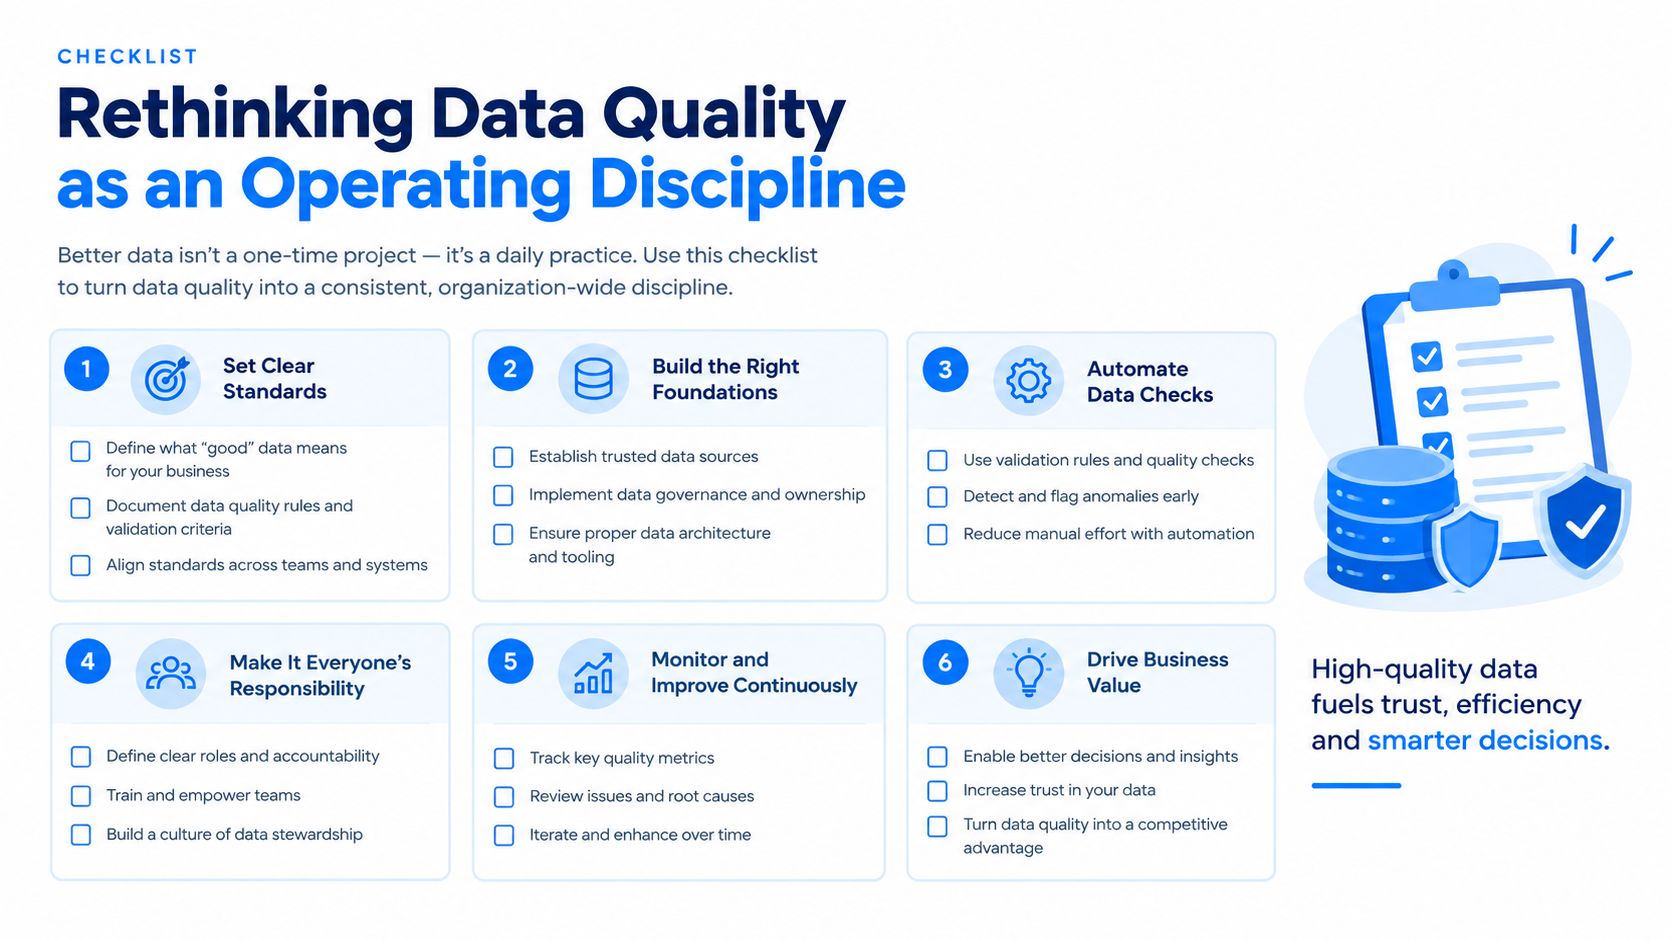
Use this checklist at the start of the next quarter:
Identify the critical datasets behind the most important decisions.
Confirm the owner, responder, threshold, and escalation route for each one.
Remove duplicate or unactionable rules.
Add monitoring for the most common freshness, schema, volume, and completeness failures.
Review every alert that was ignored and decide whether to fix, suppress, or escalate it.
Record the prevention step for each recurring incident.
Enterprise data quality management works when controls become part of how teams operate data products. Start with the failures that interrupt decisions, then build the technical coverage and accountability needed to prevent them from returning.
If stale dashboards, silent schema changes, or unexplained KPI shifts are consuming your team's time, visit digna to explore an in-environment platform for anomaly detection, timeliness monitoring, validation, and schema tracking. Start with the data assets that matter most, connect alerts to accountable owners, and expand coverage as your operating model matures.
For the detection layer that catches the failures no rule was written for, see data observability.
Frequently asked questions
What is enterprise data quality management?
It is the practice of keeping data trustworthy across an entire estate rather than per project, combining behavioural monitoring, explicit data contracts, freshness tracking and schema awareness so that problems surface before a decision is made on them.
Why do dashboards break when no pipeline reported a failure?
Because most damage is silent. A vendor renames a field in its payload, a join quietly drops the rows that depended on it, and every job still reports success. Orchestration confirms that software ran; it says nothing about whether the resulting numbers still mean what they did last week.
Which metrics matter most in enterprise data quality?
Coverage of critical datasets, time to detect and time to resolve, recurrence rate, and the share of issues found by monitoring rather than reported by a business user. That last one is the clearest signal of whether your controls or your stakeholders are doing the detection.
Where should data quality checks run?
As close to the data as possible. Keeping computation in the warehouse avoids moving sensitive records outside their existing security perimeter and scales with storage you already pay for, which matters when isolation requirements rule out extracting data to an external service.
What does a realistic rollout look like?
Three phases. Start with visible failures so the value is obvious, then turn the assumptions behind them into explicit contracts, then make quality part of delivery so controls influence releases. Buying the full capability before phase one usually produces alerts nobody owns.