Quality Control Dataset: A Practical Design Guide
|
0
min. Lesezeit

Your dashboard looks fine until finance closes the month and asks why revenue is overstated. The pipeline didn't crash. The warehouse didn't go down. A transformation step dropped rows with null customer_id, and every downstream aggregate kept moving as if nothing happened.
That kind of failure is why teams need more than scattered tests and alert emails. They need a quality control dataset that acts like an operational memory for the pipeline: what was checked, what “normal” looks like, what changed, who owns the issue, and how to tell a real incident from noise.
A lot of teams already know they should validate data. The harder question is where to spend effort. Some datasets need continuous schema tracking and freshness thresholds. Others need a few strict business rules and occasional manual review. Treating every table the same usually creates rule sprawl, alert fatigue, and blind spots in the places that matter most.
Table of Contents
What a Quality Control Dataset Actually Is
A quality control dataset usually shows up after a painful incident. One common pattern is a finance dashboard reporting revenue far above actuals because upstream records were filtered incorrectly, duplicated, or partially loaded. Nobody notices at ingestion time because the pipeline still “succeeds.”
A quality control dataset is the structured, queryable record of how you detect and diagnose that kind of failure. It's not just a test result table. It holds the controls around the data: validation rules, expected baselines, sampled records worth inspecting, and audit metadata that tells you what happened and when.
Where it sits in the stack
Teams often confuse it with neighboring artifacts.
It isn't raw validation logs. Logs tell you a check ran. They usually don't preserve enough context to compare historical behavior or investigate drift.
It isn't a data catalog. A catalog tells you what a dataset is, who owns it, and maybe where it came from. It doesn't usually store pass and fail history or anomaly evidence.
It isn't a test fixture. Fixtures help developers verify transformations in controlled conditions. A quality control dataset lives alongside production operations and evolves with them.
The cleanest way to think about it is this: the pipeline produces business data, and the quality control dataset produces evidence about the trustworthiness of that data.
Practical rule: If your team can't answer “what changed, when did it start, and was it a rule violation or a behavioral shift?” from one place, you probably don't have a real quality control dataset yet.
Why it has to stay live
This isn't a one-time governance deliverable. It's a living operational asset. Standards work has pushed data quality toward explicit characteristics and measurable controls. ISO/IEC 25012 and ISO/IEC 25024 established both a general quality model and quantitative measures, which is why modern teams increasingly separate “describe the data” from “measure the quality.”
That distinction matters in production. Data changes shape. Upstream systems rename fields. Source latency shifts after a vendor rollout. A useful quality control dataset has to absorb those changes instead of fossilizing after the first implementation.
If you need a concise grounding in the broader discipline, this overview of data quality is a good companion to the operational model described here.
Core Components of a Quality Control Dataset
A quality control dataset becomes useful when it separates detection from diagnosis. Detection tells you something is wrong. Diagnosis tells you why, where, and who should act. Most failed implementations only do the first part.
The five components that matter
Every operational design I trust contains five layers.
Component | Purpose | Typical Storage |
|---|---|---|
Metadata layer | Identifies owner, SLA, lineage pointer, criticality, and escalation path | Catalog table, control schema, governance store |
Validation rules | Enforces schema constraints, nullability, business logic, and accepted formats | Version-controlled code plus rules table |
Statistical baselines | Captures expected behavior such as distributions, null patterns, volume, and cardinality | Metrics tables in warehouse or observability store |
Reference samples | Preserves golden records, edge cases, and known bad examples for review | Dedicated sample tables or curated review sets |
Audit trails | Stores timestamped outcomes, drift deltas, incidents, and resolution notes | QC history tables, incident system, observability layer |
What each layer does
The metadata layer anchors ownership. If a check fails and nobody knows who owns the dataset or what downstream process depends on it, the alert has limited value.
The validation rules layer catches deterministic failures. Primary key violations, illegal state transitions, broken date formats, and impossible values belong here. This is also where schema-aware logic starts to matter, especially when teams deal with nested or evolving structures. Understanding different schema types and change patterns helps avoid brittle rules that break every time a source system adds a field.
The statistical baselines layer catches behavior that still passes hard rules but is no longer normal. A table can be valid and still be suspicious if category distribution swings unexpectedly, duplicates rise, or a source arrives later than usual.
Why missing one component weakens the rest
Reference samples and audit trails are where many programs cut corners. That usually backfires.
Without reference samples, engineers can't quickly inspect edge cases or compare today's bad records with previously known failure patterns.
Without audit trails, every incident starts from zero. Teams lose history on when drift began, whether the same issue has recurred, and whether threshold tuning made things better or worse.
A check that only says “failed” is barely better than no check at all. Operators need evidence, not just status.
The strongest implementations treat the quality control dataset as a small operational model of the pipeline itself: rules, metrics, examples, and history in one queryable place.
Key Quality Dimensions You Need to Monitor
A single validator won't cover failure modes in production. Quality breaks along different axes, and each axis needs its own control logic.
Independent dataset-QC guidance treats accuracy, completeness, consistency, uniqueness, and timeliness as separate control dimensions because a dataset can be complete yet wrong, current yet inconsistent, or structurally intact but stale. That same guidance also recommends combining deterministic checks with statistical review for anomalies, missingness, and schema stability because many failures first show up as shifts in frequencies or latency rather than obvious row-level defects, as outlined in this dataset quality checks guide.

Six dimensions, six failure modes
Accuracy means the value matches reality or a trusted source. Reconciliations against ledger totals, source-of-truth systems, or approved reference data belong here.
Completeness asks whether required records and fields are present. Null spikes, partial loads, and missing partitions usually surface here first.
Consistency checks whether the same business entity is represented the same way across systems. Currency code mismatches and conflicting status labels are common examples.
Uniqueness protects against double counting and identity collisions. Duplicate events and repeated transaction IDs can corrupt reporting.
Validity enforces format and domain expectations. A field can be present and unique but still invalid if it violates pattern, range, or enumerated value rules.
Timeliness checks whether data arrived when the business expects it. A technically correct dataset can still be unusable if it arrives too late for reporting or decisions.
Timeliness needs a real threshold
Freshness is where vague monitoring often fails. A practical model is threshold based: compare the most recent timestamp in the dataset to current time and alert when the gap exceeds the defined SLA. One data observability example describes this as a freshness check where an hourly table breaches if the lag passes its allowed threshold.
That's much more useful than calling something “late” without a clock attached.
If you want a separate reference on how these dimensions map to operational checks, this guide to dimensions of data quality is worth keeping handy.
Real Examples of Quality Control Datasets in Practice
The easiest way to understand a quality control dataset is to look at what it stores when teams use it as a live asset instead of a static checklist.
Example patterns from production
Example | Quality Dimension | Stored Artifacts | Operational Signal |
|---|---|---|---|
Annotated training set review | Accuracy | Label provenance, reviewer IDs, disagreement flags, consensus status, sampled expert reviews | Systematic labeler drift or ambiguous classes |
Event schema registry feed | Validity and schema integrity | Column changes, timestamps, author, compatibility notes, prior schema snapshot | Breaking field rename, type change, or silent drift |
Freshness SLA dashboard | Timeliness | Expected arrival windows, actual ingest times, breach history, source status | Chronic lateness, missed loads, unstable source delivery |
Labeled data needs its own QC record
Annotated datasets are a strong example because teams often assume labels are “done” once curation finishes. They aren't. A NeurIPS paper reported an average 3.4% label error rate across evaluation sets in ten benchmark datasets, enough to affect model selection and benchmark ranking, according to the NeurIPS datasets and benchmarks paper.
That's why good quality control datasets for labeled data track reviewer provenance, disagreement counts, sampled expert rechecks, and acceptance criteria by risk tier. The same paper also notes workflows that re-review 10–20% of data to improve agreement in higher-stakes settings.
When labels drive model behavior, disagreement isn't noise to hide. It's a quality signal to store and investigate.
Schema history should be queryable
For event streams and shared warehouse tables, schema drift is often the incident before the incident. A producer renames a field. A downstream transform still runs but starts outputting nulls. A dashboard breaks later, far from the root cause.
A useful quality control dataset stores schema snapshots over time, plus who changed what and whether the change was backward compatible. That turns “something broke yesterday” into a query: what changed upstream before the break?
Freshness deserves its own artifact
Timeliness monitoring also works better when it has a dedicated dataset behind it. Instead of a binary alert, store expected arrival windows, actual arrival timestamps, and breach history by source. That lets teams separate one-off delays from chronic source instability and adjust escalation based on impact.
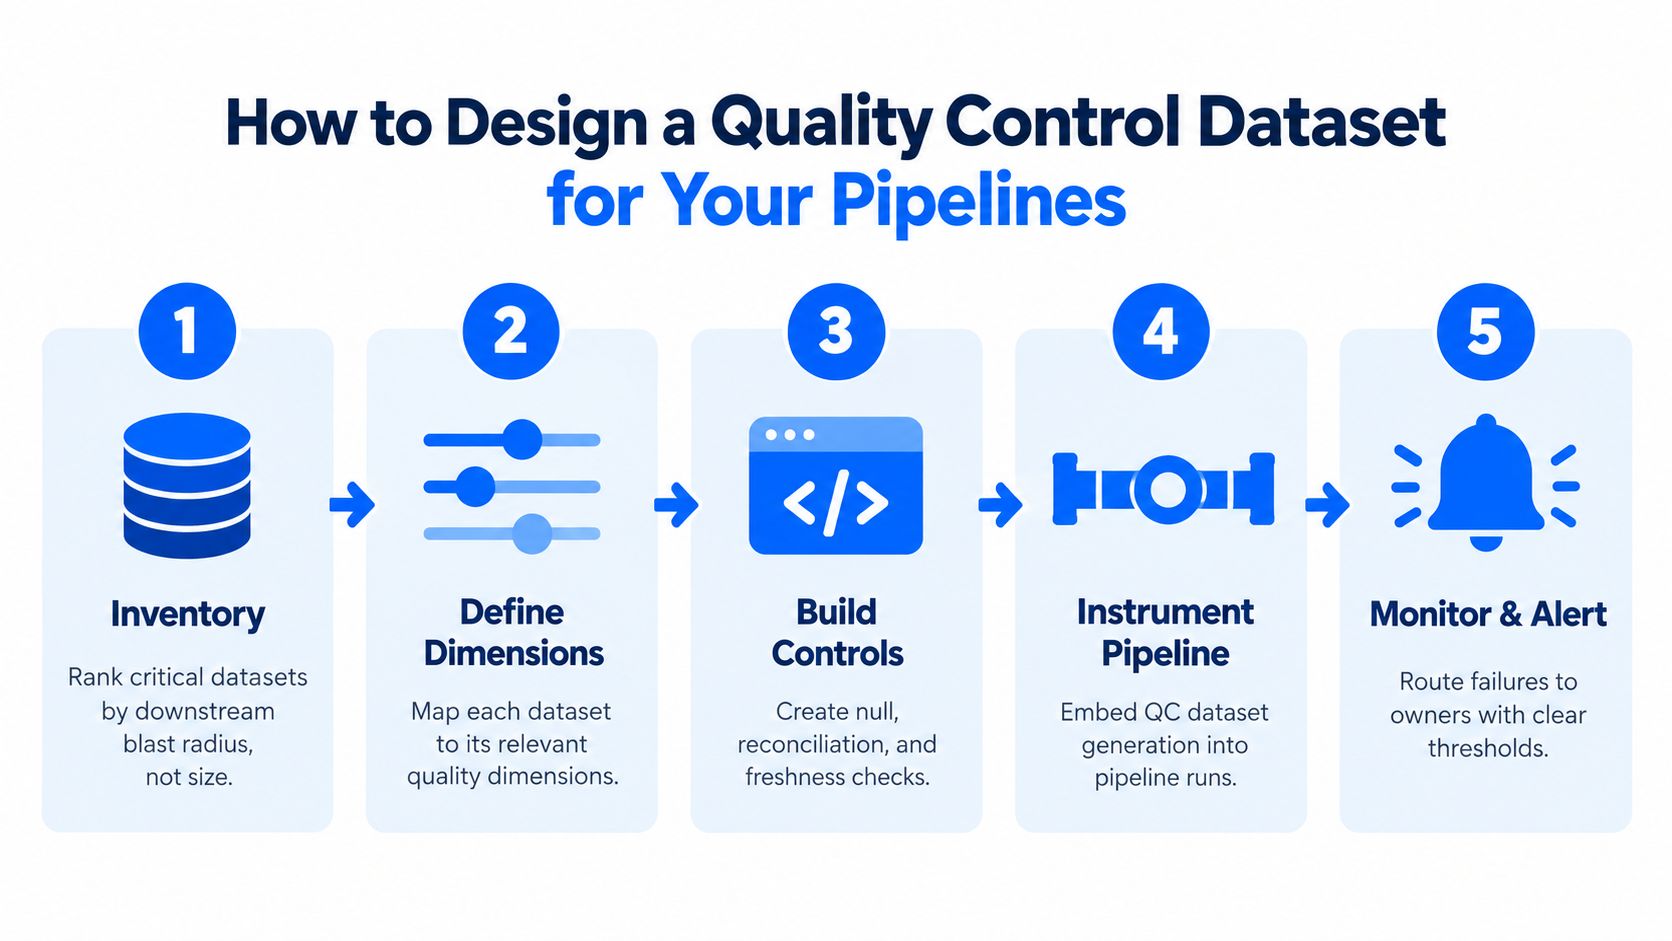
How to Design a Quality Control Dataset for Your Pipelines
Teams usually design this backward. They start with a tool, generate every check they can think of, then drown in alerts. The better sequence starts with business impact.
Start with blast radius, not dataset count
Inventory your critical datasets and rank them by downstream consequences if they go bad. Revenue recognition, regulatory reporting, executive dashboards, and model features used in production decisions sit higher than ad hoc analysis tables.
For each tier, define which dimensions matter most and what constitutes warning versus breach. Don't assign every dataset the same standard. A reference dimension table may need strict validity and occasional manual review. A customer events stream may need continuous uniqueness, schema, and timeliness monitoring.
Match the control to the failure mode
Use different validation strategies for different dimensions.
Deterministic rules work best for schema conformance, nullability, accepted ranges, and business logic.
Statistical baselines work better for volume, distribution changes, cardinality swings, and unusual missingness.
Anomaly review helps when behavior changes but the exact rule can't be fully specified in advance.
Store rules as code when possible. The rule should version with the transformation logic it protects. Also bind every rule to a dataset identifier, owner, and escalation path. A failing control without ownership becomes a Slack ghost that everybody ignores.
Emit results into the QC dataset itself
The quality control dataset shouldn't just define checks. It should also store outcomes from those checks.
At minimum, record:
Execution context: pipeline run ID, dataset name, environment, timestamp
Control result: pass, warn, fail, skipped
Evidence: offending rows, summary metrics, drift deltas, or schema diff
Operational metadata: owner, severity, ticket link, resolution note
A platform can help if it fits your environment. For example, digna's approach to data validation and continuous quality checks aligns deterministic validations with ongoing monitoring rather than treating them as separate programs.
Keep governance attached to operations
A quality control dataset survives staff turnover only if someone maintains it. Add a review cadence, retirement criteria for stale rules, and a post-incident feedback loop. If a check fires constantly without actionable outcomes, revise or remove it. If an incident slipped through, encode that lesson into a new control or baseline.
Operator habit: Every material data incident should end with one question: what should the quality control dataset remember so this is easier to catch next time?
Choosing the Right Monitoring Approach for Each Dataset
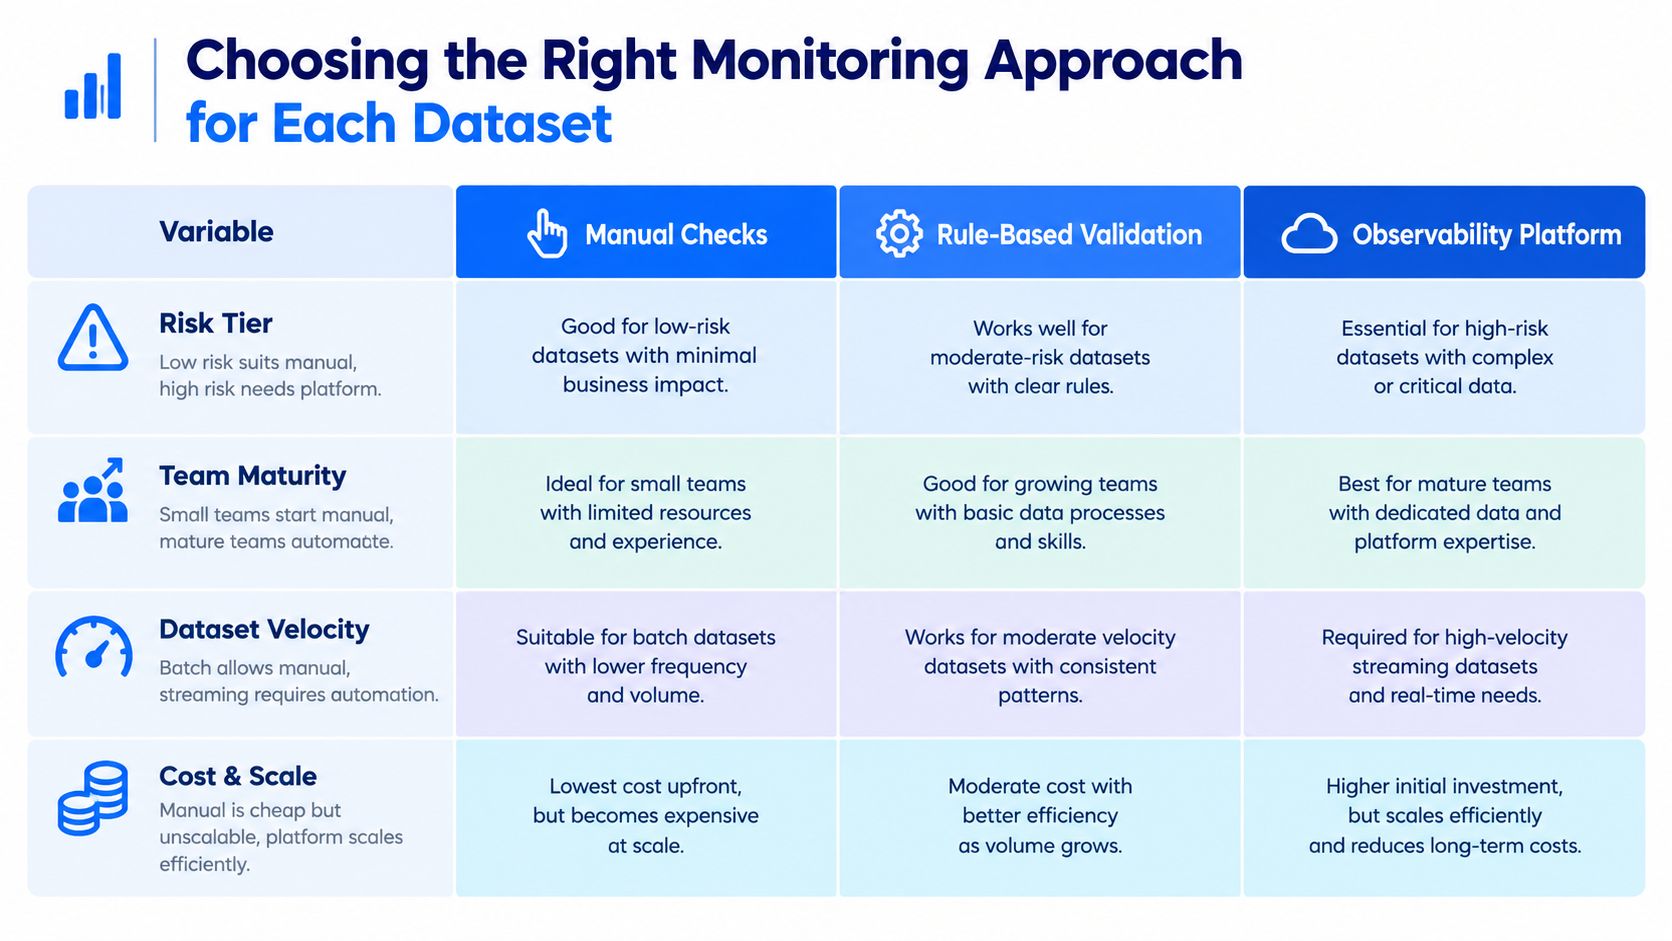
Monitoring strategy isn't a maturity ladder. It's a triage decision. The right answer depends on risk, velocity, and how expensive failure is.
A recent industry report found that 61% of organizations still rely on manual checks or SQL-based validation, 27% use a dedicated observability platform, and 31% cite limited visibility into pipeline health as the top challenge, according to the Integrate.io 2025 data quality and observability trends report. That lines up with what many teams experience in practice. The issue usually isn't whether QC matters. It's deciding where automation pays off.
When each approach fits
Manual checks still make sense for low-volume reference data, legal mappings, and workflows where human judgment matters more than speed. They break down once data changes frequently or incidents need fast response.
Rule-based validation covers a large share of important pipelines. It works well when the business can define clear constraints and the engineering team can keep rules close to transformation code.
Observability platforms earn their place on high-velocity, multi-source, high-blast-radius systems. That's where you need baselines, freshness monitoring, schema tracking, lineage context, and centralized alerting.
Escalation signals to watch
Move a dataset up the monitoring stack when you see patterns like these:
Rising false positives: thresholds are too brittle for current behavior
Frequent manual firefighting: engineers spend too much time investigating recurring issues
Stale-data complaints: stakeholders lose trust because the team detects lateness too late
Multi-team ownership: failures cross producer and consumer boundaries and need shared context
For teams evaluating observability options, this overview of data observability is useful because it frames the problem around operational visibility rather than generic monitoring.
Common Misconceptions That Undermine Data Quality Programs
Most weak programs don't fail because teams don't care. They fail because the operating assumptions are wrong.
The assumptions that cause trouble
Misconception | Operational Reality | Corrective Action |
|---|---|---|
More rules always improve quality | Rule sprawl creates noise and hides important failures | Prioritize controls by risk and actionability |
One-time curation is enough | Data behavior changes with sources, schemas, and usage | Review thresholds and baselines on a schedule |
Observability replaces governance | Tools surface incidents but don't assign ownership | Define owners, severity, and remediation paths |
QC datasets are only for ML | Analytics, finance, and regulatory pipelines suffer the same failure patterns | Apply the model across operational data domains |
Quality belongs only to the data team | Producers and business owners define many critical expectations | Share ownership by dataset and control type |
Why these beliefs persist
“Add more rules” sounds safe because it feels concrete. In practice, too many low-value checks bury the handful that protect the business. Teams stop trusting alerts, then real incidents blend into background noise.
“One-time cleanup” is another trap. Schema evolution alone makes static controls decay. In operational environments, schema tracking has to be continuous. digna's documentation, for example, describes continuous monitoring of table schemas, columns, and datatypes with comparisons against prior snapshots and alerts through dashboard, API, email, Slack, or webhooks. That's the right mental model even if you use a different tool.
What works instead
The durable pattern is narrower and stricter.
Pick fewer checks with clear owners.
Refresh baselines when source behavior changes.
Treat incidents as input for control design.
Keep evidence in the QC dataset, not buried in chat threads.
A quality program becomes credible when operators can tell which failures matter, who responds, and how the system learns from the incident.
Putting It All Together and Next Steps
A workable operating model has four layers. Start with the quality dimensions that matter for each dataset. Back those dimensions with structural components such as rules, baselines, samples, and audit history. Choose a monitoring approach that matches the dataset's risk and change rate. Then close the loop by turning incidents into threshold updates, new rules, or retired checks.
That sounds heavier than it is. In one sprint, a team can inventory critical datasets, rank them by downstream impact, define a small set of controls for each, and route failures into existing incident channels. Start with deterministic checks first. Add statistical baselines after the team has enough history to know what normal looks like.

The first move doesn't need to be ambitious. Pick three datasets this week. For each one, write down an owner, a completeness expectation, and a freshness threshold. The U.S. federal data community's current direction is a useful signal here: the American Statistical Association's 2025 report argues that agencies should provide readily available quality metrics, preserve historical data and metadata, and standardize citations and identifiers, as described in The Nation's Data at Risk 2025 report. That's the same operational discipline strong private-sector data teams need.
The teams that improve fastest don't try to monitor everything at once. They make one critical dataset measurable, then repeat the pattern.
digna gives teams a way to run data quality and observability inside their own environment, with in-database execution so monitoring SQL runs in the warehouse and only results and metadata are stored in the observability layer, as described in digna's data pipeline practices. If you're building a quality control dataset and need schema tracking, timeliness monitoring, validation, and anomaly detection without moving sensitive production data out of place, visit digna.


