Enterprise Data Quality Framework: From Metrics to AI Trust
|
8
min. Lesezeit

You can have a green dashboard and still be shipping bad data. The nightly pipeline finishes, the warehouse loads, the BI report refreshes, and someone on the business side still says the numbers feel off. That gap is where an enterprise data quality framework earns its keep, because quality is only useful when it's managed continuously, tied to ownership, and measured against what the data is supposed to do.
Table of Contents
What an Enterprise Data Quality Framework Really Solves
A real enterprise data quality framework solves the trust gap between data producers and data consumers. It's not a one-off cleansing sprint, it's a managed system of metrics, controls, ownership, and remediation that sits across pipelines, warehouses, and downstream use cases.
The failure mode is familiar. A revenue dashboard gets disputed in the close cycle. Analysts spend days reconciling source systems. An ML team retrains on data no one can certify. That's why quality now sits closer to observability and reliability than to back-office cleanup. In practice, the framework turns noisy signals like delayed loads, schema changes, and silent transformations into incidents someone owns.
Practical rule: if no one is accountable when a quality metric breaks, you don't have a framework, you have a report.
The strongest programs separate the framework from both ad-hoc rules and vendor features. Governance defines who owns the domain, architecture defines where checks live, and computational controls define what gets measured. That layered design is what lets teams move from noticing problems late to detecting them early and fixing them with evidence.
Core Components Every Framework Must Cover
A usable framework starts with the basics and layers intelligence on top. The point isn't to collect more checks, it's to cover the failure modes that break reporting, operations, and models.
Baselines, rules, and drift signals
Data profiling establishes the expected shape of the data. Validation rules enforce known constraints at ingest and transform boundaries, things like required fields, accepted values, and referential checks. Anomaly detection catches volume spikes, distribution shifts, and cardinality drift that static rules won't predict.
The operational value comes from how these layers complement each other. Profiling tells you what “normal” looks like. Validation blocks obvious violations. Anomaly detection catches the weird cases that look valid but aren't behaving normally. If you want a useful reference point for broader governance design, the Server Scheduler governance framework is a practical adjacent read because it treats control as an operating model, not a checklist.
Contracts, freshness, and critical fields
Schema tracking protects the interface between producers and consumers. It catches added columns, removed fields, and data type changes before a downstream dashboard or model breaks. Freshness and timeliness SLAs make the delivery expectation explicit, so teams can tell the difference between “loaded” and “usable.” Completeness and uniqueness checks protect the fields that power joins, billing, and feature engineering.
Core Framework Components and Their Operational Purpose | What It Detects | Where It Runs | Primary Signal |
|---|---|---|---|
Profiling | Baseline shape, null patterns, outliers | Warehouse or lakehouse | Historical distribution |
Validation | Rule breaches, invalid values | Ingestion and transformation | Pass or fail |
Anomaly detection | Volume, drift, cardinality surprises | In-database or external observability | Deviation from baseline |
Schema tracking | Structural changes | Orchestrator, warehouse, or catalog | Contract violation |
Freshness SLAs | Late or missing delivery | Pipeline and scheduling layer | Delivery delay |
Completeness and uniqueness | Missing critical fields, duplicate entities | Table and record level | Coverage and deduplication |
A practical framework also makes quality visible at the domain level. That's where a shared model like the one in digna's dimensions of data quality helps teams map signals to accountable owners without turning every check into a separate debate.
Governance Roles and the Human Layer
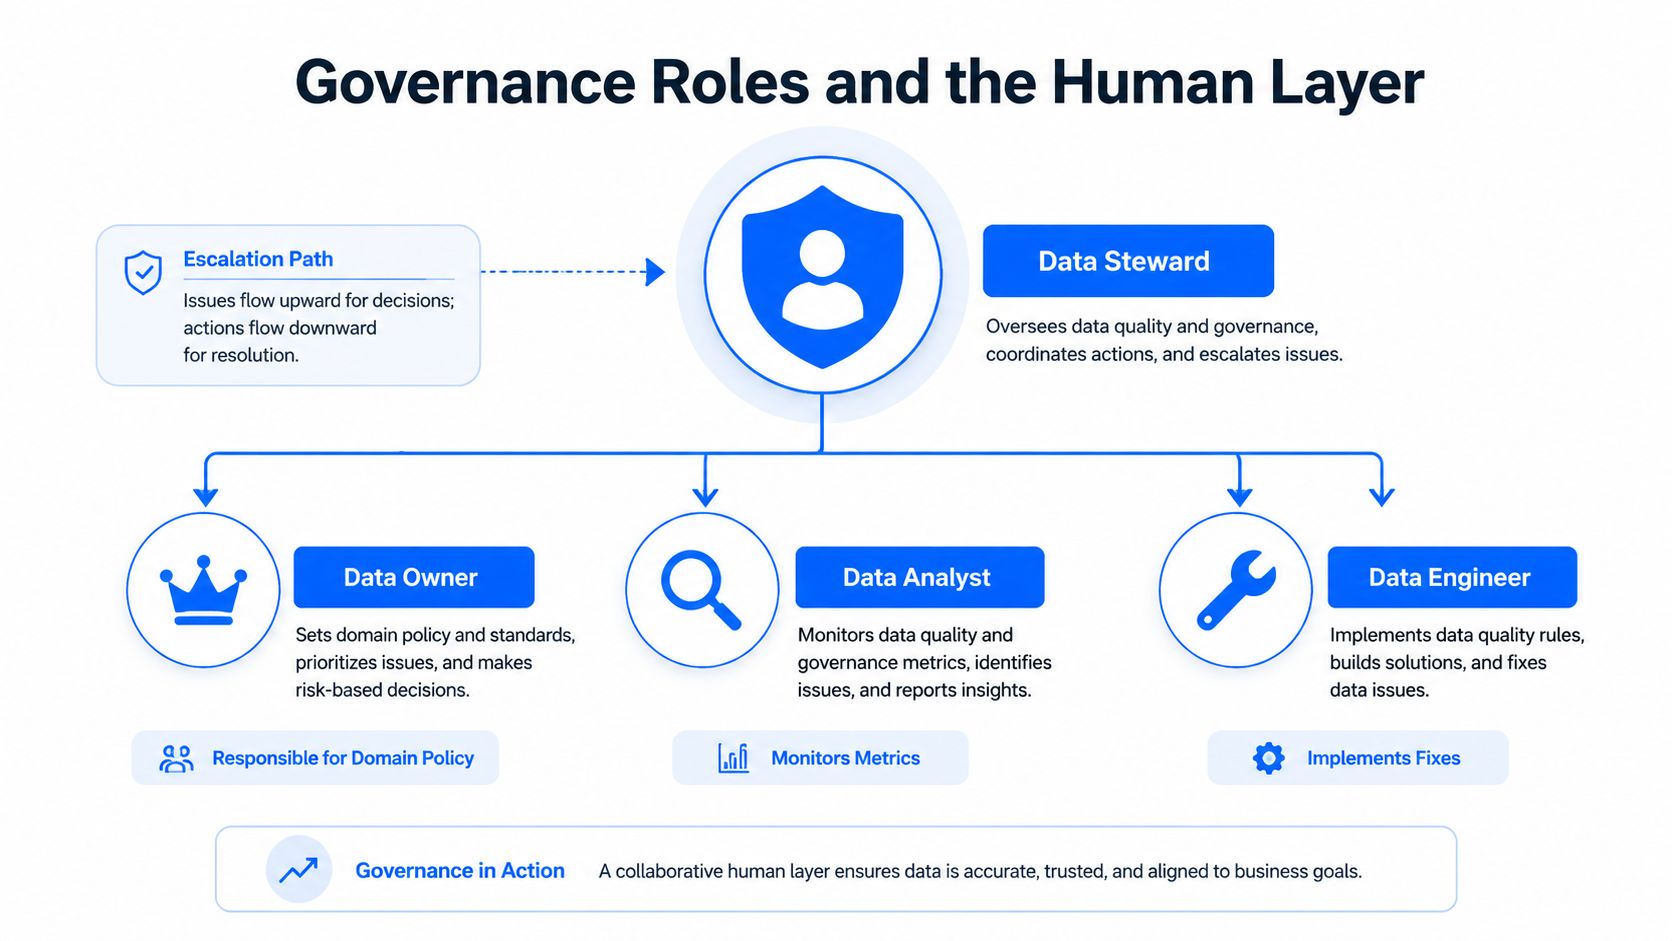
Technical checks don't resolve disagreements by themselves. A broken threshold, a disputed metric definition, or a late upstream file still needs a human owner, and the framework has to say who that is before the alert fires.
Who owns the response
The cleanest accountability stack is simple. Data owners accept business responsibility for correctness. Data stewards triage alerts and coordinate remediation. Data custodians and data engineers implement the controls and fix the pipeline. A data council or governance body settles cross-domain conflicts and signs off on policy.
That structure matters more in regulated industries because the evidence trail has to survive audit. In finance, healthcare, and insurance, it's not enough to say a problem was fixed. Teams need to show what failed, who saw it, what action was taken, and when the data returned to service. In faster-moving companies, the documentation burden can be lighter, but the role model still needs to exist.
Policies that turn signal into action
Alerts from anomaly detection, schema tracking, and freshness SLAs should route into ticketing with explicit service levels. Data contracts define the expected shape and behavior of a dataset. Quality SLAs define when response is due. Runbooks define the fix path. Without those artifacts, monitoring just creates noise.
For a more detailed view of how roles map to operating practice, the data governance roles guide is a useful internal reference point. It's especially relevant when a steward has to decide whether an incident is a producer issue, a transformation issue, or a consumer expectation problem.
When the alert reaches a steward, the clock starts on response, not discovery.
Architecture Patterns for Data Quality at Scale
Enterprise teams usually end up with one of three patterns. The right choice depends on where the data lives, how sensitive it is, and how much statistical intelligence the stack needs.
In-database, external, or hybrid
In-database quality uses ANSI SQL, dbt tests, and warehouse-native functions. It keeps data movement low and fits tightly with access control, which is why it's often the safer choice for regulated PII environments. The trade-off is that large fact tables can make repeated checks expensive, and SQL-only approaches don't always handle historical anomaly patterns gracefully.
External observability platforms profile and monitor outside the warehouse. They're better at cross-source correlation, baseline learning, and trend analysis across long histories. The trade-off is a broader security review surface and metadata replication that some platform teams don't want.
A useful design pattern is hybrid. Run lightweight checks in-database, then push ML-driven drift detection and historical analysis to an external layer. That's also where the data warehouse design for engineering leaders perspective helps, because architecture decisions and quality decisions end up shaping each other.
Enforcement at the pipeline layer
Declarative contracts, schema registries, and freshness SLAs belong in orchestration, not in a separate spreadsheet of standards. The point is to make quality part of deployment and delivery. If a producer changes a field or a batch misses its window, the pipeline should surface that immediately instead of waiting for a dashboard complaint.
In-Database vs External Data Quality Architecture | In-Database (SQL/dbt/Native) | External Observability Platform | Hybrid Pattern |
|---|---|---|---|
Data movement | Low | Higher due to metadata sync | Low for checks, higher for analytics |
Security posture | Strong inside the warehouse | Requires added review | Balanced by control type |
Anomaly detection | Limited unless custom-built | Strong historical baseline support | Lightweight plus ML-driven drift |
Time to value | Fast for standard checks | Faster for broad visibility | Moderate, but scalable |
Scale on large tables | Can be costly | Better for cross-table trends | Split by use case |
Best fit | Regulated, cost-sensitive estates | Multi-team, fast-onboarding estates | Mixed maturity environments |
For a deeper architecture lens, the digna data system architecture page is useful because it shows how quality checks fit into the platform layer rather than sitting off to the side.
Implementation Roadmap for Modern Warehouses and Pipelines
The rollout works best when it starts small and gets broader only after the first controls prove useful. Teams that try to cover every dataset on day one usually end up with a lot of rules and very little adoption.

Start with the datasets that matter
Begin by inventorying critical datasets, downstream consumers, and known failure points. Then baseline the current state, including the incidents that are already happening but only get fixed in spreadsheets or meetings. That gives the program a measurable starting point instead of a theoretical target.
Embed checks where data moves
Instrument ingestion and transformation code with schema tests, null checks, range checks, and freshness assertions. Don't bolt them on later. If the check lives beside the code that creates the data, engineers are much more likely to treat it as part of release quality.
Automate escalation and broaden coverage
Once the basics are stable, add anomaly detection, auto-quarantine of bad rows, and ticketing workflows that route to the right steward. After that, expand coverage with metadata-driven test generation and templated SLAs so long-tail datasets don't get ignored. The implementation guide at digna's data quality implementation page is relevant here because it aligns rollout with operational maturity rather than tool novelty.
The most useful success signal is boring. Fewer restatements, fewer manual reconciliations, fewer late discoveries.
Making the Framework AI and ML Ready
Traditional rules-based quality programs stop too early for AI. They catch nulls, duplicates, and broken referential integrity, but they often miss the conditions that poison model outputs.
What changes once models consume the data
AI-ready quality adds lineage, training snapshot profiling, bias and fairness checks, and feature drift monitoring. It also adds provenance controls, version hashes, and reproducibility expectations so teams can trace a prediction back to the dataset that produced it. For LLM pipelines, prompt and embedding lineage matter too, because the model input path becomes part of the audit story.
That shift changes the KPI set. Feature freshness, label quality, distribution shift velocity, and the share of predictions tied to certified datasets become more relevant than raw rule-pass rates. If the serving environment is consuming stale features, the model can be technically “healthy” and still be wrong.
Where traditional DQ falls short
Legacy rules rarely tell you whether a training set reflects the live population. They won't catch sampling bias just because every row is valid. They won't surface label leakage just because the schema looks clean. That's why AI-ready programs need monitoring that understands model context, not only table integrity.
The enterprise AI enablement guide is a helpful complement because it treats data readiness as part of the broader operating model, not a separate ML project. For feature-level monitoring, digna's model drift detection fits naturally into the same control layer.
Traditional vs AI-Ready Data Quality Controls | Traditional Rules-Based DQ | AI/ML-Ready DQ | KPI to Monitor |
|---|---|---|---|
Validity | Format and range checks | Feature distribution checks | Rule-pass rate |
Completeness | Missing field detection | Missingness by segment | Missing-value coverage |
Uniqueness | Duplicate entity detection | Entity resolution across training sets | Duplicate rate |
Lineage | Limited or manual | End-to-end feature provenance | Lineage coverage |
Freshness | Pipeline delivery timing | Feature age versus inference window | Feature freshness gap |
Bias and fairness | Usually absent | Protected-attribute segmentation | Bias variance |
End-to-End Scenario Where the Framework Pays Off
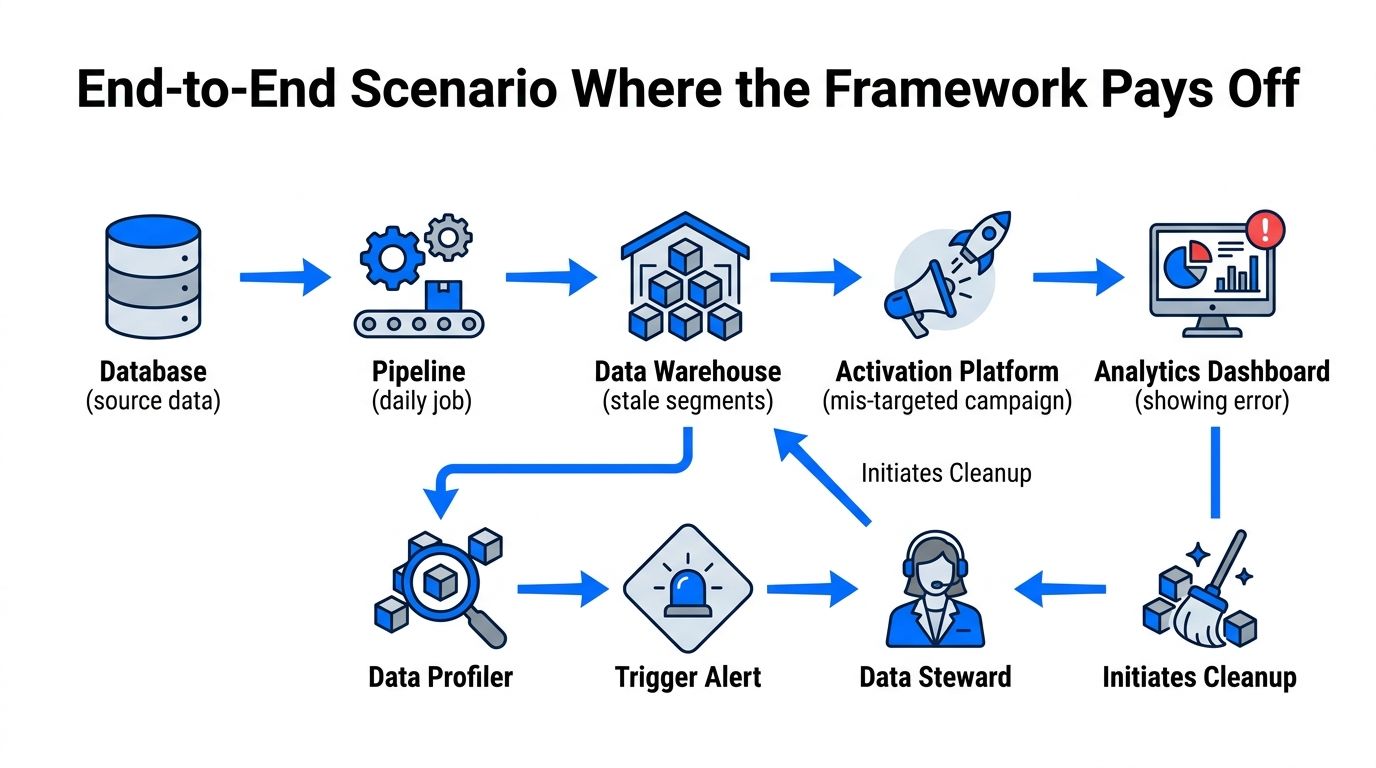
A customer analytics pipeline runs every night, and the job finishes on schedule. The activation team assumes the segment refresh is current, but one source table has stopped updating for seven days. The data is arriving on time, yet it's still not current enough for the campaign logic.
How the signals stack up
A profiler sees the customer tier attribute drifting away from its normal pattern. Schema tracking catches a silent column rename before the downstream join starts failing. Anomaly detection flags a sudden drop in the null rate for a critical flag, which usually means the upstream source has changed behavior. Freshness SLAs then confirm the issue: the source is stale even though the pipeline itself is green.
The steward gets the alert, the owner approves the remediation, and the engineering team reopens the backfill. Downstream ML features stay quarantined until the validated data version is ready again. In a regulated enterprise, the audit trail matters as much as the fix because retraining cadence and evidence of control are both part of the story.
Framework Self-Assessment and KPIs
A good framework can be scored in a quarterly review. If the signals, roles, and response paths are clear, maturity becomes visible without a long debate.
What to check
Signals: completeness, validity, uniqueness, freshness, schema, anomaly detection.
Roles: executive sponsor, data owners, stewards, custodians, consumers.
KPIs: incident MTTR, percentage of datasets with active SLAs, false-positive rate on alerts, lineage coverage, AI-feature drift score, remediation backlog.
Enterprise Data Quality Framework Self-Assessment KPIs | Measurement Source | Baseline Target | Decision Rule |
|---|---|---|---|
Incident MTTR | Ticketing and incident logs | Trending down | Acceptable when stable and improving |
Datasets with active DQ SLAs | Governance registry | Broad coverage on critical data | Watchlist when coverage is partial |
False-positive rate on alerts | Alert history | Low enough to sustain trust | Failing when teams mute alerts |
Lineage coverage | Catalog and lineage tool | End-to-end for critical flows | Watchlist when impact is unclear |
AI-feature drift score | Model monitoring layer | Within expected baseline | Failing when drift is persistent |
Remediation backlog | Steward workflow | Small and aging slowly | Failing when tickets pile up |
A mature program doesn't just produce cleaner tables. It gives leaders a way to see whether the framework is controlling risk, improving trust, and keeping AI inputs usable.
digna supports this kind of operating model with in-database checks, timeliness monitoring, schema tracking, anomaly detection, and historical analysis in the customer's own environment. If you're building an enterprise data quality framework that has to work across warehouses, pipelines, and AI consumers, visit digna to see how those controls fit together in practice.


