10 Database Management Best Practices for 2026
|
5
min read
Beyond the Basics: Modernizing Database Management
Your databases are probably up. Backups run. Indexes exist. Replication is in place. Yet people still question the numbers in dashboards, analysts still find broken joins after a release, and a late pipeline still turns a morning decision into a guess. That's the common state of database management in many enterprises today.
Stable infrastructure is only the starting point. The harder problem is trust. Teams need to know that the data arriving in the warehouse is complete, structurally consistent, on time, and still aligned with the business logic that downstream systems assume. When that trust breaks, the damage rarely starts with an outage. It starts with a quiet schema change, a missing load, a malformed record, or a metric that drifts just enough to mislead a team for days.
Traditional database management best practices still matter. You still need access control, backup discipline, query tuning, and lifecycle planning. But those basics no longer cover the failure modes that matter most in modern data stacks. Observability has moved from a nice-to-have layer to a core operating principle.
That's why the best teams now treat anomaly detection, timeliness monitoring, schema tracking, and record-level validation as part of database management itself, not as optional tooling around the edges. Platforms like digna fit this shift well because they run analyses inside the customer environment, monitor quality continuously, and give engineers and business users a shared view of what changed and why it matters.
This guide focuses on the practices that keep enterprise data reliable under real operating conditions.
Table of Contents
1. Implement Continuous Data Quality Monitoring
Manual spot checks fail for the same reason manual security reviews fail. They tell you what was true at one moment, not what changed after the last deployment, source-system update, or late-night fix. Continuous monitoring closes that gap.
In practice, this means watching critical datasets all the time for null spikes, unexpected category changes, duplicate records, broken relationships, suspicious volume patterns, and timeliness issues. A bank might watch payment streams for unusual transaction behavior. A hospital might watch patient records for missing mandatory fields and delayed updates. An e-commerce team might monitor inventory feeds so product availability doesn't drift away from what customers can buy.
Start where bad data hurts first
Start with the tables that feed executive reporting, customer-facing systems, regulated workflows, or machine learning features. If a table can change a decision, trigger an action, or create audit exposure, it belongs in the first monitoring wave.
A common mistake is trying to monitor everything equally. That creates noise and weakens response discipline. digna works best here when teams configure anomaly detection and validation on a focused set of high-value tables first, then expand coverage once ownership and alerting patterns are stable.
Prioritize business-critical assets: Monitor finance, customer, inventory, and compliance-related datasets before low-impact staging tables.
Define severity levels: A failed settlement feed should alert immediately. A minor change in a sandbox table can wait.
Assign responders early: Every alert needs a team and an escalation path, not a shared mailbox.
Review rules regularly: A validation rule that matched the business six months ago may now be wrong.
Practical rule: If an issue would trigger a meeting when discovered manually, it should already have automated monitoring.
Continuous monitoring changes team behavior. Engineers stop arguing about whether something is wrong and start investigating when it changed, where it started, and who needs to act.
2. Execute Data Quality Logic Inside the Database
A lot of data quality programs lose credibility because they depend on exporting sensitive data into external tools, running checks elsewhere, and then pushing results back into operational workflows. That architecture adds latency, risk, and failure points.
Running quality logic inside the database is often the cleaner option. Validation, anomaly checks, and metric computation stay close to the data, benefit from native execution, and avoid unnecessary movement across network and security boundaries. For teams in finance, healthcare, telecom, or the public sector, that matters because privacy and residency requirements aren't side issues. They shape architecture.
Here's the visual model many teams are moving toward:
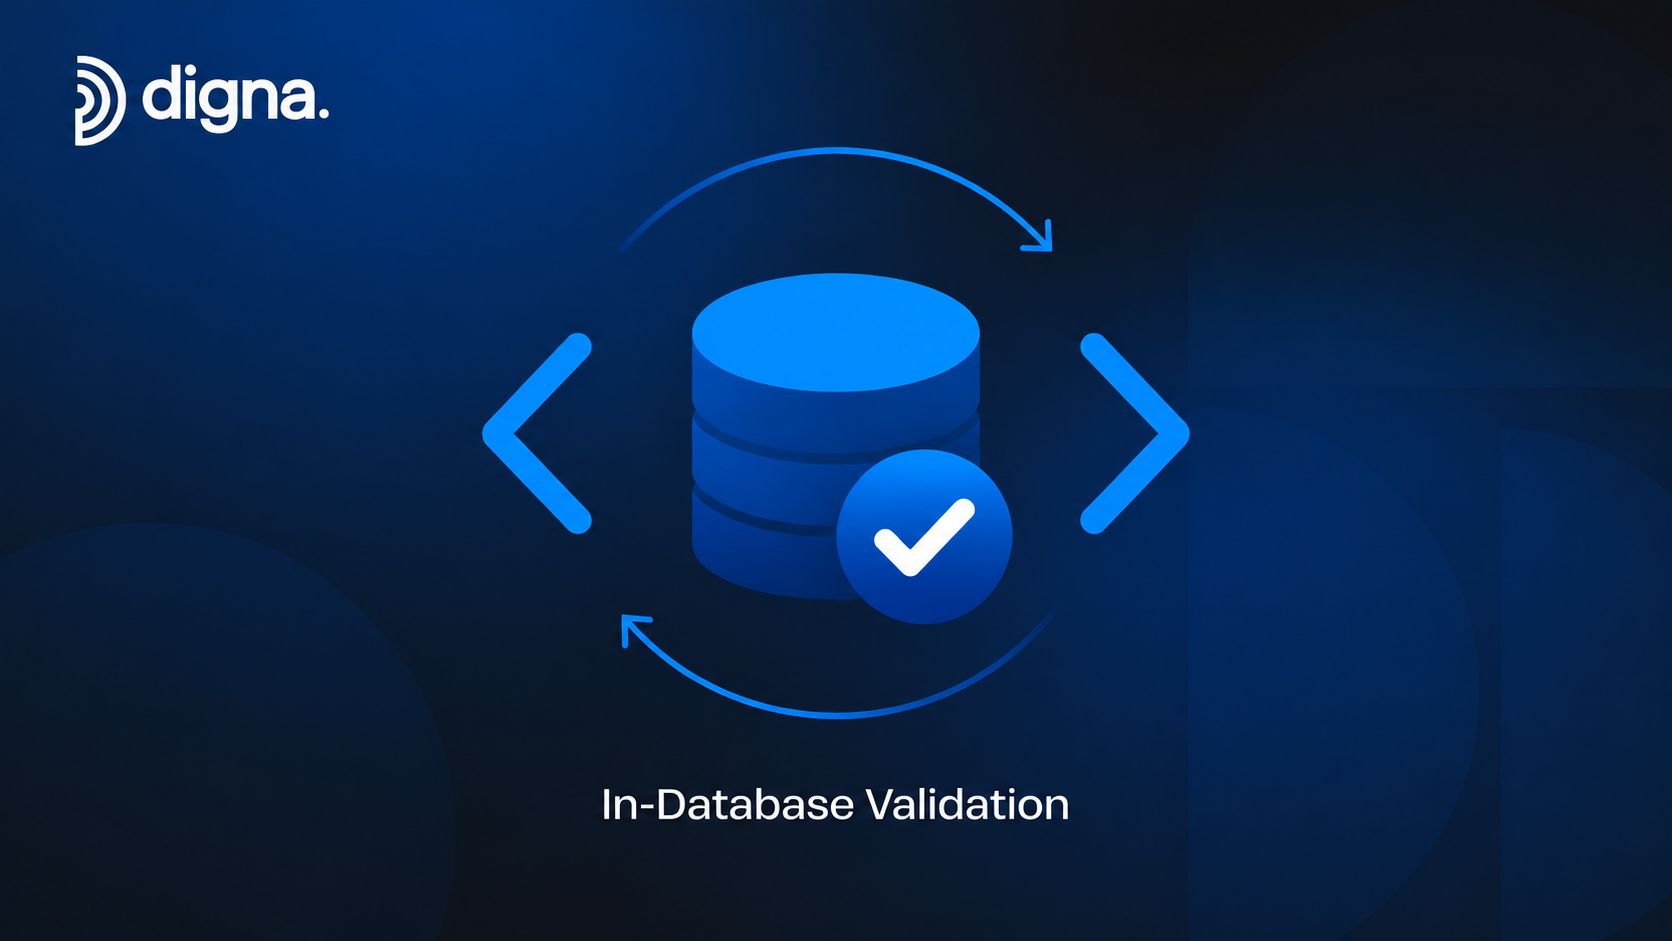
Keep the logic close to the data
When a healthcare team validates protected records entirely within an on-prem warehouse, it reduces exposure. When a telecom operator evaluates call detail quality without copying data into another service, it simplifies governance. The pattern is the same. Keep the computation where control is strongest.
digna is built around that model. Its in-database execution approach lets teams compute baselines, validations, and anomaly checks inside customer-controlled environments. That makes it easier to satisfy security expectations while still giving users an operational interface for trends, timeliness, and issues. The architectural case is laid out well in digna's guide to in-database data quality execution.
Use native database features: Materialized views, scheduled queries, and built-in functions usually outperform custom extraction patterns.
Schedule intelligently: Put heavier checks outside peak production windows when workloads compete.
Watch resource impact: In-database execution is powerful, but sloppy query design can still interfere with core workloads.
Document every calculation: Auditors and future teammates need to know how a check works and why it exists.
What doesn't work is splitting logic across five places. The database enforces one rule, the pipeline another, the BI layer a third, and nobody knows which one is authoritative.
3. Establish Schema Change Tracking and Management
Schema drift breaks trust faster than typically expected because it often looks harmless at first. A column type changes. A source team renames a field. A nullable flag shifts. Nothing crashes immediately, but downstream logic starts behaving differently.
Analytics engineers see it first when a model fails. BI developers see it when a dashboard field goes blank. ML teams see it when a feature no longer means what the training code expects. By that point, the schema change has already escaped into production.
Here's the kind of structural visibility that should be standard:

Treat schema drift like an operational event
Teams should monitor schema changes the same way they monitor failing jobs. Added columns, removed columns, type changes, constraint changes, and partition changes all deserve visibility when they affect critical assets. digna Schema Tracker fits this operational model by flagging structural changes so teams can inspect impact before the problem spreads.
The key trade-off is speed versus control. Fast-moving product teams want freedom to evolve source systems. Data consumers need predictability. The middle ground is simple. Allow change, but make it visible, attributable, and reviewable.
Silent schema changes are one of the most expensive "small" problems in enterprise data. They waste analyst time, create false confidence, and break systems long before someone opens a ticket.
A strong operating pattern includes a lightweight approval process for critical tables, clear notification channels, and automatic re-validation of downstream quality rules when structure changes. If a source team adds a new status field or changes a data type in a payment table, downstream owners should know immediately. Not after a failed month-end close, and not when a model suddenly underperforms.
4. Monitor Data Timeliness and Pipeline Arrival Patterns
Many organizations say they care about freshness. Fewer define what fresh means. That's why stale data keeps making its way into live dashboards and operational decisions.
Timeliness monitoring is more than checking whether a job ran. You need to know when data normally arrives, which delays are acceptable, and which ones put the business at risk. A retail team may tolerate a short lag in merchandising analysis but not in stock availability feeds. A bank may accept a delayed sandbox load but not end-of-day settlement data used in regulatory workflows.
Freshness is a business requirement
The useful approach is to monitor arrival patterns, not just schedules. Pipelines rarely behave with perfect regularity. Some arrive early, some late, some in bursts tied to upstream system behavior. digna Timeliness helps teams track expected delivery windows, detect delays, and distinguish routine variance from real incidents.
That distinction matters. Teams that alert on every minor deviation burn out responders. Teams that ignore pattern shifts miss the early signs of systemic bottlenecks.
Define expected arrivals per dataset: Daily batch finance data, hourly sales updates, and event streams shouldn't share the same freshness logic.
Map delays to business impact: A late executive dashboard is annoying. A late fraud feed is operationally dangerous.
Escalate by criticality: Some timeliness failures belong in chat. Others belong in incident response.
Use delay patterns diagnostically: Repeated lateness often points to upstream contention, dependency drift, or poor orchestration.
One of the most practical shifts in modern database management best practices is treating late data as a first-class failure mode. If users can query it, they'll assume it's current unless you tell them otherwise.
5. Implement Record-Level Data Validation Rules
Volume checks and trend monitoring are necessary, but they don't tell you whether each record makes sense. That's where many teams still have blind spots.
A table can have the right row count and still be wrong in ways that matter. A patient discharge date can precede an admission date. A policy can show active coverage outside its valid period. A transaction amount can fall outside permitted business logic without being statistically unusual. These aren't formatting issues. They're semantic failures.
Validate business meaning, not just shape
Record-level validation rules encode the logic that business users already assume is true. That's why this work should be owned jointly. Engineers understand implementation. Domain teams understand what a valid record means.
digna Data Validation supports this layer by enforcing user-defined, record-level rules inside the customer environment. That makes it well suited for audit-sensitive workflows where teams need repeatable validation tied to business logic, not just generic profiling.
A good validation rule is specific, explainable, and tied to action. “Coverage end date must not precede coverage start date” is useful. “Data should look normal” isn't.
Document the business reason: Every rule should answer why it exists, not just what it checks.
Start with high-impact conditions: Protect claims, payments, clinical records, and contractual data before low-risk dimensions.
Allow for legitimate exceptions: Hard rules without exception paths create false failures and user resentment.
Feed outcomes back into engineering: Validation failures often reveal upstream process issues, not just bad rows.
Field advice: If a business analyst can explain a rule in one sentence, you should usually be able to implement it as a reusable validation.
What doesn't work is keeping these checks hidden in spreadsheets, analyst notebooks, or tribal memory. If the rule matters, operationalize it.
6. Establish Unified Observability Across Data Platforms
Enterprise teams rarely manage one database and one pipeline. They manage warehouses, lakes, streaming jobs, transformation layers, semantic models, and operational stores. Each platform exposes part of the truth. None gives the whole picture on its own.
That fragmentation creates slow incident response. The data engineer checks orchestration logs. The analytics engineer checks dbt artifacts. The BI team checks dashboard freshness. The platform owner checks warehouse load history. Everyone is busy, and nobody has shared context.
This is the visibility model teams need:
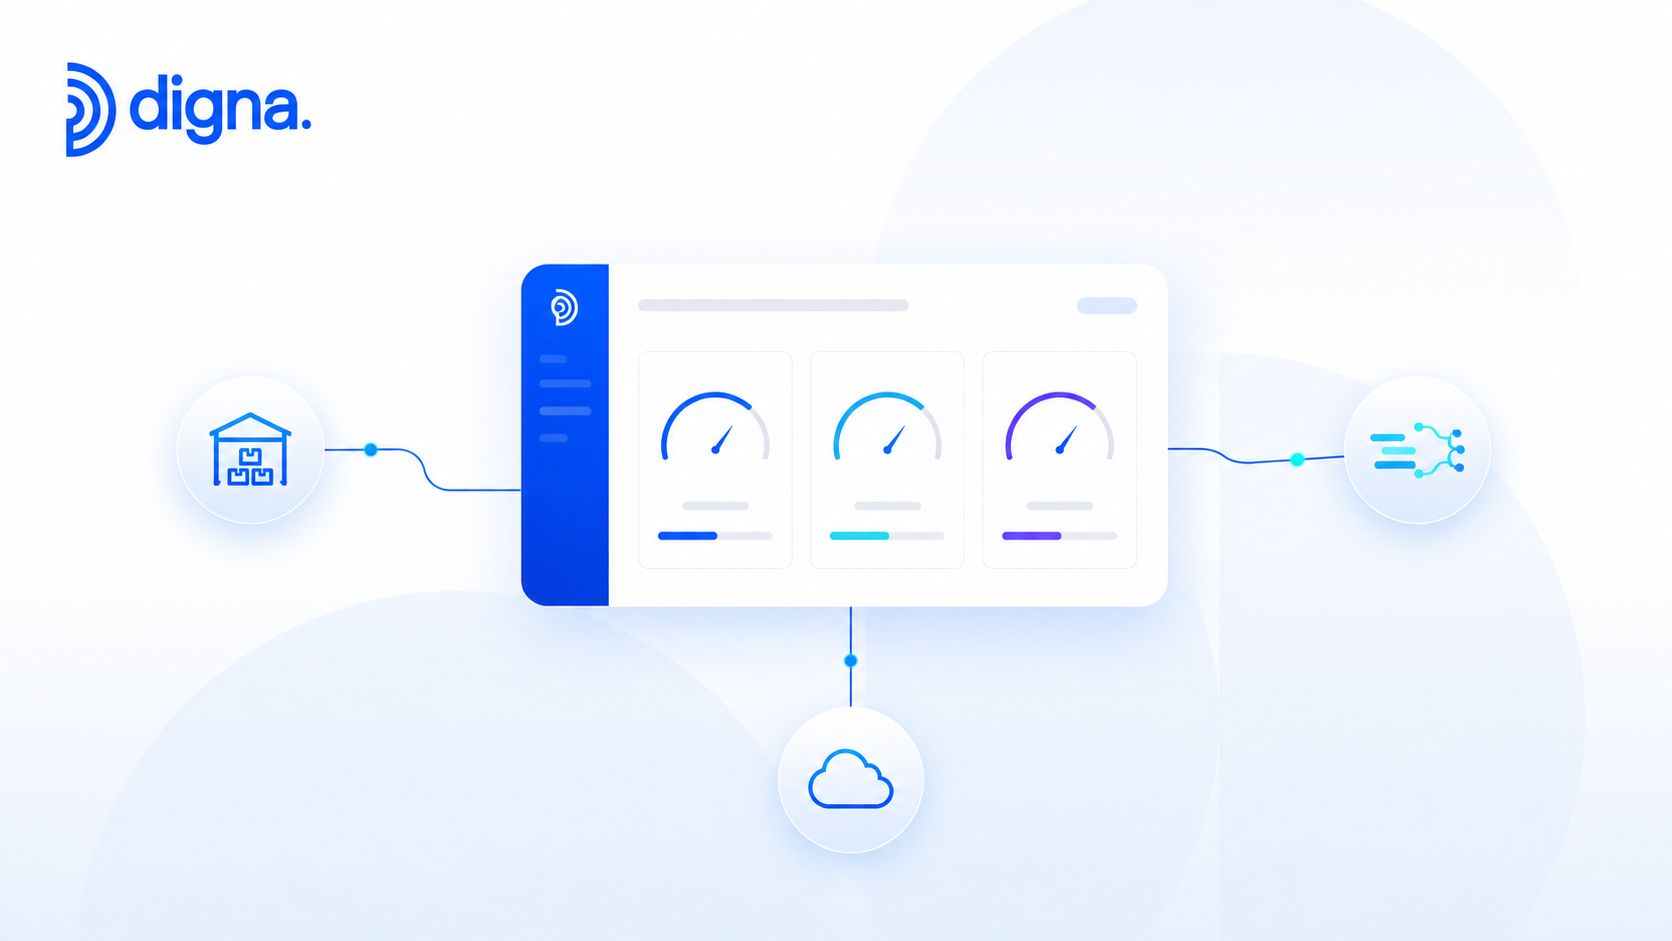
One operational view beats five partial ones
Unified observability pulls quality signals, schema changes, timeliness indicators, and trend analysis into one operating surface. digna is designed for that role. Its interface gives data engineers, analysts, and stakeholders a shared view of anomalies, delays, validations, and structural changes without forcing every user into low-level system logs.
The challenge isn't just technical integration. It's consistency. If each team names datasets differently, defines freshness differently, and uses different severity labels, the dashboard becomes another source of confusion.
A workable model usually includes role-based views:
Engineers need diagnostics: failed checks, changed schemas, resource-sensitive tables, upstream dependencies.
Analysts need impact visibility: which datasets are safe to use, delayed, or under investigation.
Leaders need operational status: where trust is strong, where risk is rising, and which domains need investment.
Unified observability won't solve broken ownership or poor process. But it does remove one common excuse. People can't fix what they can't see, and they can't coordinate around five disconnected monitoring tools.
7. Use AI-Powered Anomaly Detection Over Manual Thresholds
Static thresholds seem practical until your data starts behaving like a real business. Traffic rises on launch days. Payment patterns shift near holidays. Telecom usage changes during outages or local events. A hard-coded alert rule that worked last quarter starts firing constantly or misses subtle failures entirely.
That's why manual thresholds age badly. They assume normal stays fixed. It doesn't.
Here is where adaptive detection becomes useful:
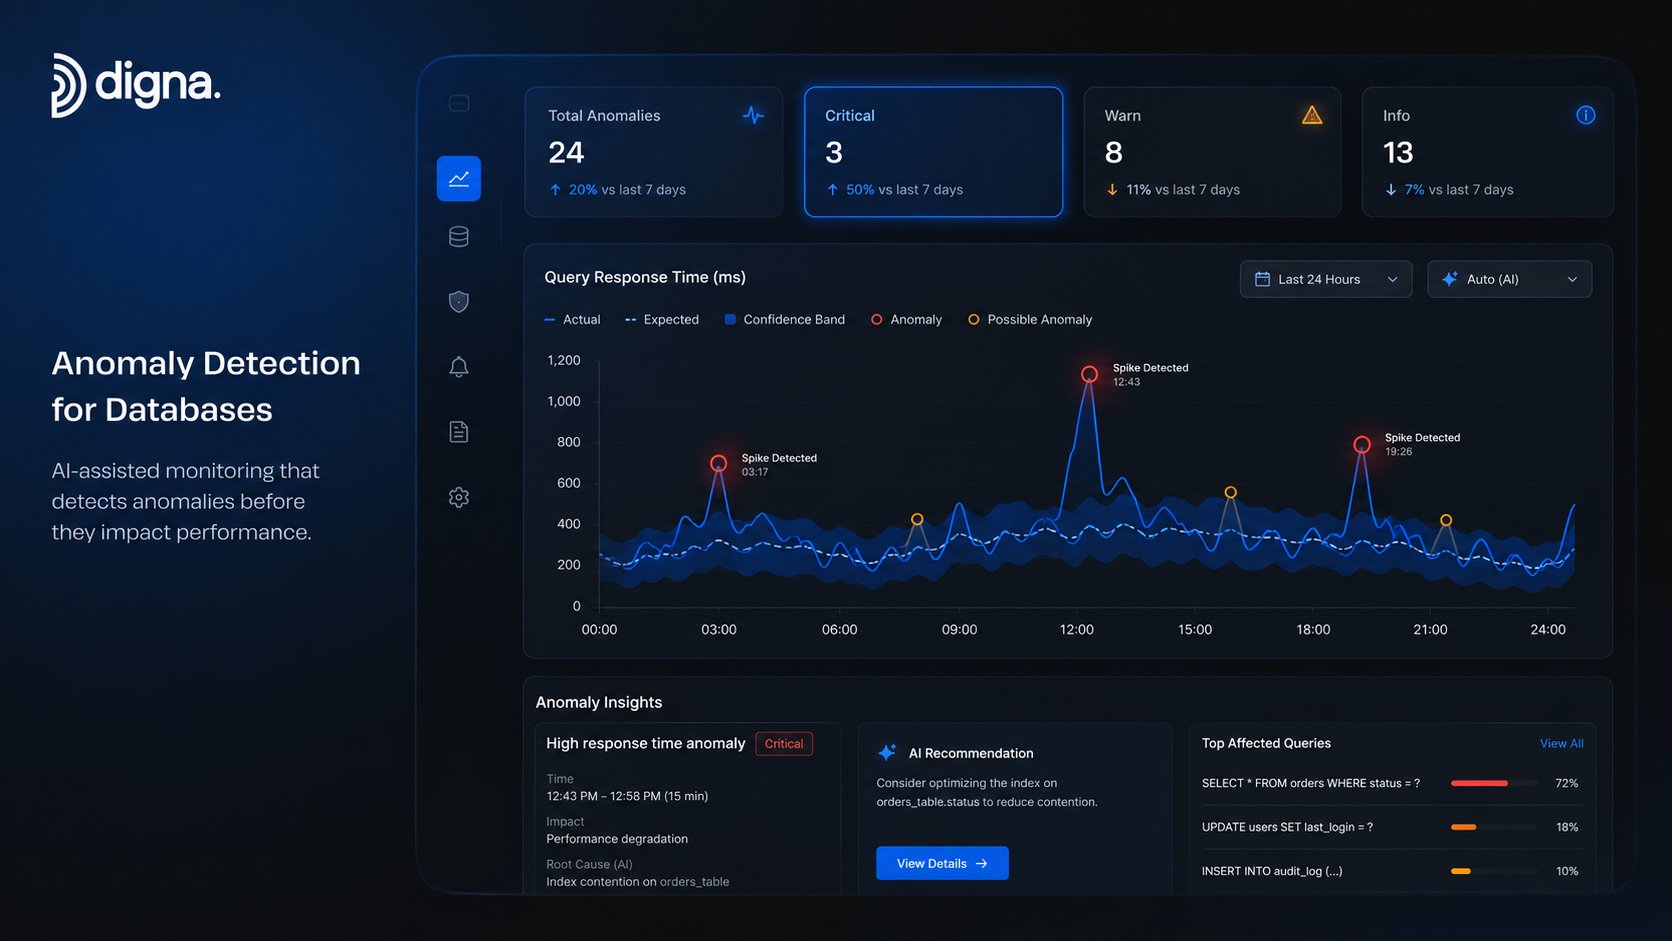
Static thresholds break in dynamic systems
AI-powered anomaly detection learns behavior from the data itself. It can account for repeating patterns, shifting baselines, and changing variance better than a pile of manually tuned limits. digna Data Anomalies is built around this approach, combining AI-powered detection with statistical methods so teams can identify unexpected shifts without maintaining a growing library of brittle rules. The practical implementation pattern is described in digna's article on detecting anomalies in time series.
That doesn't mean every threshold should disappear. Manual thresholds still make sense for hard business boundaries, like impossible values or contractual cutoffs. The right model is layered. Use static rules for known invalid states, and anomaly detection for patterns humans won't tune well by hand.
You don't replace operational judgment with models. You give operators better signals so they spend less time tuning alerts and more time solving real issues.
A retailer can use anomaly detection to catch suspicious purchasing shifts that may indicate fraud or a checkout bug. A hospital can detect unusual admission patterns worth investigation. A telecom operator can spot deviations in call metrics before customers report service issues. The common benefit is earlier signal detection with less alert fatigue.
8. Maintain Data Quality Baselines and Historical Analysis
Without history, every incident feels isolated. Teams see a failed check, investigate the immediate cause, and move on. That fixes today's problem but misses the pattern behind it.
Baselines give you a reference for normal behavior. Historical analysis tells you whether “normal” is stable, drifting, seasonal, or gradually degrading. That context changes how teams respond. A one-off spike gets triaged differently from a quality trend that has been getting worse for weeks.
History gives incidents context
digna Data Analytics supports this kind of review by surfacing trends, fast-changing signals, and historical observability patterns. That matters because many production issues don't begin as incidents. They begin as weak signals, recurring delays, rising null rates, or slowly widening variance that nobody notices in day-to-day operations.
Financial teams can study transaction behavior over time to identify suspicious shifts in quality or process. Retail teams can compare seasonal inventory patterns against current feeds to see whether anomalies reflect demand cycles or broken input data. Platform teams can look at long-running observability history to identify where bottlenecks keep returning.
A practical baseline strategy includes segmentation. Customer domains often behave differently. Geographies behave differently. Product lines behave differently. If you baseline everything together, you can hide meaningful changes inside a blended average.
Store observability history: Trend data is operational data. Treat it as something worth retaining and reviewing.
Segment where behavior differs: Separate baselines by domain, market, region, or workload where patterns diverge.
Review deterioration over time: Slow declines in quality often matter more than loud one-day incidents.
Use history for planning: Growth in volume, volatility, or delay patterns should influence architecture and staffing decisions.
Teams that do this well stop reacting to symptoms only. They start recognizing recurring failure modes and redesigning the system around them.
9. Establish Clear Data Ownership and Quality Accountability
Most unresolved data issues have a technical cause and an organizational cause. The technical cause gets logged first. The organizational cause shows up when nobody knows who must decide, approve, fix, or communicate.
Clear ownership changes response speed more than another dashboard ever will. If a pipeline delay affects executive reporting, someone should already own the dataset, the quality expectations, and the incident path. If schema drift breaks a feature store, the responsible engineering team should be obvious without a chain of forwarded messages.
Alerts need names, not inboxes
Ownership has to be visible where the work happens. Put it in metadata, dashboards, incident runbooks, and alert payloads. digna's unified interface supports this operational style well because quality, timeliness, anomalies, and schema changes can all be reviewed in one place by the people who need to act.
The trade-off here is central control versus domain ownership. A central data platform team can set standards, but it shouldn't pretend to understand every business rule. Domain owners know the meaning of the data. Platform owners know how to monitor and route issues. Good operating models use both.
Assign dataset owners explicitly: Critical tables and pipelines should always have named business and technical owners.
Publish ownership in monitoring views: Responders shouldn't hunt through documentation during an incident.
Define backup coverage: People go on leave. Ownership has to survive calendars.
Connect accountability to routines: Quality reviews, governance check-ins, and delivery processes should all reinforce ownership.
One pattern that fails repeatedly is collective ownership. If everyone owns a dataset, nobody feels the urgency when quality drops.
10. Integrate Data Quality into Data Pipeline Development
Teams create a lot of avoidable rework when they treat quality as a post-deployment exercise. The pipeline ships first. Validation comes later. Observability arrives after the first incident. Then engineers retrofit checks into a system that was never designed to expose them cleanly.
That approach raises costs in every phase. Testing becomes harder. Incident diagnosis takes longer. Business users lose trust faster than engineering can rebuild it.
Build quality into delivery, not after it
Quality-aware pipeline development starts during design. Data contracts, validation rules, timeliness expectations, and observability metrics should live alongside transformation logic and deployment definitions. Analytics engineers using dbt, orchestration teams working in Apache Airflow, and ML teams building feature pipelines all benefit from the same principle. Define what “good data” means before production teaches you the answer.
digna fits this model because it covers anomaly detection, schema tracking, timeliness monitoring, baseline learning, and record-level validation in one platform while executing analyses inside customer-controlled environments. That makes it practical to bake monitoring and quality expectations into enterprise pipelines without sending data somewhere else first.
Version quality rules with code: If a transformation changes, related expectations should change in the same review flow.
Set acceptance criteria early: A pipeline isn't ready if nobody has defined valid records, expected arrival behavior, and failure handling.
Automate testing before release: CI pipelines should catch broken assumptions before production consumers do.
Create reusable patterns: Shared validation libraries and standard observability templates reduce drift between teams.
The best database management best practices now include development discipline, not just runtime control. If quality isn't part of the build process, operations will inherit the cost later.
Database Best Practices: 10-Point Comparison
Item | Implementation Complexity 🔄 | Resource Requirements ⚡ | Expected Outcomes 📊 | Ideal Use Cases | Key Advantages ⭐ | Tips 💡 |
|---|---|---|---|---|---|---|
Implement Continuous Data Quality Monitoring | Medium–High, infra, rule definition, ongoing tuning | Moderate–High, monitoring platform, compute, engineering time | Faster detection of issues; reduced downstream impact; audit trails | Mission-critical datasets, real-time ML, compliance-sensitive systems | Early detection; reduces manual reviews; continuous observability | Start with critical tables; use tiered alerts and AI anomaly detection |
Execute Data Quality Logic Inside the Database | Medium, requires DB expertise and SQL development | Low–Moderate external but may increase DB compute and storage | Lower latency and reduced data movement; improved data residency | On‑prem/regulated data, PHI, GDPR/data‑sovereignty environments | Keeps data secure in‑place; leverages native DB performance | Use materialized views; schedule heavy jobs off‑peak; monitor DB load |
Establish Schema Change Tracking and Management | Medium, governance workflows and integrations needed | Moderate, metadata tooling, notification channels, developer coordination | Immediate detection of schema drift; faster impact analysis | Teams with many producers, dbt users, MLOps pipelines | Prevents pipeline breaks; supports lineage and auditability | Integrate alerts into incident channels; document business impact |
Monitor Data Timeliness and Pipeline Arrival Patterns | Low–Medium, baseline learning and schedule config | Moderate, scheduling, alerting, historical retention | Detects delayed arrivals; enforces SLAs; maintains report freshness | End‑of‑day reporting, operational dashboards, time‑sensitive analytics | Prevents stale data; provides early warnings for delays | Define expected arrivals from history; distinguish acceptable delays |
Implement Record-Level Data Validation Rules | Medium–High, define and maintain business rules | Moderate, compute for validation and rule authorship | Ensures semantic correctness; supports compliance and audits | Regulated sectors, transactional data, ingestion pipelines | Catches logical errors missed by stats; enables rejection at source | Start with high‑impact rules; document logic; allow flexible exceptions |
Establish Unified Observability Across Data Platforms | High, integrations and metric standardization required | High, dashboarding, connectors, engineering and integration effort | Holistic visibility; faster triage; correlated metrics across systems | Large enterprises with heterogeneous stacks and many pipelines | Reduces context switching; centralizes incident response | Build role‑based dashboards; standardize metric names; integrate IM tools |
Use AI-Powered Anomaly Detection Over Manual Thresholds | Medium, model training and validation required | Moderate, model compute, training data, ML expertise | Adaptive anomaly detection with fewer false positives; detects subtle shifts | High‑volume, high‑variability metrics, fraud detection use cases | Adapts to seasonality; reduces manual tuning; confidence scoring | Start on high‑volume metrics; combine methods; provide explainability |
Maintain Data Quality Baselines and Historical Analysis | Medium, baseline modeling and long‑term retention | Moderate, storage for history and analytics tooling | Contextual anomaly detection; trend discovery; proactive alerts | Longitudinal analysis, capacity planning, fraud trend detection | Reveals trends; informs resource planning and root‑cause work | Retain 3–6+ months of history; segment baselines by business unit |
Establish Clear Data Ownership and Quality Accountability | Low–Medium, organizational changes and documentation | Low, registry/metadata updates, communication overhead | Faster incident response; clear escalation; aligned SLAs | Organizations with unclear responsibilities or shared data products | Eliminates ambiguity; improves coordination and accountability | Document owners centrally; include ownership in dashboards and reviews |
Integrate Data Quality into Data Pipeline Development | Medium, process and CI/CD changes required | Moderate, testing frameworks, infra‑as‑code, collaboration time | Fewer production incidents; reduced technical debt; reproducible pipelines | New pipeline builds, transformation projects, CI-driven environments | Catches issues early; enables automated tests and reuse | Version quality rules with code; add CI tests; create reusable checks |
From Management to Mastery Your Data's Future
Database management has changed. The old model treated the database as infrastructure to maintain. The modern model treats it as a trust system to operate. That's the difference between keeping data available and keeping it usable.
The practices above work because they shift teams away from reactive cleanup. Continuous monitoring catches issues near the point of failure instead of after they've spread into dashboards, forecasts, and models. In-database execution keeps checks closer to the source and reduces unnecessary exposure. Schema tracking, timeliness monitoring, and record-level validation make hidden problems visible before business users discover them the hard way.
This is also where many enterprise programs either mature or stall. Teams often invest heavily in storage, orchestration, and transformation, then underinvest in observability. They assume trust will emerge from good engineering hygiene alone. It won't. Trust is built through explicit monitoring, clear ownership, visible baselines, and fast feedback loops between data producers and data consumers.
That's why observability now belongs inside any serious discussion of database management best practices. It isn't an accessory category for large companies with extra budget. It's how you run a data platform responsibly when reporting, automation, compliance, and machine learning all depend on the same underlying assets.
Tools matter here, but architecture matters more. digna is a strong fit for this modern operating model because it combines anomaly detection, historical analytics, timeliness monitoring, record-level validation, and schema tracking in one environment. Its in-database approach is especially relevant for organizations that need strong control over where data stays and how quality analysis runs. For teams working in regulated sectors or customer-controlled infrastructure, that's a practical advantage, not a marketing detail.
The adoption path doesn't need to be dramatic. Start with one table that people care about and don't fully trust. Add continuous monitoring. Define timeliness expectations. Track schema changes. Introduce record-level validation where business logic matters. Make ownership explicit. Then extend that pattern to the next critical asset. This is how mature data programs grow in real companies. One trusted domain at a time.
If you're evaluating the broader ecosystem around AI-enabled data operations, Captapi on AI data platforms is a useful companion read.
The teams that do this well stop spending their mornings debating whether a number is safe to use. They spend that time making decisions with confidence. That's the true aim. Not perfect databases, but dependable data systems that people trust under pressure.
digna helps teams turn database management into continuous, in-database observability. If you need anomaly detection, record-level validation, timeliness monitoring, schema tracking, and historical trend analysis in a customer-controlled environment, explore digna.
To put practice 3 into operation and treat schema drift as a visible event, see how digna Schema Tracker detects added, removed and retyped columns.
Frequently asked questions
What are the most important database management best practices for 2026?
The article lists ten: continuous data quality monitoring, in-database quality logic, schema change tracking, timeliness monitoring, record-level validation, unified observability, AI-powered anomaly detection, historical baselines, clear data ownership, and quality built into pipeline development. Backups, access control and query tuning still matter but no longer cover the key failure modes.
Which database tables should be monitored first?
Start with tables that feed executive reporting, customer-facing systems, regulated workflows or machine learning features. The article's test is simple: if a table can change a decision, trigger an action or create audit exposure, it belongs in the first monitoring wave. Monitoring everything equally creates noise and weakens response discipline.
Why run data quality checks inside the database?
In-database execution keeps validation, anomaly checks and metric computation close to the data, avoiding exports across network and security boundaries. The article recommends native features such as materialized views and scheduled queries, running heavier checks outside peak production windows, watching resource impact, and documenting every calculation for auditors and future teammates.
How should schema changes be handled in production databases?
Treat schema drift as an operational event, monitored like a failing job. Added or removed columns and type, constraint or partition changes on critical assets should be visible, attributable and reviewable, backed by a lightweight approval process, clear notification channels and automatic re-validation of downstream quality rules whenever structure changes.
Should AI anomaly detection replace static thresholds?
Not entirely. The article recommends a layered model: static rules for known invalid states such as impossible values or contractual cutoffs, and AI-powered anomaly detection for patterns humans cannot tune well, like launch-day traffic or holiday payment shifts. Its comparison table suggests retaining three to six months or more of history.


