Data Quality Issue Management Process How to Fix Issues Fast
|
10
min read

The dashboard says revenue is down. The CFO is asking whether demand dropped, pricing changed, or finance loaded the wrong table again. In Slack, an analyst has already posted a screenshot with three different numbers for the same KPI. Someone patches a SQL model, reruns a pipeline, and declares it fixed.
Then the same issue comes back two days later from a different upstream source.
That's the pattern many data teams live with. Not a single broken field, but a recurring loop of stale loads, silent schema drift, duplicate alerts, and unclear ownership. Ad hoc fixes feel fast in the moment, but they usually stop at symptom relief. They don't define who owns the defect, what response time is acceptable, or how the team prevents the same class of issue from reopening.
Table of Contents
The Data Quality Issue Management Workflow From Detection to Prevention
Embedding the Process Into Tooling Roles and Daily Operations
Why Data Quality Issues Need a Managed Process
A bad load lands at 6:10 a.m. By 8:00, finance is questioning revenue, an analyst has muted three noisy alerts, and an engineer is rerunning a job without knowing whether the defect started in source ingestion, a transformation change, or a broken reference table. Teams often call that triage. In practice, it is queue work without an operating model.
That distinction matters. A managed data quality issue management process is not just a way to catch bad records faster. It sets ownership, severity, SLAs, escalation paths, and prevention work so the same defect class does not keep returning under a new ticket number.
Research on enterprise impact shows why ad hoc handling fails at scale. Poor data quality has been cited at an average annual cost of $12.9 million per organization, and MIT Sloan research has reported 15% to 25% annual revenue reduction from poor data quality in some contexts, as summarized in these data quality improvement statistics. The same summary notes a widely cited Harvard Business Review finding that only 3% of company data met basic quality standards, and MIT Sloan and Thomas Redman reported 47% of newly created records contained at least one critical error.
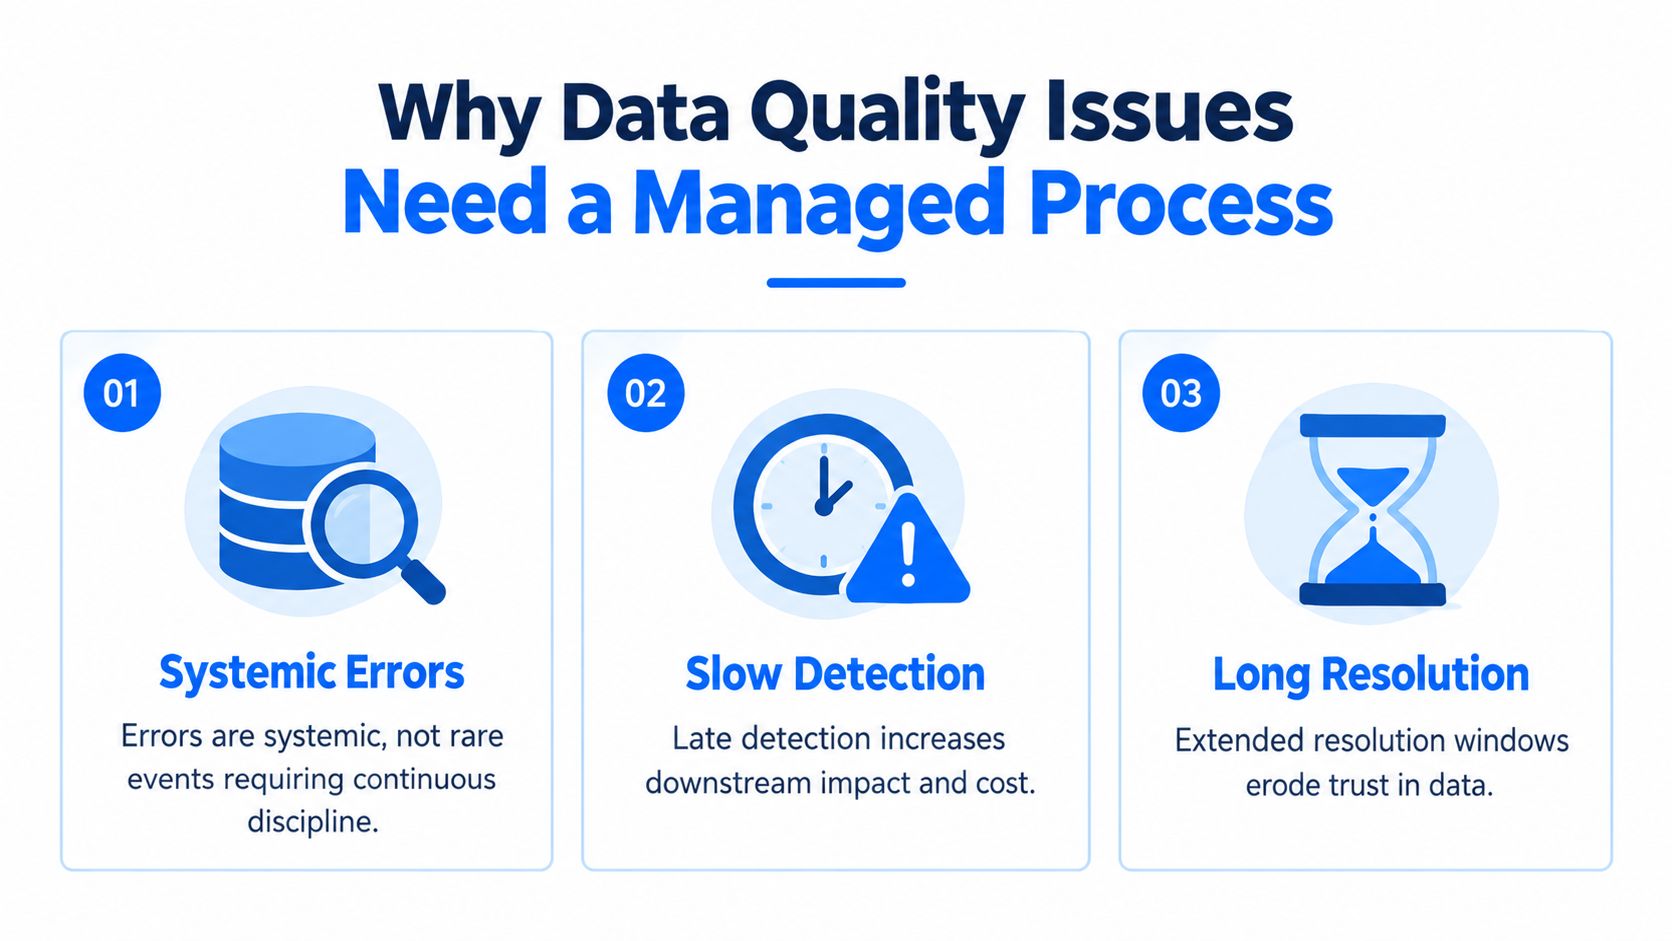
Ad hoc fixes fail at the ownership boundary
The first fix is often the easy part. The hard part is deciding who owns the root cause, who owns downstream communication, what response time the business should expect, and what change prevents recurrence.
Without those rules, teams optimize for closure instead of resolution. One person patches a model. Another suppresses the alert. Nobody updates the threshold, adds a contract test, or assigns a permanent owner for the source system. The issue disappears from the queue and stays in the system.
Practical rule: If a defect can recur, assign an owner, define a response target, and decide what control would have caught it earlier.
This is why issue management should be treated as an operating model. Detection is one part of it. The rest is process discipline: one issue record per underlying defect, clear severity criteria, SLA timers, handoffs that do not stall in Slack, and a prevention loop that produces changes in code, tests, metadata, or source-system behavior.
I have seen teams spend more time debating whether a problem is "really data quality" than deciding who has to fix it. That usually means the process is missing a common unit of work and a service expectation. The result is familiar. Alert fatigue rises, ownership gets blurry, and business users start maintaining side spreadsheets because they trust their manual checks more than the platform.
Managed process means measurable process
A team cannot improve what it does not count consistently. If every failed check becomes a separate incident, the queue looks worse than it is. If teams only log executive-visible problems, the queue looks healthier than reality. Both distort prioritization.
The useful view is operational. Measure issue rate against a defined unit, then track SLA performance by severity, source domain, and repeat-issue class. That shows whether the problem is detection coverage, triage discipline, weak ownership, or repeated upstream defects. It also gives data leaders a better case for investment than saying data quality "feels bad."
That business case often starts with a broader explanation of why data quality is important to an organization, but the day-to-day win is simpler. Fewer duplicate tickets. Shorter time to acknowledge. Faster routing to the owner. More fixes that remove the failure mode instead of cleaning up its symptoms.
What works is rarely glamorous. Clear thresholds. Named owners. SLA-backed response targets. Escalation rules that trigger before executives notice. Post-incident actions that change the system.
What Counts as a Data Quality Issue and How to Measure It
Teams start too late. They jump into triage before agreeing on what an issue is.
That's a mistake because your metrics will collapse the minute different teams count different things. One squad treats every failed check as an issue. Another logs only business-facing incidents. A third opens five tickets for one upstream defect because five downstream models failed. You can't manage that queue well because you're not measuring the same unit of failure.
Define an issue before you define the workflow
A practical methodology is to count a data quality issue as one of three things: a failed quality check above threshold, a freshness or SLA breach, or a confirmed incident. It should exclude false positives and non-data-quality job failures, based on this issue rate methodology.
That threshold piece matters. A national guideline for data quality management says each metric should have an acceptance threshold expressed as either a percentage or a number of records, and it frames issue management as a continuous process of identifying, tracking, and resolving issues across the entity in the guideline document. In practice, that means “null emails exist” is descriptive, but “null emails exceeded the accepted threshold” is operational.
Choose the denominator that matches your maturity
The denominator is where teams either create a useful KPI or a vanity metric. If you monitor a large number of checks, failed checks over executed checks can work. If you only watch a set of critical assets, issue count over monitored datasets is often cleaner. If your environment is heavily batch-oriented and high volume, issue density per records processed can make more sense.
Measurement Basis | When to Use It | Example KPI |
|---|---|---|
Check-based | You run many automated checks across pipelines and tables | Failed-check rate |
Dataset-based | You monitor a curated list of critical datasets | Issues per monitored critical dataset |
Volume-based | You process large record volumes and want density tracking | Issues per 1 million records processed |
The point isn't to find the universal best denominator. It's to pick one that reflects how your platform operates and keep it stable long enough to compare trends.
Clean the inputs before you trust the outputs
Before you compute issue KPIs, pull together the operational data that proves what happened. That usually includes:
Check results: Validation failures, anomaly outputs, freshness breaches.
Pipeline logs: Execution status, retries, upstream dependency failures.
Ticket data: Opened, acknowledged, mitigated, resolved, reopened.
Lineage metadata: What broke upstream and which consumers inherited it.
Then do the unglamorous work:
De-duplicate related alerts so five downstream failures tied to one source defect become one issue.
Standardize root-cause categories so “schema drift,” “late source extract,” and “bad reference mapping” mean the same thing every time.
Separate issue creation from issue confirmation if your alerting layer is noisy.
Track SLA outcomes only after the issue taxonomy is stable.
A metric you can't compare month to month isn't a management metric. It's a snapshot.
For teams refining dimensions and thresholds, it helps to align issue definitions with the core dimensions of data quality, then attach clear acceptance criteria to each one. That gives engineering, analytics, and business owners the same language before the incident queue starts moving.
The Data Quality Issue Management Workflow From Detection to Prevention
At 8:15 a.m., finance opens a dashboard before month-end close and yesterday's numbers are missing. The ingestion job technically succeeded. The warehouse is up. The BI layer is serving stale data because one upstream extract arrived three hours late and no one owned the freshness check. That is what a weak issue workflow looks like in production. The failure is not just detection. It is the lack of an operating model that connects monitoring, ownership, response targets, and prevention.
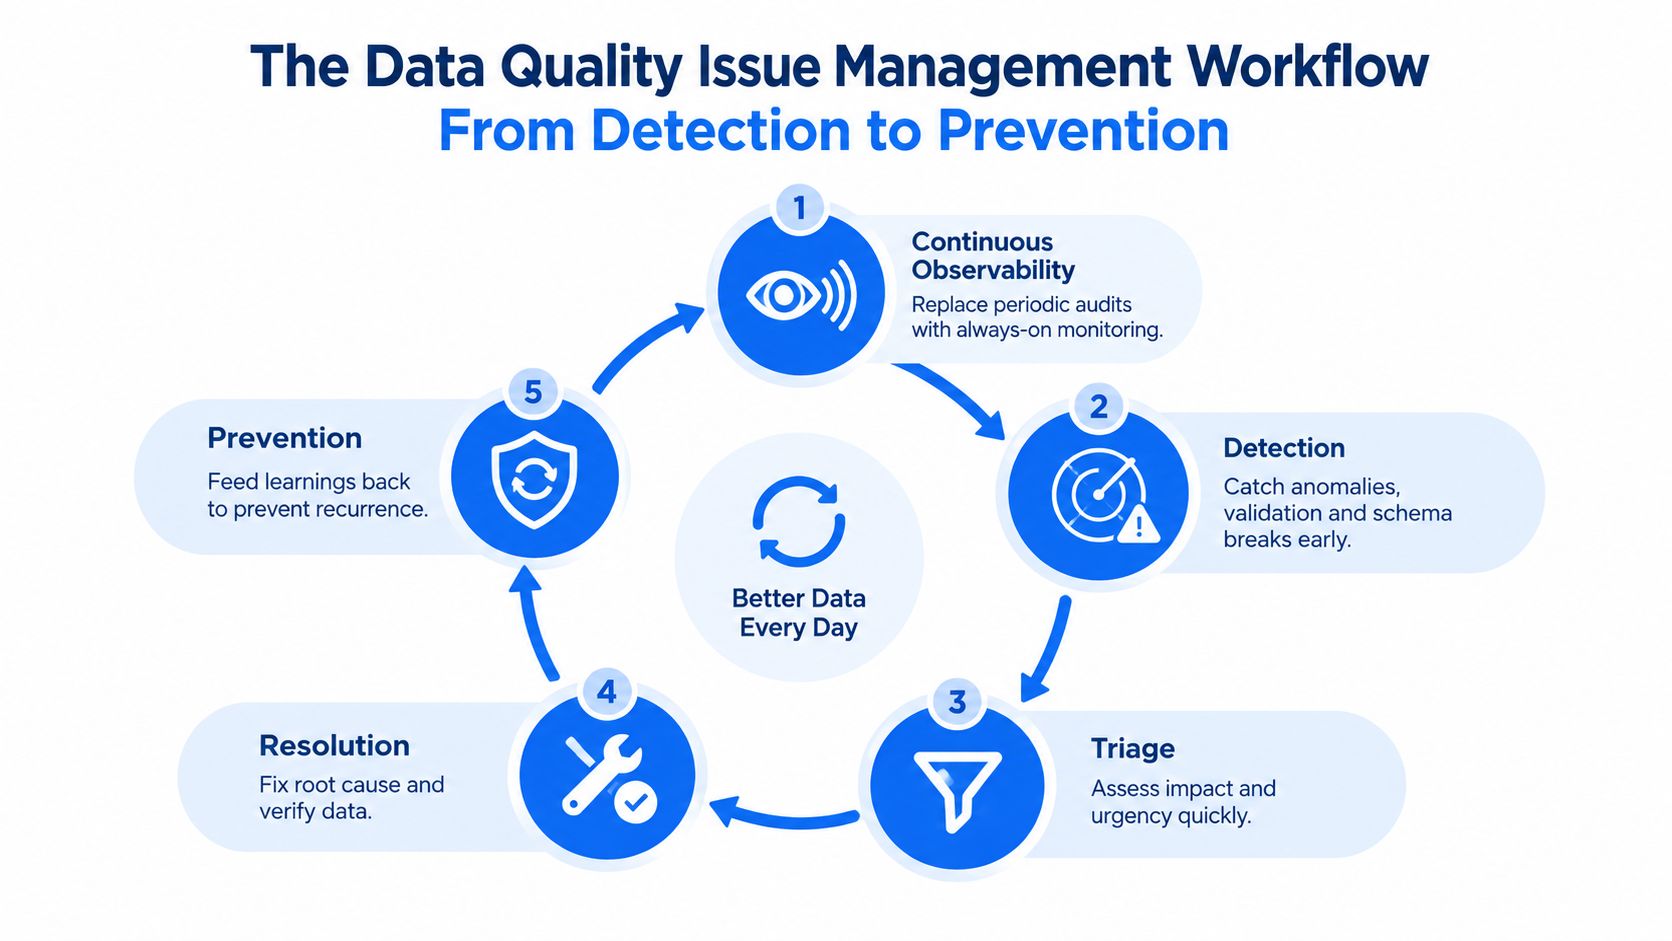
Start with observability that creates actionable issues
Issue management starts before a ticket exists. Teams need signals that tell them what failed, when it failed, what changed, and who is exposed.
Periodic reviews cannot do that job. Production defects appear between review cycles, and by the time someone notices, downstream tables, dashboards, or models have already consumed the bad data. Good monitoring and reporting for data quality operations shortens the gap between defect introduction and human response.
The useful signals usually fall into four groups:
Freshness and timeliness: Missing loads, late deliveries, partial batch arrival
Validation failures: Required fields, accepted values, uniqueness, reconciliation rules
Structural changes: Added columns, dropped columns, type changes, contract violations
Behavior shifts: Volume spikes, null-rate changes, distribution drift, unexpected metric movement
The trade-off is simple. More checks catch more defects, but they also create more noise. Teams that monitor everything at the same sensitivity usually train responders to ignore alerts. The goal is to create issues that deserve handling, not a queue full of false positives.
Separate detection from validation
A failed check is an event. An issue is a validated event with scope, impact, and an owner.
That distinction matters because alert streams are noisy. A schema change in a sandbox table should not compete with a broken revenue feed. If the process creates a ticket for every anomaly without validation, the team spends its day closing noise and misses the incident that affects reporting deadlines or customer-facing products.
GitLab documents a practical sequence in its data quality program handbook: Detection → Triage & Validation → Investigation → Resolution → Prevention → Closed. The value of that flow is the decision gate. Before an issue enters the main queue, someone confirms that it is real, checks whether consumers are affected, and decides whether it belongs in the incident path or the standard backlog.
That step also improves measurement. Detection volume tells you how noisy the system is. Confirmed issue volume tells you what operators need to handle. Tracking both is how teams spot weak thresholds and inflated issue rates.
Investigation should trace the defect to the control point
Resolution slows down when teams chase the visible symptom instead of the source. I see this often with downstream breakages. A dashboard fails, so people start patching BI logic, even though the actual fault sits in an upstream extract, a source-system code change, or a scheduler dependency.
A few patterns show up repeatedly:
Late data: The stale dashboard is the symptom. The root cause is usually an upstream delay, retry storm, or dependency failure.
Schema drift: The warehouse model breaks after a source changes a type or drops a field.
Business-rule failure: A mapping table or reference feed accepts a new value that no downstream rule expects.
The Australian Bureau of Statistics lays out a staged process in its quality incident management and reporting manual: monitor quality, identify the issue, assess it, initiate the appropriate reporting path, then evaluate and implement corrective action. That sequence holds up in practice because assessment is explicit. Teams that skip it tend to either over-escalate harmless anomalies or understate defects that spread across multiple consumers.
Resolution is not complete until trust is restored
Closing the technical fault is only part of the job. The question is whether consumers can trust the data again.
A workable resolution flow usually includes four actions:
Containment. Pause a consumer, suppress a broken dashboard, rollback a transform, or isolate bad records.
Correction. Fix the failure at the source layer that introduced the defect.
Verification. Re-run checks, reconcile key outputs, and confirm downstream data has recovered.
Communication. Tell affected users what was wrong, what was corrected, and from what timestamp the data is safe to use.
GitLab's incident management handbook is useful here because it treats data incidents as operational events that require structured assignment, documentation, and communication. That is a better pattern than relying on a long Slack thread that nobody can audit later.
Prevention closes the loop and proves the process is working
Prevention belongs inside the workflow, not after it. If the same defect class keeps reappearing, the team does not have a detection problem. It has a control design problem.
The fix might be a tighter validation rule at ingestion, a data contract for a volatile source, a freshness SLO with an explicit owner, or a runbook update that removes ambiguity during handoff. The right choice depends on where the issue entered the system and how expensive it is to catch earlier.
This is also where issue management becomes an operating model. Measure repeat issue rate by root-cause category. Measure how many issues hit SLA for acknowledgment, mitigation, and resolution. Measure reopen rate after closure. Those numbers tell you where to invest. A queue with fast closes but high recurrence usually needs stronger preventive controls. A queue with low recurrence but poor SLA performance usually has ownership or routing problems.
How to Triage Prioritize and Assign Ownership Under SLAs
At 9:07 a.m., finance reports that yesterday's revenue dashboard dropped by 18 percent. The dashboard owner sees the symptom, but the defect sits three hops upstream in a late-arriving source extract, and the rule for excluding test transactions is still undocumented. Without a triage model, three teams start investigating, nobody owns the clock, and the business gets updates without a recovery time.
That is the job of this stage. Set severity fast, assign a directly responsible owner, and put response and resolution targets on the issue so it does not drift in a shared queue.
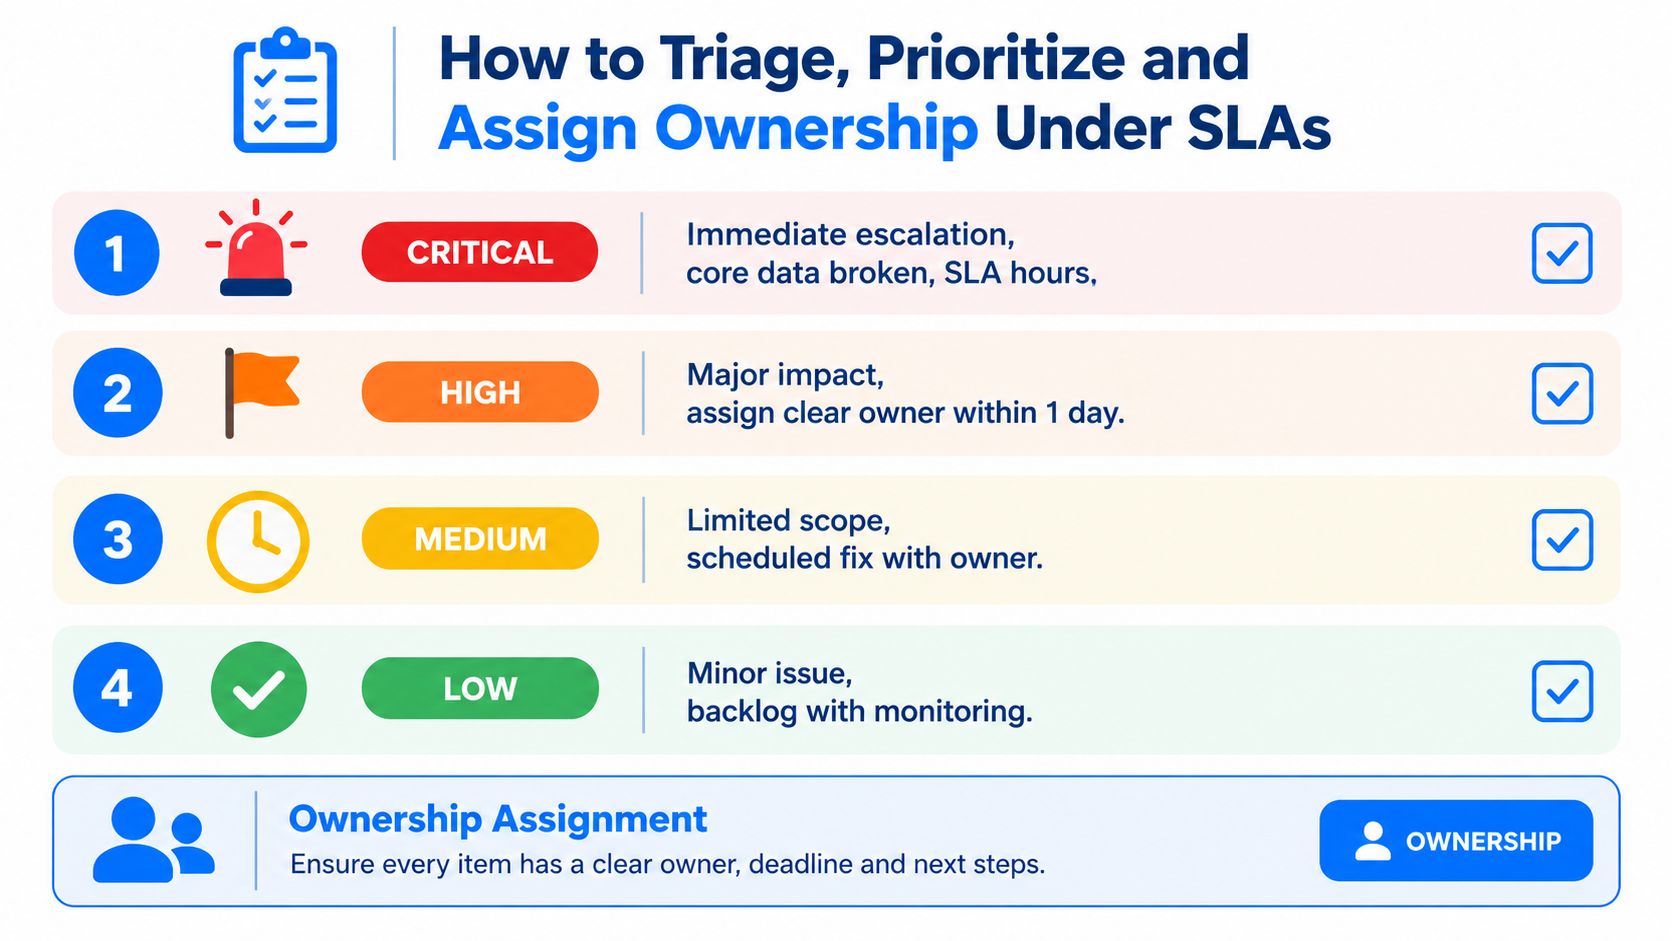
Use severity to make trade-offs explicit
Severity should answer one question: how much business risk are we willing to carry before this gets fixed?
A practical model uses separate targets for acknowledgment, mitigation, and final resolution. Teams often run with response windows measured in hours for higher-severity incidents, mitigation in days, and full resolution on a longer clock when the durable fix requires code changes, source-team coordination, or backfills. The exact targets matter less than consistency. If "high priority" means same day to one team and next sprint to another, the SLA is noise.
Set severity from three factors:
Business impact: Which decisions, reports, models, or customer workflows are affected?
Blast radius: How far has the issue propagated through downstream tables and dashboards?
Control risk: Does it touch regulated outputs, executive reporting, billing, or externally visible metrics?
Keep the model small. Four levels are usually enough. More than that creates debate without improving routing.
Assign ownership to the fix domain
The first team to notice the issue is rarely the right owner. The right owner is the team that can change the failing control, code path, or source behavior.
Use a routing model like this:
Severity level | Typical condition | Primary owner | Escalation path |
|---|---|---|---|
Critical | Core data product broken or immediate business impact | Data platform or domain engineering DRI | Incident channel and leadership notification |
High | Major downstream impact but limited blast radius | Dataset owner with engineering support | Formal incident review if mitigation stalls |
Medium | Contained issue with workaround available | Analytics engineering or steward | Scheduled remediation with tracking |
Low | Cosmetic, low-impact, or isolated defect | Backlog owner | Monitor trend and revisit if repeated |
This clears up a common ownership gap. Platform teams own pipelines and controls. Application teams own source-system behavior. Business owners own rule intent and acceptance criteria. All three can be involved, but one DRI must own the SLA clock, status updates, and next action.
If rule intent has no owner, engineers will invent one under pressure.
Prioritize with capacity in mind
Incident queues fail when every red alert gets treated as equally urgent. Capacity is limited. Some defects deserve immediate interruption. Others are cheaper to contain, document, and fix in planned work.
Research on data quality practice has pointed to fragmented accountability and inconsistent management as recurring causes of poor outcomes in this study on systemic issues. Healthcare research has also identified unclear action plans, limited resources, and weak training as barriers in the published survey discussion. Those findings match what shows up in production queues. Teams are usually not missing alerts. They are missing a consistent way to decide what interrupts current work.
Use four triage questions:
What breaks if this waits until tomorrow or next week?
Who consumes the affected data next, and what decision will they make with it?
Can we contain the issue with a rollback, quarantine, annotation, or temporary filter?
Is recurrence high enough that prevention work should outrank another one-off fix?
That last question matters. A medium-severity issue that repeats every week usually deserves more attention than a single high-visibility defect that is unlikely to happen again.
Run the queue against measurable SLAs
A single intake path helps, but queue hygiene is only part of the operating model. Track whether the team is meeting acknowledgment, mitigation, and resolution targets by severity. Track reopen rate. Track issue rate by dataset, domain, and root-cause category. Those metrics show whether the problem is bad routing, weak controls, or chronic underinvestment in a source area.
Use those numbers to adjust priorities. A queue with decent resolution times but poor acknowledgment usually has alerting or on-call coverage problems. A queue that meets response SLAs but misses final resolution targets often has cross-team ownership friction. Teams that want a clearer way to set and review these service targets should define them alongside reliability measurement practices so issue rate and SLA performance can be reviewed together, not in separate dashboards.
One queue. One severity decision. One DRI on the clock. That is what turns data quality issue management from reactive triage into an operating model.
Embedding the Process Into Tooling Roles and Daily Operations
A documented workflow won't survive contact with production unless it's embedded in the tools people already use.
That means your quality process needs to live where the warehouse jobs run, where analysts validate outputs, and where governance can see trend and incident history. If you bolt on a separate quality silo with its own dashboards, taxonomies, and user list, ownership usually fragments within a quarter.
Build around one operational view
The practical pattern is straightforward. Run anomaly detection, validation, timeliness monitoring, and schema tracking against the same critical datasets. Feed those signals into a shared dashboard. Connect the dashboard to scheduling context, metadata, lineage, and ticketing so responders can move from alert to action without stitching evidence together by hand.

The key design choice is execution model. In-database checks reduce data movement and make security review easier, especially in regulated environments. They also keep the monitoring logic closer to the tables and transformations that need to be verified.
Roles need shared context, not separate tools
Different roles care about different failure signals:
Data engineers want pipeline state, freshness, retries, and schema breaks.
Analytics engineers and BI developers care about business-rule failures, model drift symptoms, and broken semantic outputs.
Governance and data quality leads need thresholds, trends, acceptance status, and audit-ready evidence.
If each of those groups works from a different system, triage slows down because every issue starts with reconciliation. A better pattern is shared visibility with role-specific views. The platform can expose the same incident through technical logs for engineering and business impact summaries for non-technical owners.
Modular adoption beats big-bang rollouts
Most organizations don't need to deploy every monitoring capability on day one. They usually need to start with the failure mode causing the most pain, then add coverage around it.
That's where tooling decisions matter. Some teams begin with freshness and schema monitoring because those defects are easiest to detect and route. Others start with deterministic validation because compliance or finance needs explicit control evidence. In mixed environments, a modular option can help. For example, data quality implementation patterns often work best when the stack can expand from one monitored domain to several without forcing a new operating model.
One option in this category is digna, which runs inside the customer's environment and combines anomaly detection, validation, timeliness monitoring, schema tracking, scheduler support, catalog capabilities, integrations, and a shared dashboard. That setup is useful when teams want in-database execution and don't want production data moved outside their own infrastructure.
What sticks operationally is rarely the fanciest detector. It's the setup that keeps the process visible, keeps ownership attached, and fits the environment teams already have.
Preventing Repeat Issues and Proving the Process Works
A queue that closes tickets but keeps reopening the same failure patterns isn't mature. It's busy.
The proof that your process works is simple. Detection gets faster. Resolution gets cleaner. Repeat defects fall. Stakeholders stop arguing over whether they can trust a report because the incident history, remediation record, and acceptance thresholds are visible.
Prevention needs post-incident changes
Every meaningful incident should leave behind one durable improvement. Maybe that's a new threshold, a missing validation rule, a schema contract, or a tighter ownership handoff. If closure only records what broke, the system hasn't learned anything.
The most useful post-incident reviews focus on identifying root causes with enough precision to change controls, not just describe symptoms. If your team needs a practical reference for that discipline, this collection on identifying root causes is worth keeping in the runbook.
The right question after resolution isn't “who fixed it?” It's “what changed so we won't meet this issue again next week?”
Track the metrics that change behavior
The metrics worth keeping in front of teams are the ones that affect response quality:
Detection time: How long the defect existed before the team knew.
Resolution time: How long the business stayed exposed.
SLA attainment: Whether response, mitigation, and closure met target.
Repeat issue rate: Whether the same root-cause category keeps returning.
Business exposure: Which critical reports, processes, or decisions were affected.
You don't need a huge scorecard. You need a stable one. If teams can see that one domain repeatedly misses freshness targets or one class of schema changes reopens often, prevention work becomes easier to justify.
A short maturity check
Use this as a blunt self-test:
Issue definition exists: Teams agree what counts as an issue and what doesn't.
Thresholds are documented: Metrics become actionable only when they breach accepted limits.
Severity is standardized: Priority doesn't depend on who is on call.
Ownership is explicit: Every issue has a DRI and escalation path.
Closure includes prevention: Fixes update rules, baselines, contracts, or runbooks.
Evidence is retained: You can show what happened, who responded, what changed, and whether SLAs were met.
If even two of those are weak, the process is still fragile. That's normal. Teams don't need a new philosophy. They need fewer ambiguous handoffs and better operational discipline around the defects they already know they have.
If your team is trying to turn scattered checks into a real operating model, digna is built for that kind of work. It helps teams monitor anomalies, timeliness, validation, and schema changes inside their own environment so issue detection, ownership, and prevention can run as one process instead of four disconnected tools.
A process is only as measurable as the numbers behind it — pair this workflow with a working set of data quality metrics so closure means something.
Frequently asked questions
Why do ad hoc fixes fail?
They fail at the ownership boundary. Someone patches a SQL model, reruns a pipeline and declares it fixed, but nobody owns whether trust was restored or whether the same defect recurs. A managed process is one that can be measured; an ad hoc one cannot.
What counts as a data quality issue?
Define the issue before the workflow. Not every failed check is an issue, and not every issue starts as a failed check — an unexplained KPI movement qualifies too. Choose a denominator that matches your maturity, and clean the inputs before trusting any rate you calculate from them.
What does the workflow look like end to end?
Detection, validation, investigation, resolution and prevention. Detection and validation stay separate on purpose, because an alert is not yet an incident. Investigation traces the defect to its control point, and resolution is incomplete until trust is restored, not merely until the data changes.
How should issues be triaged and assigned?
Use severity to make trade-offs explicit rather than treating every issue as urgent. Assign ownership to the fix domain — the team that can actually change the control — not to whoever noticed. Then prioritise with capacity in mind and run the queue against measurable SLAs.
How do you stop the same issues recurring?
Prevention requires post-incident changes to controls, not just a closed ticket. Track metrics that change behaviour, such as recurrence rate and time to restored trust, rather than raw issue counts, which fall whenever people stop reporting.