Data Cleaning Done Right: A Hands-On Guide for 2026
|
6
min read

You know the feeling. A dashboard looked fine yesterday, somebody refreshed it before a meeting, and now revenue, orders, or active users have drifted just enough to trigger panic. The bad part isn't the broken chart, it's the scramble to find which upstream table lied, which column changed shape, and which manual fix somebody forgot to document.
That's why data cleaning can't stay trapped in the “quick script before analysis” mindset. In practice, it's an engineering discipline about reliable pipelines, repeatable rules, and observability that catches problems before they hit the board pack. Even official statistics treat freshness as a design constraint, not an afterthought, with Eurostat updating its data navigation tree twice a day, at 11:00 and 23:00 CET to keep analysis usable across Europe, and delivering databases as multi-dimensional datasets in multiple formats so they can be inspected, compared, and reused properly (Eurostat database and data navigation tree).
For customer-facing analytics, that same discipline shows up in the plumbing behind a customer data platform, where identity, events, and reporting only stay trustworthy if the data is standardised and continuously checked. If the pipeline is brittle, every dashboard becomes a fire drill.
Beyond the Broom - Why Data Cleaning is an Engineering Problem
A finance team once shipped a board deck on a Monday morning and found three charts disagreeing with each other. The problem was not the dashboard tool. A quiet upstream change had altered the structure of one field, and a manual workaround had never been versioned. That is how this usually shows up, because bad data rarely arrives like an alarm. It creeps in as a small inconsistency, then spreads through joins, refreshes, and exports until the numbers stop lining up.
The wrong mental model
Too many teams still treat cleaning as a one-off chore, something they do after extraction and before “real work” starts. That approach breaks as soon as data refreshes daily, schemas drift, or multiple systems feed the same metric. In operational pipelines, the critical question is whether the process will keep producing trustworthy outputs tomorrow.
A better model is to treat cleaning as part of system design. Define the rules, enforce them automatically, and keep enough observability to see when the rules stop matching reality. Document the difference between a fix, a transformation, and a deliberate exception so nobody mistakes a workaround for a standard. That is also where a customer data platform earns its keep, because identity, events, and reporting only stay reliable when the data is standardised and checked continuously.
Practical rule: if a cleaning step cannot be reproduced, it is not really part of the pipeline. It is just a memory in someone's notebook.
This matters in setups that depend on reuse across systems and jurisdictions. Timeliness, consistent structure, and traceability all matter at once, and that is why official and enterprise data work keeps drifting toward the same discipline: versioned rules, automated validation, and monitoring that shows when inputs change shape.
What changes in 2026
The centre of gravity has moved from “fix the file” to “protect the pipeline”. Teams handling analytics, BI, and operational reporting need version control for cleaning logic, validation at ingestion, and alerting when the shape of the data changes. If you work in a regulated environment, or with a data platform that feeds executives and customers at the same time, hidden data quality issues usually cost reputation and rework first, engineering time second.
The useful reference point is governance. In a modern stack, data cleaning sits beside ownership, lineage, and monitoring, not underneath them. If the organisation cannot explain where a number came from and why it is still valid, the problem was never just the row. It was the absence of engineering discipline.
Meet the Culprits - A Field Guide to Dirty Data
Dirty data rarely arrives as one tidy failure. It shows up as a set of repeat offenders, and each one breaks a different part of the stack. Missing values hurt completeness, inconsistent formats break joins, wrong types fail calculations, and awkward timestamps make history hard to trust. A practical audit starts by naming the pattern, because “messy” is too vague to fix.
Ghost records and shape-shifters
The Ghost Record is the empty field that looks harmless until it wipes out a segment or breaks a model input. A missing customer age, order date, or delivery postcode can skew averages, collapse cohorts, or stop a simple filter from working. ACAPS recommends checking variables directly and testing whether zeros are real zeros or missing values in disguise, a distinction that keeps a pipeline from building on the wrong assumption.
The Shape-shifter is the same value appearing in several costumes. “USA”, “US”, and “United States” may point to the same country, but if they are not standardised, a country roll-up splits into nonsense. Dates behave the same way, especially when one source sends 01/02/26 and another sends 2026-02-01. That is not a cosmetic issue, it is a logic error.
Imposters and time travellers
The Imposter is a value stored in the wrong type. A revenue column that arrives as text, or a quantity field that carries currency symbols, can sabotage aggregation. A customer age of 200 is a classic example, not because it is funny, but because it shows input validation was never enforced.
The Time Traveller is the row whose timestamp breaks chronology. An end date before a start date, a record created before the event supposedly happened, or an update that predates its own source extract can all damage audit trails and trend analysis. In the ES region, where digital operations are already embedded in businesses, those errors do not stay in the warehouse, they leak into service reports and customer-facing views (Spain enterprise digitalisation and data anomalies context).
Practical rule: when a value looks impossible, check whether it is invalid, rare, or simply outside your assumptions. Those three cases need different treatments.
The best teams keep a shortlist of these culprits visible during every profile pass. It saves time, and it stops people from debating symptoms while the root cause keeps flowing through the warehouse.
The Cleaning Playbook - From Diagnosis to Treatment
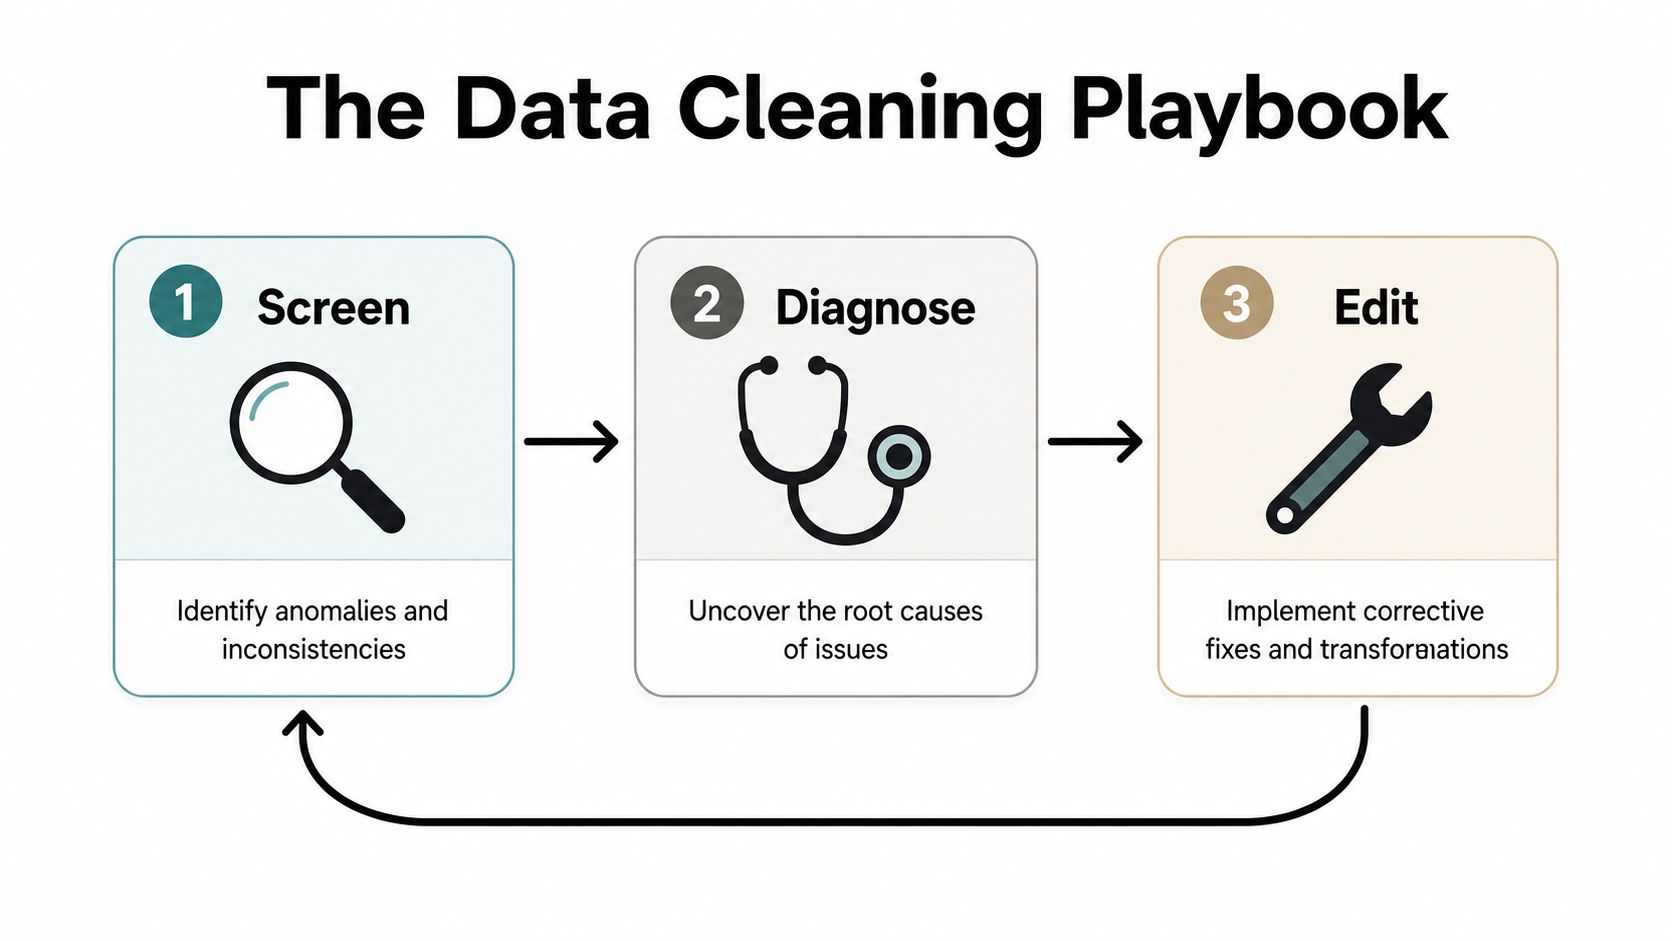
A bad export lands in your inbox, the dashboard is already red, and someone wants an answer before lunch. That is the typical setting for data cleaning. The useful response is not a one-off fix, it is a repeatable path that screens the data, diagnoses the problem, edits with care, and keeps the process visible so the same mess does not come back next week.
The strongest cleaning workflows follow screen → diagnose → edit, then run the loop again. That approach is repeated in practical guidance because one correction often reveals another issue hiding underneath it. It is slow work, but it stops teams from patching symptoms while the root cause keeps flowing through the warehouse.
Screen first, then interrogate
Screening means profiling the dataset before you touch it. Check null rates, unique values, minimums, maximums, mode, mean, and median. Summary tables catch patterns faster than jumping straight into fixes, and they show whether an apparent error is really an unusual but valid value.
That is where data profiling stops being jargon and becomes a working habit. Profiling shows what is present, what is missing, and which columns deserve human review. Skip it, and you end up correcting symptoms instead of causes.
Diagnose before you edit
Diagnosis is the part teams rush, then regret later. A value should only be changed after you know whether it is a genuine exception, a source-system bug, or a field that is different from what you expected. The basic pattern is clear, screen for anomalies, diagnose errors, then apply corrective measures. Cleanup without diagnosis is just optimism with a SQL query.
For missing and abnormal values, the better approach is rule-based and tied to the defect and its proportion, not blanket deletion. Clinical data workflows describe a practical sequence, estimate missingness first, then choose deletion or imputation based on how much is missing, and run the cycle again after repairs because new inconsistencies can appear (JMR clinical data workflow).
Edit with traceability
Editing is where teams often overreach. Deleting records can be correct, but only when the error cannot be repaired or the record has no analytical value. Imputation works when the assumptions are defensible, and standardisation is the right move when the data are valid but inconsistent in form. For income-type fields, external context still matters, since the best corrections use auxiliary sources instead of smoothing the problem away inside the pipeline.
Data Cleaning Approaches Compared | Scalability | Reproducibility | Best For |
|---|---|---|---|
Manual fixes | Low | Low | Small, one-off investigations |
Scripted cleaning | Medium to high | High | Repeatable datasets and scheduled jobs |
Dedicated platform | High | High | Continuous pipelines, alerts, governance |
The rule is simple. If the same fix will be needed again, it belongs in code or a platform, not in a spreadsheet. That keeps the work auditable and saves your team from reliving the same incident next month.
Building Resilient Data Pipelines
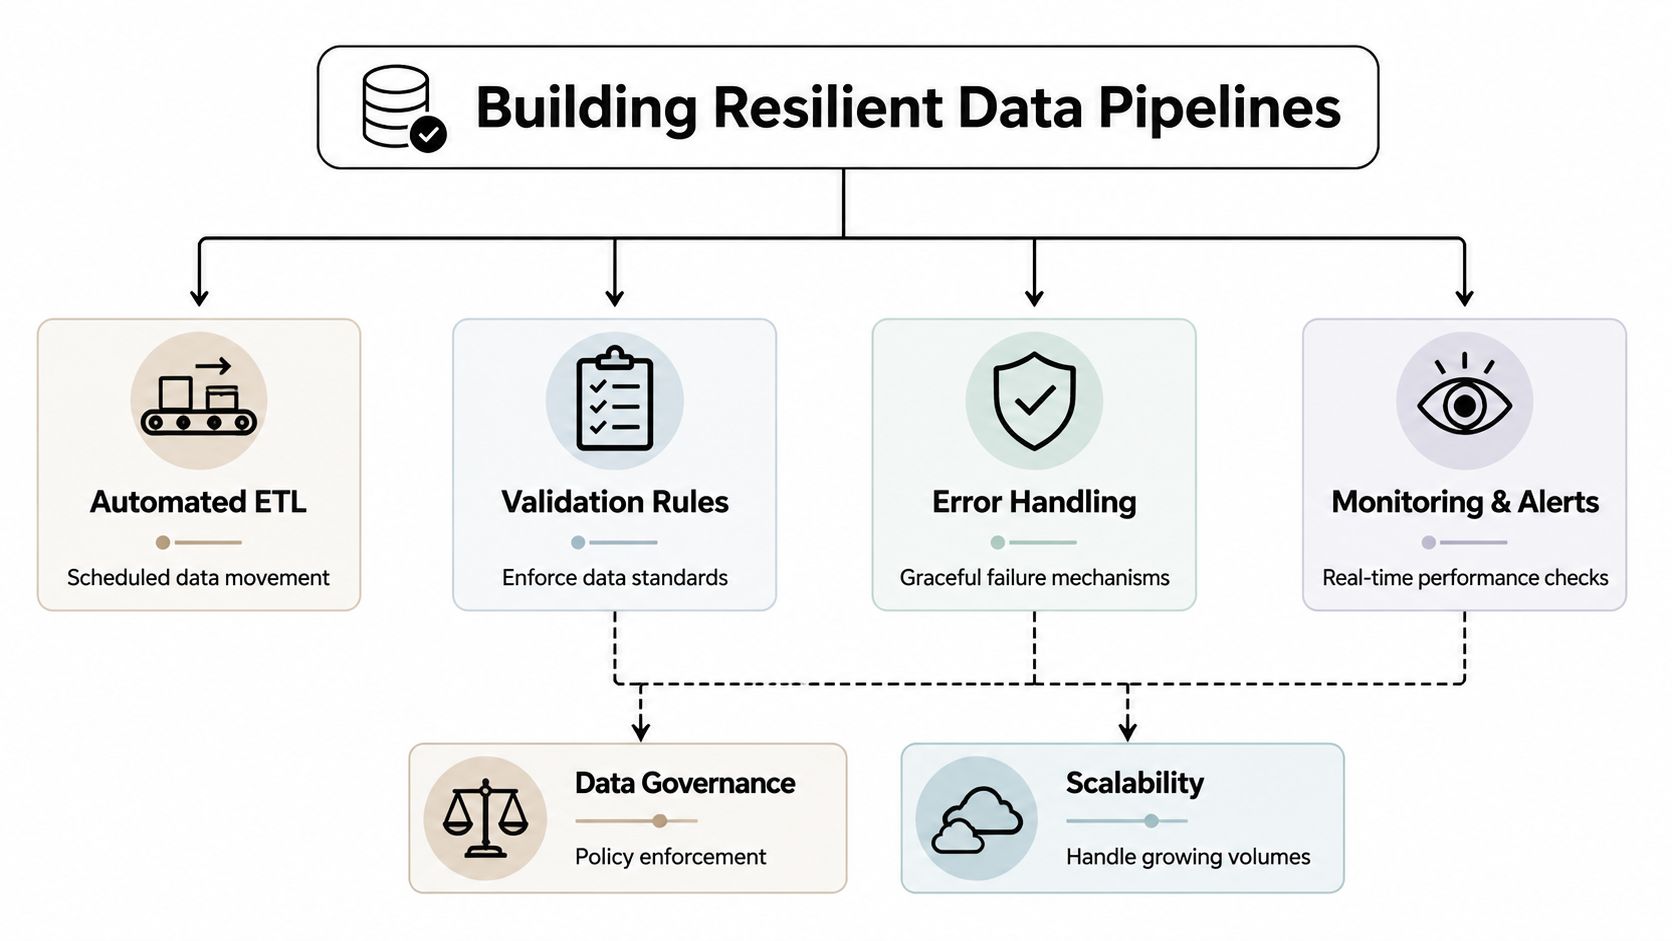
A script cleans one file. A resilient pipeline keeps doing the work after the first run, and it makes the failures visible when the inputs change. That is the difference between a one-off fix and a system that can survive schema drift, late arrivals, and the usual mess that shows up after people start relying on the report.
Put the rules where the data lives
In regulated European environments, data often cannot leave private cloud or on-premise infrastructure, so shipping records into a separate cleansing tool is a poor trade-off. The better pattern is to keep validation close to the source, so quality checks run where the data already resides and the pipeline avoids unnecessary movement. That approach also fits data pipeline best practices, especially when the goal is to keep cleaning reproducible inside the same operational path as ingestion and transformation.
That choice matters for privacy, performance, and trust. Processing inside the warehouse lets teams enforce standards without copying sensitive data across more systems than necessary. In practice, a platform like digna fits this setup because it runs checks inside customer-controlled environments and supports monitoring without pushing production data out to a vendor system.
Version the logic, not just the tables
Cleaning rules drift just like schemas do. If you do not version them, a future engineer cannot tell whether a changed metric came from business reality or from a changed threshold. Put transformations in dbt models or equivalent scripts, keep test logic in the same repository, and treat schema expectations as code, not tribal knowledge.
Practical rule: if a pipeline step affects a KPI, it needs a test, an owner, and a rollback path.
Automated checks should cover duplicates, types, schema changes, and basic business rules. The goal is not to stop every odd record, it is to stop silent corruption from reaching dashboards and models. That is a stronger standard than a nightly spreadsheet review, and it is the one that holds up once volume, ownership changes, and audit pressure all start to rise.
Make failure useful
Good pipelines do not just fail, they fail loudly and with enough detail to act on. A validation failure should tell you what broke, where it broke, and whether the issue is a data anomaly, a late-arriving batch, or a schema change. The point is to surface the right fix path quickly, not force an engineer to recreate the problem from scratch the next morning.
The practical test is simple. If an engineer cannot reproduce a fix from the log, the pipeline is still too manual.
Automating Quality with Data Observability

A dashboard that looks fine at 9 a.m. can break by lunch if a source changes, a batch arrives late, or a hidden drift slips through. Manual cleaning only catches the issues someone remembered to inspect. Data observability changes the workflow by tracking data behaviour over time, learning what normal looks like, and flagging drift before bad inputs spread into reports and models. That matters when data keeps arriving, teams depend on the same numbers, and the cost of missing an anomaly shows up as a wrong decision or a compliance problem.
From rule lists to learned baselines
The old approach says, "write a rule for every problem." That works until the data shifts and the rules start firing on legitimate behaviour. A better setup combines rule-based validation with anomaly detection that learns baselines from history, which is why probabilistic quality controls are showing up more often than static exception lists. Market material from Digitales on anomaly detection in EU data even claims 92% precision for ML anomaly detection, a sign that the field is moving toward automated signal detection instead of endless hand-maintained rules.
Rules still matter. They catch business logic violations, while anomaly detection catches unusual shifts in volume, distribution, and timing that people often miss until the damage is already visible.
Schema tracking and arrival checks matter more than people admit
A lot of trouble starts before the first row is analysed. Columns get added, data types change, a source arrives late, or a batch never lands. Schema tracking and timeliness checks catch those failures early, which keeps downstream consumers from chasing phantom bugs and keeps pipelines from drifting out of spec. That matters in finance, healthcare, telecom, and public-sector workflows, where stale reports can do real harm.
The video below is a quick visual reminder of how monitoring, validation, and anomaly detection fit together inside a living pipeline.
What observability changes for the team
The payoff is practical, not theoretical. Instead of spending mornings on manual checks, data engineers can focus on root causes, quality trends, and exception policies. A stronger platform also keeps data inside the customer-controlled environment, which matters in regulated settings and in organisations that rely on privacy-by-design and data minimisation to meet GDPR-aligned expectations, as described in the Spain GDPR and privacy-by-design context.
There is also a governance angle. Spain's LOPDGDD integrates the GDPR framework and recognises the right to digital disconnection in Article 88, which is one reason auditability and controlled processing environments matter so much for sensitive analytics work. The same discipline is part of the broader data observability approach, where visibility, traceability, and response time are built into the pipeline instead of bolted on after an incident.
The goal is straightforward. Make bad data visible fast enough that humans can act before the business feels it.
Clean Data as a Culture Not a Command
A clean pipeline is useful. A culture that expects data quality is much better. The difference shows up in who owns the problem, how quickly people react, and whether the team treats anomalies as learning opportunities or just another round of blame.
The strongest organisations don't ask data engineers to clean everything after the fact. They make producers accountable for the data they emit, they give consumers a clear path to report issues, and they keep the definitions of “valid” visible to everyone who depends on the numbers. The 2025 UNECE Expert Meeting in Lisbon is a useful reminder that this isn't a niche engineering preference, it's treated as core infrastructure for official statistics in southern Europe (UNECE 2025 meeting in Lisbon).
Ownership beats heroics
When nobody owns data quality, the same mistakes keep returning under different names. Assigning owners for critical tables, metrics, and feeds creates a real feedback loop, especially when those owners can see validation failures and schema changes as part of daily work. That's how data quality becomes a product feature instead of a cleanup ticket.
The cultural shift also protects teams from over-cleaning. Not every odd value should disappear. Some are legitimate business outliers, and some are warnings that the business itself is changing. That distinction is why observability and governance belong together.
Make quality visible
The most practical habit is to publish the rules, the exceptions, and the outcomes. A team that can explain what was changed, why it changed, and what remains uncertain is a team that can be trusted. If you need a starting point for that conversation, the guide to building a culture of data quality at digna is worth reviewing alongside your own internal standards.
Ultimately, data cleaning is not a janitorial task. It's a reliability practice, and reliability is what keeps dashboards from embarrassing you in front of the people who pay for them.
If your team is still fighting the same data issues every week, stop treating them as isolated bugs and start treating them as pipeline design problems. Review your cleaning rules, add validation where the data enters your stack, and look at how digna can help you monitor, validate, and govern quality inside your own environment.
Frequently asked questions
What is data cleaning in data engineering?
Data cleaning is an engineering discipline built on reliable pipelines, repeatable rules, and observability, not a quick script before analysis. The guide's rule: if a cleaning step cannot be reproduced, it is not really part of the pipeline. Document fixes, transformations, and deliberate exceptions so nobody mistakes a workaround for a standard.
What are the most common types of dirty data?
The guide names four culprits: Ghost Records (missing values such as an absent order date), Shape-shifters (one value in several forms, like USA, US, and United States), Imposters (wrong types, such as revenue stored as text or an age of 200), and Time Travellers (timestamps that break chronology).
What are the steps of the data cleaning process?
Follow screen, diagnose, edit, then run the loop again, because one correction often reveals another issue. Screening means profiling null rates, unique values, minimums, maximums, mode, mean, and median. Diagnosis separates genuine exceptions from source bugs, and editing applies deletion, imputation, or standardisation depending on the defect.
Should I delete or impute missing values?
That depends on the defect and its proportion, so avoid blanket deletion. Estimate missingness first, choose deletion or imputation based on how much is missing, and rerun the cycle after repairs because new inconsistencies can appear. Delete records only when the error cannot be repaired or the record has no analytical value.
How do you automate data cleaning in a pipeline?
Put transformations in dbt models or equivalent scripts, keep tests in the same repository, and treat schema expectations as code. Automated checks should cover duplicates, types, schema changes, and business rules, while learned baselines catch shifts in volume, distribution, and timing. Every KPI-affecting step needs a test, an owner, and a rollback path.



