Fix Anomalies in Database: Ensure Reliable AI
|
6
min read

You're probably dealing with one of two symptoms right now. A transactional table keeps producing duplicates, null foreign keys, or records that can't be inserted cleanly. Or your warehouse looks structurally fine, yet a dashboard drifted, a model prediction got worse, or a daily load arrived late enough to make yesterday's report wrong.
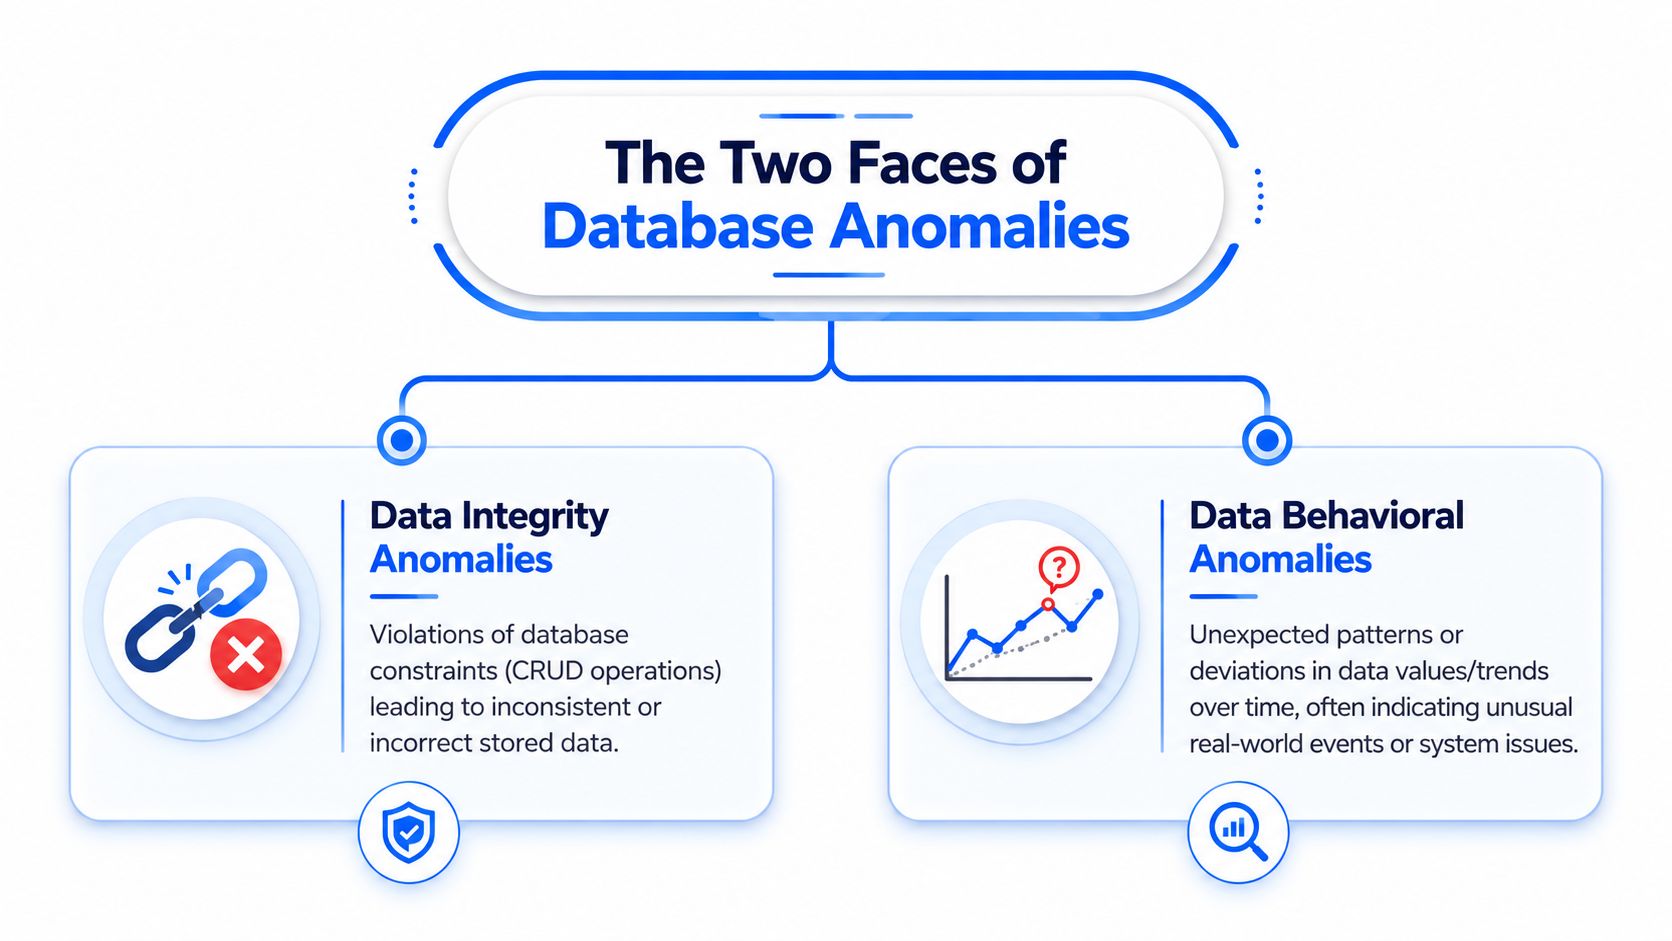
Both problems get called “database anomalies,” but they aren't the same problem. One breaks data integrity inside relational design. The other breaks data trust across pipelines, analytics, and AI systems. Teams that treat them as one category usually overinvest in schema design and underinvest in monitoring, or they do the reverse and try to observe their way out of a flawed relational model.
That split matters if you're responsible for analytics reliability. The classic anomalies in database design still exist, and normalization still matters. But modern stacks also need observability for drift, freshness, and schema behavior that won't show up in a textbook ER diagram.
Table of Contents
The Two Faces of Database Anomalies
Monday morning, a dashboard shows revenue down 18 percent. The warehouse is up, the pipelines are green, and no table failed to load. By noon, the team finds two separate problems. One source table still carries duplicated customer attributes from an old design, which caused inconsistent updates. At the same time, a new upstream field type changed how a transformation handled nulls, so the numbers were wrong even though the jobs succeeded. Both are database anomalies. They just belong to different eras of the stack.
Classic anomalies in relational design
The textbook definition is still the right starting point. In relational systems, anomalies appear when table design mixes multiple facts in one place, repeats data across rows, or fails to enforce clear key relationships. The result is a predictable set of integrity failures during insert, update, and delete operations, as outlined in this GeeksforGeeks explanation of relational anomalies.
These three categories remain useful because they map directly to design mistakes engineers still inherit in production:
Insertion anomaly: A row cannot be added without supplying unrelated data.
Update anomaly: One business change has to be repeated in multiple rows, which invites inconsistency.
Deletion anomaly: Removing one record also removes a fact the business still needs.
Teams usually spot these problems in denormalized operational tables, quick internal tools, or legacy reporting schemas that grew without clear ownership. A customer address copied into every order row works until one address changes and five records disagree. A product table embedded inside a sales table works until the last sale is deleted and product history disappears with it.
Normalization was designed to prevent exactly this class of failure. Split facts into separate tables, assign ownership with primary and foreign keys, and let constraints reject invalid states before bad data spreads. For a practical refresher, see this guide on understanding database anomalies causes and solutions.
One rule has held up well in real systems. If the same business fact can be edited in more than one row, the schema is already creating risk.
Modern anomalies in data products
The same word, anomaly, now covers a second class of problem. The schema can be valid. Keys can be correct. Constraints can pass. The failure shows up in behavior rather than relational integrity.
Examples are familiar to any team running analytics or ML in production. A daily metric moves outside its expected range. A source arrives six hours late. A column still exists, but its type or null pattern changes enough to break downstream assumptions. A model input distribution shifts while the pipeline keeps producing scores. These issues do not look like insert, update, or delete anomalies, but they still undermine trust in the database as a decision system.
That distinction matters in practice.
Anomaly family | What breaks | Typical cause | Best first response |
|---|---|---|---|
Relational anomalies | Stored data integrity | Poor normalization, redundancy, weak key design | Redesign tables, keys, and constraints |
Behavioral anomalies | Reliability of analytics and AI outputs | Drift, schema changes, freshness gaps, dependency failures | Monitor patterns, lineage, contracts, and delivery timing |
Classic anomalies damage the correctness of stored facts. Modern anomalies damage the reliability of the conclusions built on top of those facts.
Engineering teams need coverage for both. Schema design and normalization reduce structural defects at write time. Observability catches the silent failures that appear after ingestion, transformation, and consumption. That is the bridge many teams miss, especially when warehouse monitoring is treated as separate from platform design. Teams building ML-heavy systems often run into this gap first, which is one reason broader insights on artificial intelligence increasingly overlap with data platform architecture.
Why Modern Analytics and AI Are So Vulnerable
A broken insert usually fails loudly. A freshness issue often doesn't. That's why modern stacks get blindsided.

Silent failures hurt more than loud failures
The hardest anomalies aren't the ones that crash a job. They're the ones that produce plausible but wrong output. A model still scores records, but its input distribution drifted. A finance dashboard still renders, but the feed arrived late and everyone is looking at stale numbers. A downstream table still has the expected columns, but one upstream type change altered how nulls or categories get interpreted.
That's why the gap between old and new anomaly thinking has become expensive. The critical gap between traditional DBMS anomalies and modern "data anomalies" (statistical drift, schema shifts, freshness failures) leaves data engineers helpless against silent drift in ML models and real-time pipelines, where 85% of data issues originate upstream but remain undetected by rule-based systems.
For analytics, this means decision-makers trust reports that are already degraded. For AI, it means the system can remain technically available while becoming operationally unreliable.
A healthy pipeline can still deliver unhealthy meaning.
Why rule checks alone miss the real problem
Teams often start with row counts, null checks, accepted values, and a few business assertions. Those are necessary. They aren't enough.
Rule checks work best when you already know the failure mode. They're weak against gradual drift, changing seasonality, delayed arrivals, or interactions across multiple sources. That's where engineers need learned baselines and time-aware detection. In practice, this is the same shift many teams are making more broadly in AI systems. If you want a useful framing of how adaptive systems differ from static logic, these insights on artificial intelligence are worth reading alongside modern data monitoring patterns.
A few modern failure scenarios make the risk obvious:
Model input drift: The feature table still loads, but value distributions no longer resemble the training regime.
Freshness failure: The nightly batch lands late, and every dependent dashboard looks complete while telling yesterday's story.
Schema behavior change: A renamed column or type shift doesn't fully break transformations, but it changes semantics downstream.
Cross-system mismatch: An upstream dependency fails and downstream systems produce incomplete yet syntactically valid data.
The old lesson was “normalize to prevent anomalies.” The newer lesson is “observe behavior continuously because clean structure doesn't guarantee reliable output.”
A Modern Toolkit for Anomaly Detection
The right detector depends on the failure pattern and the operating context. A batch finance table, a clickstream pipeline, and a feature store can all fail in different ways while still looking "healthy" at first glance.
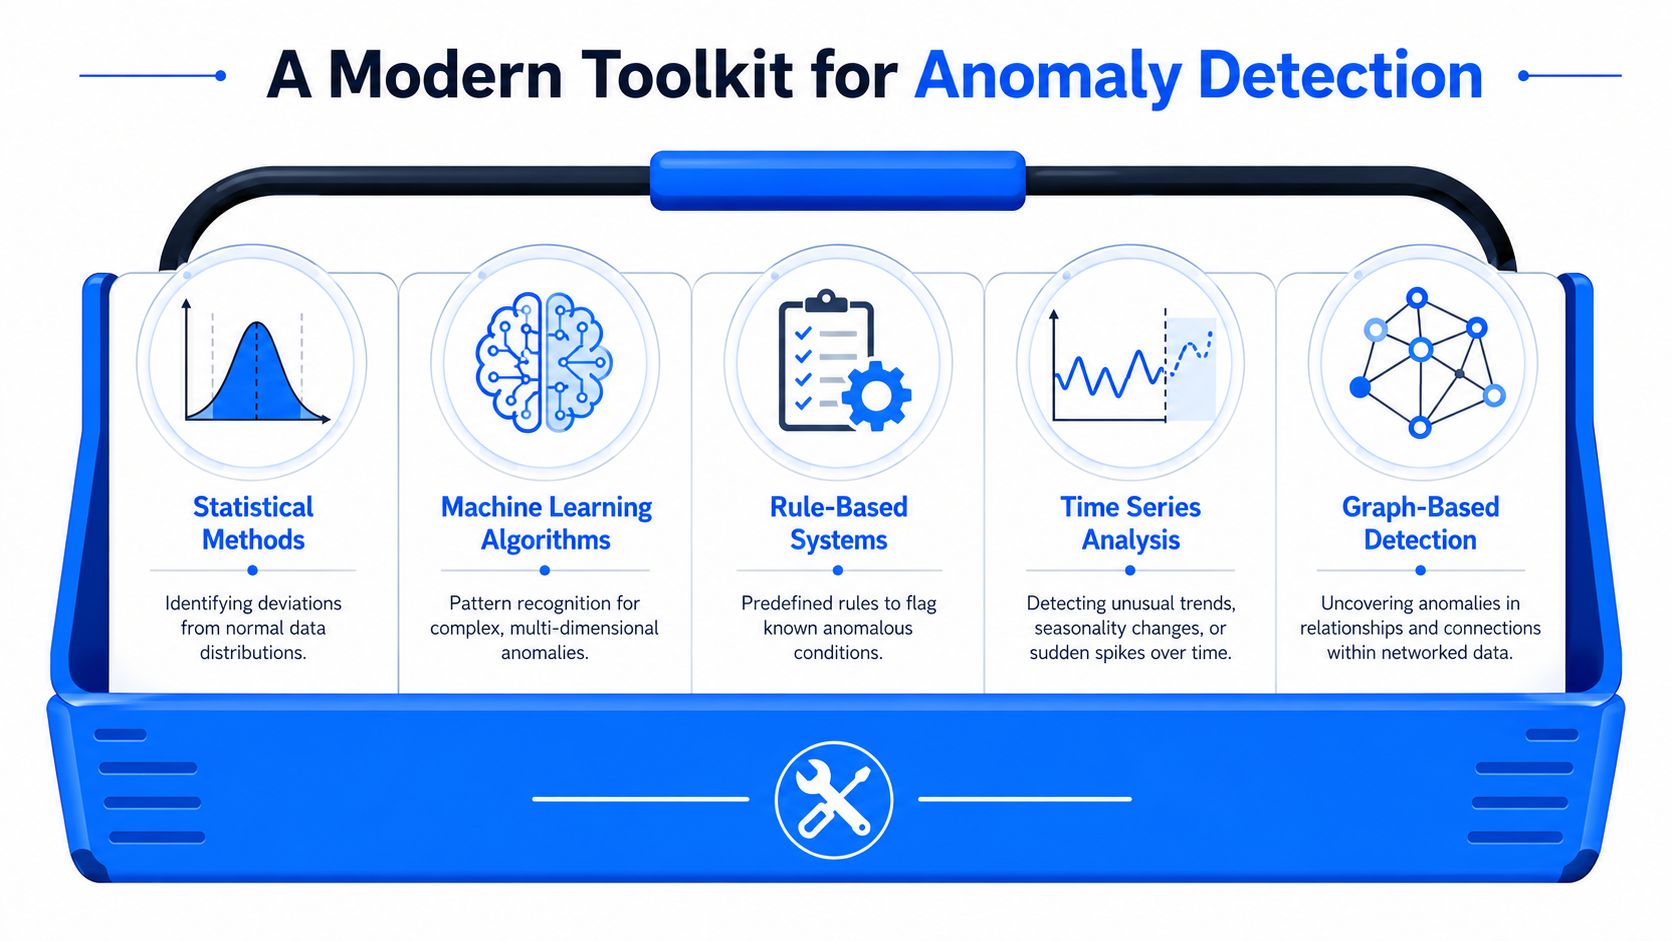
Classic database anomalies taught teams to prevent bad states through schema design and constraints. Modern data stacks add a second requirement. Detect bad behavior over time, even when tables still load and SQL still runs. A practical toolkit has to cover both.
When simple statistical checks are enough
Start with statistics for signals that should stay within a narrow operating range. For many warehouse checks, they are still the fastest way to establish a baseline and the easiest to explain during incident review.
The common options are straightforward:
Z-scores: Useful for metrics that are roughly stable and where large deviations from the mean usually indicate a real issue.
IQR checks: Useful for skewed distributions and for spotting values well outside the normal spread.
Trend comparison: Effective when today should resemble recent history within a reasonable band.
These checks are cheap to run and easy to operationalize in SQL. They work well for row volume, null-rate spikes, duplicate growth, and sudden changes in aggregate values.
They fail in predictable ways. Seasonality, delayed upstream arrivals, promotions, product launches, and multi-table interactions can all make a healthy dataset look suspicious, or hide a real problem inside an expected spike.
Where rule-based monitoring fits
Rules belong wherever the business can state an invariant clearly. Primary key uniqueness, required fields, allowed enumerations, referential integrity, and contract-level schema expectations are still the foundation.
That matters because classic insert, update, and delete anomalies never really disappeared. They just show up in new forms. A broken merge can duplicate customer records. A partial sync can update one system but not another. A soft delete can remove facts from downstream reporting while leaving enough structure in place for the job to pass.
Method | Good for | Strength | Limitation |
|---|---|---|---|
Statistical checks | Outliers and sudden shifts | Fast and interpretable | Weak with context-heavy behavior |
Rule-based checks | Known business constraints | Precise and auditable | Misses unknown failure modes |
ML-based detection | Complex and subtle patterns | Adapts to multi-dimensional behavior | Harder to tune and explain |
Use rules to protect known truths. Use them aggressively on high-risk tables. Just do not expect them to catch freshness drift, semantic changes, or slow distribution movement across model inputs.
When machine learning earns its keep
Machine learning starts to matter when normal behavior has too many dimensions for a hand-tuned threshold. That happens in event streams, feature stores, usage telemetry, and any metric with changing seasonality or cross-system dependencies.
A few methods are consistently useful in practice:
Isolation Forests: Good for finding unusual records or periods in large datasets without heavy feature engineering.
LSTM models: Useful for time-series monitoring when temporal patterns matter and simple rolling averages produce too many false alerts.
k-NN and Naive Bayesian methods: Common choices when anomaly detection depends on neighborhood behavior or probabilistic relationships between fields.
Unsupervised detection: Useful when labeled anomalies are scarce, which is common in real production systems.
The trade-off is operational, not academic. ML-based detectors can surface the quiet failures that rules miss, but they require tuning, retraining decisions, and tighter ownership. If nobody can explain why an alert fired, teams start ignoring the system.
A stronger pattern is to combine methods in the same monitoring layer. Use constraints for hard failures, statistics for fast screening, and learned baselines for behavior that changes over time. Teams evaluating that approach can review warehouse-native AI anomaly detection techniques that focus on learned monitoring inside the data platform rather than only static tests.
Use different detectors for different jobs. Constraints catch invalid states. Statistical checks catch visible shifts. ML helps catch the silent anomalies that pass every rule and still break downstream decisions.
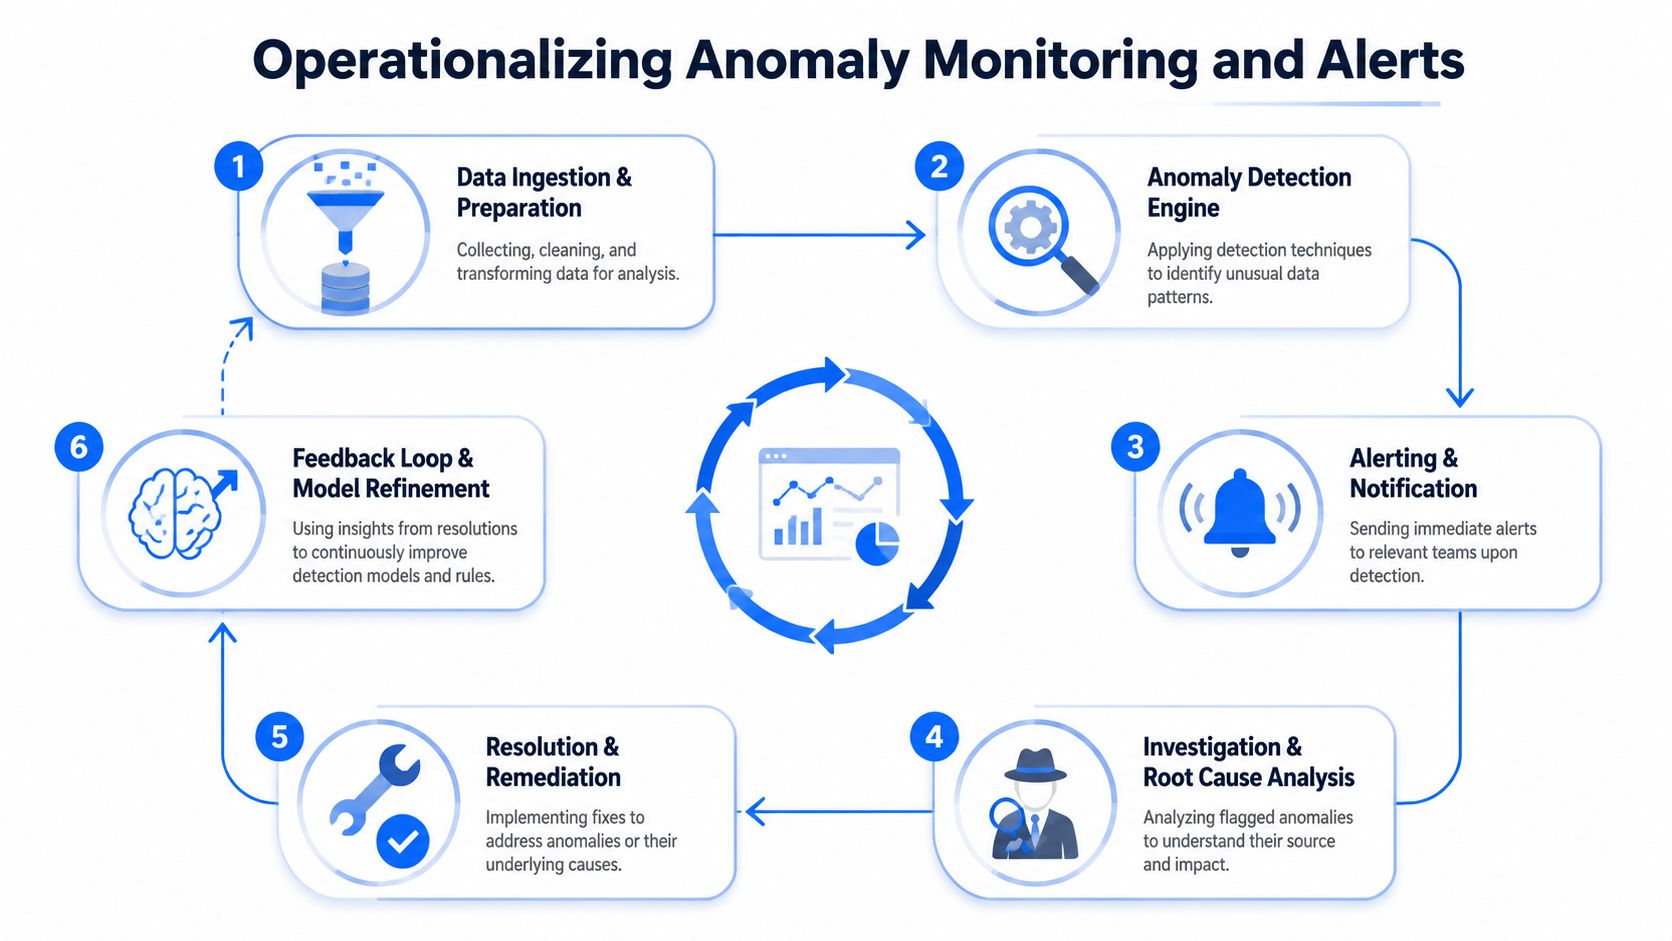
Operationalizing Anomaly Monitoring and Alerts
Detection without operations becomes noise. Teams often don't fail because they lack alerts. They fail because nobody trusts the alerts enough to act quickly.
Build an alerting path people will actually trust
A workable monitoring setup starts with ownership, not tooling. Every critical dataset, feature table, and dashboard feed needs a clear team owner and a clear definition of what “bad” looks like.
The engineering pattern that works is narrower than many organizations expect:
Prioritize business-critical tables first. Start with the datasets that feed executive dashboards, billing, regulated reporting, or production models.
Monitor multiple dimensions. Value anomalies, timeliness, schema behavior, and validation failures should be treated as different signals.
Use dynamic baselines where behavior changes. Static thresholds are fine for hard limits. They're weak for cyclical metrics.
Route alerts by domain. The team that owns the source system should see source anomalies first. Consumers should see impact alerts.
Suppress duplicates. One root issue shouldn't generate ten disconnected incidents.
A short checklist helps keep alert quality high:
Make alerts explainable: Include the affected dataset, time window, metric, and observed deviation.
Separate symptom from source: Flag whether the issue appears in ingestion, transformation, schema, or final output.
Attach context: Show recent history so an engineer can tell if the issue is a spike, drop, delay, or trend break.
Favor actionability: If the alert doesn't imply a clear owner or next step, refine it before scaling it.
Use a response workflow instead of ad hoc debugging
The resolution process should be standardized. The anomaly resolution process follows a standardized sequence: logging the anomaly with metadata, consulting stakeholders to confirm business logic, validating the issue in staging environments, deploying backward-compatible fixes with rollback plans, and documenting resolutions to prevent recurrence (Gable overview of anomaly resolution workflows).
That sequence matters because it prevents a common failure. An engineer sees a spike, patches a downstream transformation, and closes the issue without checking whether the upstream source changed intentionally. The metric recovers temporarily, but the underlying cause survives.
I've seen teams improve alert quality by treating anomaly handling like incident response instead of dashboard maintenance. Once alerts include metadata, ownership, staging validation, and rollback planning, people stop arguing about whether the anomaly is “real” and start tracing it.
Field note: If your first response to an anomaly is opening SQL and changing logic, you're probably moving too fast. Confirm the business expectation first.
From Detection to Resolution Root-Cause Analysis Patterns
Once an anomaly fires, the job changes. Detection asks, “Is this unusual?” Root-cause analysis asks, “What changed, where, and was it supposed to happen?”
The fastest teams don't investigate randomly. They follow recurring patterns based on how anomalies usually propagate.
Pattern one trace the lineage before touching code
For contextual anomalies, lineage is often the shortest path to the truth. The emerging trend is the integration of metadata-aware anomaly detection that traces lineage upstream to find the true source, reducing root-cause analysis time by 60%, a vital capability for contextual anomalies where standard statistical methods fail.
That matters because the table showing the anomaly is often not the table causing it. A reporting mart may show a revenue drop, while the actual break sits in a late upstream ingestion job or a changed join key in a staging layer.
A practical lineage-first investigation often looks like this:
Start at the impacted asset: Dashboard tile, serving table, or model feature set.
Walk upstream one dependency at a time: Check freshness, schema history, and transformation runs.
Stop at the first abnormal boundary: The first place where healthy input becomes unhealthy output usually contains the root cause.
Pattern two separate business events from data defects
Not every spike is bad data. Sometimes the anomaly is the business.
Engineers get this wrong when they investigate only from the warehouse side. If a metric jumps, ask two questions in parallel. Did code or schema change? Did the business run a promotion, launch a product, migrate customers, or alter workflow? Both can produce the same graph shape.
A useful mental model is to classify evidence into three buckets:
Evidence type | What it suggests |
|---|---|
Deployment, schema, or pipeline change | Technical defect is likely |
External event or business action | Real-world signal may be valid |
No obvious change anywhere | Look for hidden dependency or timeliness issue |
That split keeps teams from “fixing” a legitimate signal or ignoring a technical regression that happens to look commercially plausible.
Treat every anomaly as both a data question and a business question until one side is ruled out.
Pattern three check structure and timing together
Schema and freshness problems often travel together. A feed that arrives late may trigger default values, partial loads, or skipped downstream transformations. A type change can make timeliness metrics look normal while values degrade subtly.
When you investigate, pair these checks instead of running them in isolation:
Schema check: Added or removed columns, type modifications, changed nullability, altered keys.
Timing check: Expected delivery versus actual arrival, partial batch completion, retry behavior.
Value check: Distribution shifts, sudden null concentrations, category imbalance, broken joins.
Mid-level engineers often grow fastest when they stop looking at anomalies as isolated chart events and start reading them as system behavior. The anomaly in the metric is just the visible clue. The root cause usually sits in the contract between systems, not in the chart itself.
The In-Database Advantage Architecture and Governance
Architecturally, anomaly management gets easier when detection runs close to the data. That isn't just a performance preference. It changes privacy, governance, and operating overhead.

Why in-database observability changes the operating model
When monitoring requires exporting large datasets to an external service, teams add movement, duplication, and governance review to a problem that already needs fast diagnosis. In-database execution avoids much of that friction.
The main architectural advantages are straightforward:
Privacy control: Sensitive production data stays in the customer-controlled environment rather than being copied out for analysis.
Lower movement cost: You compute metrics where the tables already live instead of shipping raw data elsewhere.
Operational simplicity: Data engineers work from warehouse-native assets, permissions, and scheduling patterns.
Stronger governance: It's easier to align observability with access controls, audit requirements, and data residency expectations.
This model is especially useful in finance, healthcare, telecom, and public sector environments where teams care as much about who can inspect data as they do about detecting anomalies.
How a unified platform maps to real anomaly classes
A good observability architecture should cover both faces of anomalies discussed earlier. Structural safeguards still belong in schema design and validation rules. Behavioral monitoring belongs in continuous analysis across values, timing, and structure.
That's why a unified approach is more useful than a pile of disconnected checks. One example is digna, which runs analyses inside customer databases and combines several capabilities that map directly to common anomaly classes:
Data Anomalies: Learned baselines for unexpected behavioral changes in configured tables.
Timeliness: Monitoring for late or missing arrivals against learned patterns and expected schedules.
Schema Tracker: Detection of added or removed columns and data type modifications.
Data Validation: Record-level rule enforcement for business logic and audit requirements.
Data Analytics: Historical observability metrics for trend analysis and prioritization.
This matters from a governance perspective because teams can inspect trend changes, timeliness, and structural changes in one operating surface without handing production data to a vendor. It also matters from an architecture perspective because the same platform can support warehouse tables, lake data, and pipeline ecosystems while keeping the core analysis where the data lives.
The practical benefit isn't that one tool magically removes every anomaly in database systems. It's that the operating model becomes coherent. Engineers can keep classic relational hygiene in the model, use validation where the business knows the rules, and add behavior-aware monitoring for the classes of failures normalization was never meant to catch.
Reliable AI starts with reliable data behavior, not just clean schemas. If your team needs anomaly detection, timeliness monitoring, schema tracking, and validation in a customer-controlled environment, digna is one in-database option to evaluate.