Which Database Is Best for Your Workload in 2026
|
6
min read
People keep asking which database is best, as if there's a clean winner hiding in the rankings. There isn't. The better question is which database is best for the failure mode you can live with, because that's what decides whether your system stays useful when schema drift, late data, residency rules, or a bad query mix show up in production.
If you want a real answer, stop looking for a universal champion and start matching the database to the workload, the scale, the deployment boundary, and the kind of trouble you can detect and contain. For database management practices that keep that decision honest, this guide from digna is a useful companion.
Database family | Best for | Where it usually wins | Where it usually loses |
|---|---|---|---|
Relational databases | Structured transactional systems and SQL-heavy applications | Strong consistency, mature tooling, broad adoption | Not the best fit for massive analytical scans |
NoSQL document and key-value systems | Flexible application data and fast-changing product schemas | Schema flexibility and simple access patterns | Less natural for complex ad hoc analytics |
Columnar OLAP and warehouses | Reporting, aggregations, and real-time analytics | Fast scans, groupings, and concurrent analytical queries | Not the first choice for OLTP-style workloads |
Graph databases | Relationship-heavy queries and connected data | Traversing networks of entities and edges | Overkill for ordinary tabular workloads |
Lakehouse systems | Mixed analytics across large datasets | Unifying warehouse-style analytics with broader storage patterns | Can add complexity if you only need a clean SQL store |
Table of Contents
Why There Is No Single Best Database
The “best database” question fails as soon as you treat every workload as if it has the same failure mode. A system built for transactional SQL is optimized for correctness, row-level updates, and predictable writes. A system built for analytics is optimized for aggregations, scans, and many readers hitting the same data.
Modern analytics and statistics workloads have pushed the market toward columnar and OLAP systems because those engines are designed for large scans and grouped reads. Current guidance names ClickHouse, Apache Druid, and Apache Pinot among the stronger real-time analytics options, with real-time analytics defined by high data freshness, low query latency, high query concurrency, and long data retention (Tencent Cloud TechPedia). That solves a different problem from transactional SQL, so it needs a different engine under the hood.
A single ranking hides that split. PostgreSQL is often the sensible default for structured SQL-centric systems, while large-scale analytical workloads are better served by ClickHouse or a cloud data warehouse. Those choices are not substitutes, and treating them as interchangeable turns a technical decision into a slogan.
Practical rule: choose the database whose failure modes match your tolerance, not the one that looks nicest on a comparison chart.
That rule matters because the question is not “Which database is fastest?” It is “Which database can I run, observe, and govern without creating a blind spot I cannot afford?” A system that wins a benchmark but hides late-arriving data, schema drift, or residency violations is a bad production choice. If your operating model depends on knowing what the database is doing, database management best practices belong in the selection process from the start, not as an afterthought.
PostgreSQL's rise as a mainstream open-source database proves the same point from another angle. Benchmark and comparison guides still place it near the top for general-purpose work, and one comparison scores PostgreSQL 94/100, ahead of MySQL at 87/100, MariaDB at 86/100, and SQLite at 76/100 for embedded use cases (BenchHub comparison). Even that spread says less about a universal winner and more about workload class, scale, and operational constraints.
The right answer is contextual. If one database has to serve every job, you are already accepting a compromise. Say the compromise out loud, then pick the system whose weak points you can live with.
The Five Decision Criteria That Matter
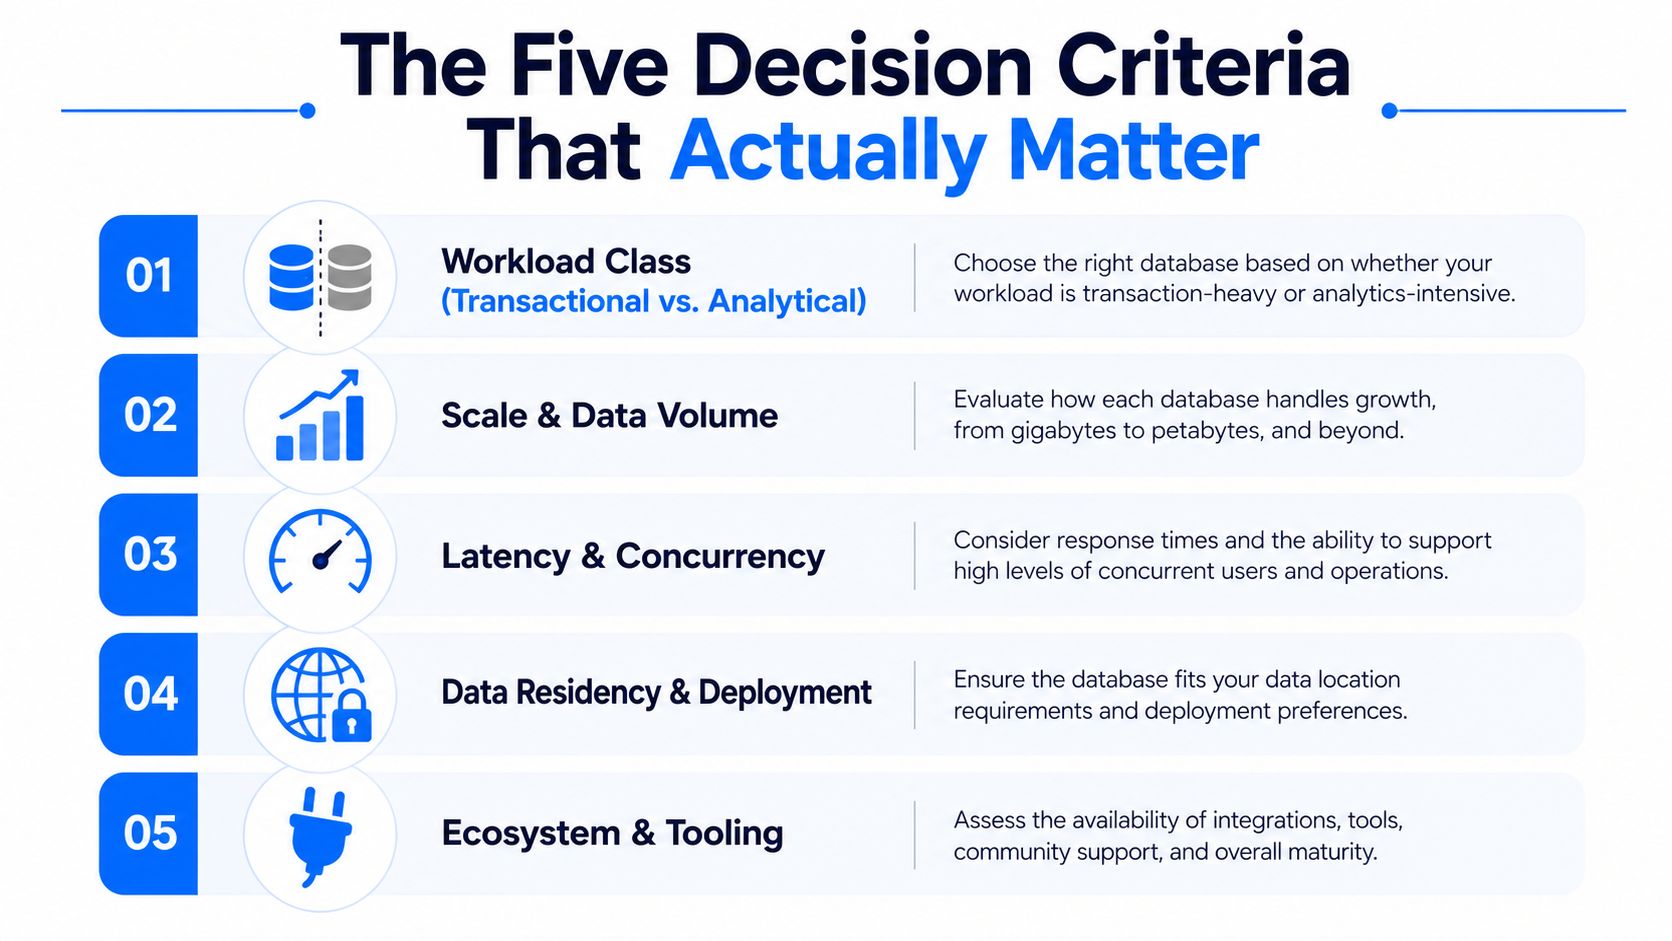
1. Workload class
This is the first filter, and it is the one people skip. Transactional systems are built for correctness, row-level updates, and predictable writes. Analytical systems are built for scans, aggregations, and many readers hitting the same data.
Ask a sharper question, is this database serving an application, or answering questions about the application's history? Forcing an OLTP engine into a dashboard workload is a common way to create concurrency problems and then blame the database for doing the wrong job.
2. Scale and data volume
Scale is not just “big or small.” It covers the size of the dataset, the growth pattern, and how much of the data you need to touch at once.
Ask, will this stay inside a tidy operational envelope, or do I need a system that handles large scans and retention cleanly? The mistake is optimizing for today's table size while ignoring where the data lands in six months.
3. Latency and concurrency
Latency is user experience. Concurrency is how much pressure the system absorbs when several people or jobs hit it at once. Benchmark guidance says to compare systems on throughput, latency, concurrency, and resource utilization under realistic read and write mixes, not on a single headline metric (Aerospike benchmarking guidance).
Ask, what happens when the same query pattern arrives from ten teams at once? Average response time hides tail behavior, and tail behavior is what hurts production.
4. Data residency and deployment model
This is not a side issue. Many buyers need a database that runs in their own cloud or on-prem environment for data residency, latency, and governance reasons, especially in finance, healthcare, and public sector settings (Netlib Security overview).
Ask, where must the data legally and operationally live? Shortlisting a managed service before checking whether it can stay inside your boundary is a bad habit.
5. Observability into schema, timeliness, and quality
A database can be fast and still leave you blind. Teams need visibility into schema drift, late-arriving data, and record-level anomalies, because those failures break dashboards and models even when storage and query paths are healthy.
Ask, how will I know the data is still trustworthy tomorrow? Treat monitoring as a selection criterion, not an add-on. If the platform cannot show you what changed, what arrived late, and what looks wrong, you are buying hidden risk.
If you run these five checks, the shortlist gets much shorter. That is the point. Choose the database whose failure modes you can live with, and whose monitoring gives you enough visibility to catch problems before users do.
Comparing the Main Database Families
Database Families at a Glance
Family | Best Workload | Typical Scale | Latency Profile | Residency Fit | Observability Notes |
|---|---|---|---|---|---|
RDBMS | OLTP, SQL-centric applications, mixed operational data | Small to very large, depending on tuning | Predictable for transactional work | Strong when self-hosted or controlled deployment is required | Good ecosystem, clear schema, strong operational tooling |
NoSQL document and key-value | Flexible product data, session-like data, simple access patterns | Medium to very large | Fast for targeted lookups, less ideal for complex joins | Good if the deployment model matches your boundary | Schema flexibility helps, but that can hide drift |
Columnar OLAP and warehouses | Reporting, aggregations, real-time analytics | Large to massive | Excellent for scans and analytical concurrency | Often strong, but depends on managed vs controlled deployment | Good for analytics observability if paired with pipeline monitoring |
Graph databases | Relationship traversal, fraud paths, dependency networks | Medium to large, workload dependent | Strong for connected queries, not general purpose | Can fit private deployments, but tooling varies | Needs careful lineage and query visibility |
Lakehouse systems | Cross-domain analytics, large shared datasets | Large to massive | Optimized for analytical access, not transactional churn | Often strong in private cloud or controlled storage patterns | Useful when you need storage and analytics governance together |
RDBMS is still the default sane choice when the application is transaction-heavy and SQL matters. PostgreSQL is the most obvious representative, and the reason it keeps showing up is simple, it handles complex SQL, constraints, and mature operational patterns well. If your system is a product database, billing ledger, or mixed operational store, start here before you go exotic.
NoSQL document and key-value systems fit when the shape of the data changes faster than your schema policy can keep up. MongoDB is the obvious example, and it shines when product teams want flexible documents and simple retrieval. The trade-off is that flexible structure can make governance and drift harder to notice until downstream consumers complain.
Columnar OLAP and warehouses are the right answer when reads are mostly scans, groupings, and aggregations. ClickHouse belongs in this conversation, and so do cloud data warehouses when the workload is analytical and the team needs concurrency for dashboards or reports. The “best database” answer often lands here, because analytics is where relational defaults start to strain.
Graph databases are for relationship questions that become unreadable in tables. If you care about fraud rings, identity networks, dependency chains, or multi-hop traversal, they're the right specialist tool. If you're using one because it sounds advanced, you're probably paying extra complexity for no gain.
Lakehouse systems make sense when a team wants broad analytical access without splitting storage and governance across too many places. They're not a magic answer, and they're not a substitute for a transactional database. They're useful when the storage footprint is large enough that a warehouse-only mental model feels too narrow.
The wrong database family doesn't just slow you down, it changes the kind of failures you inherit.
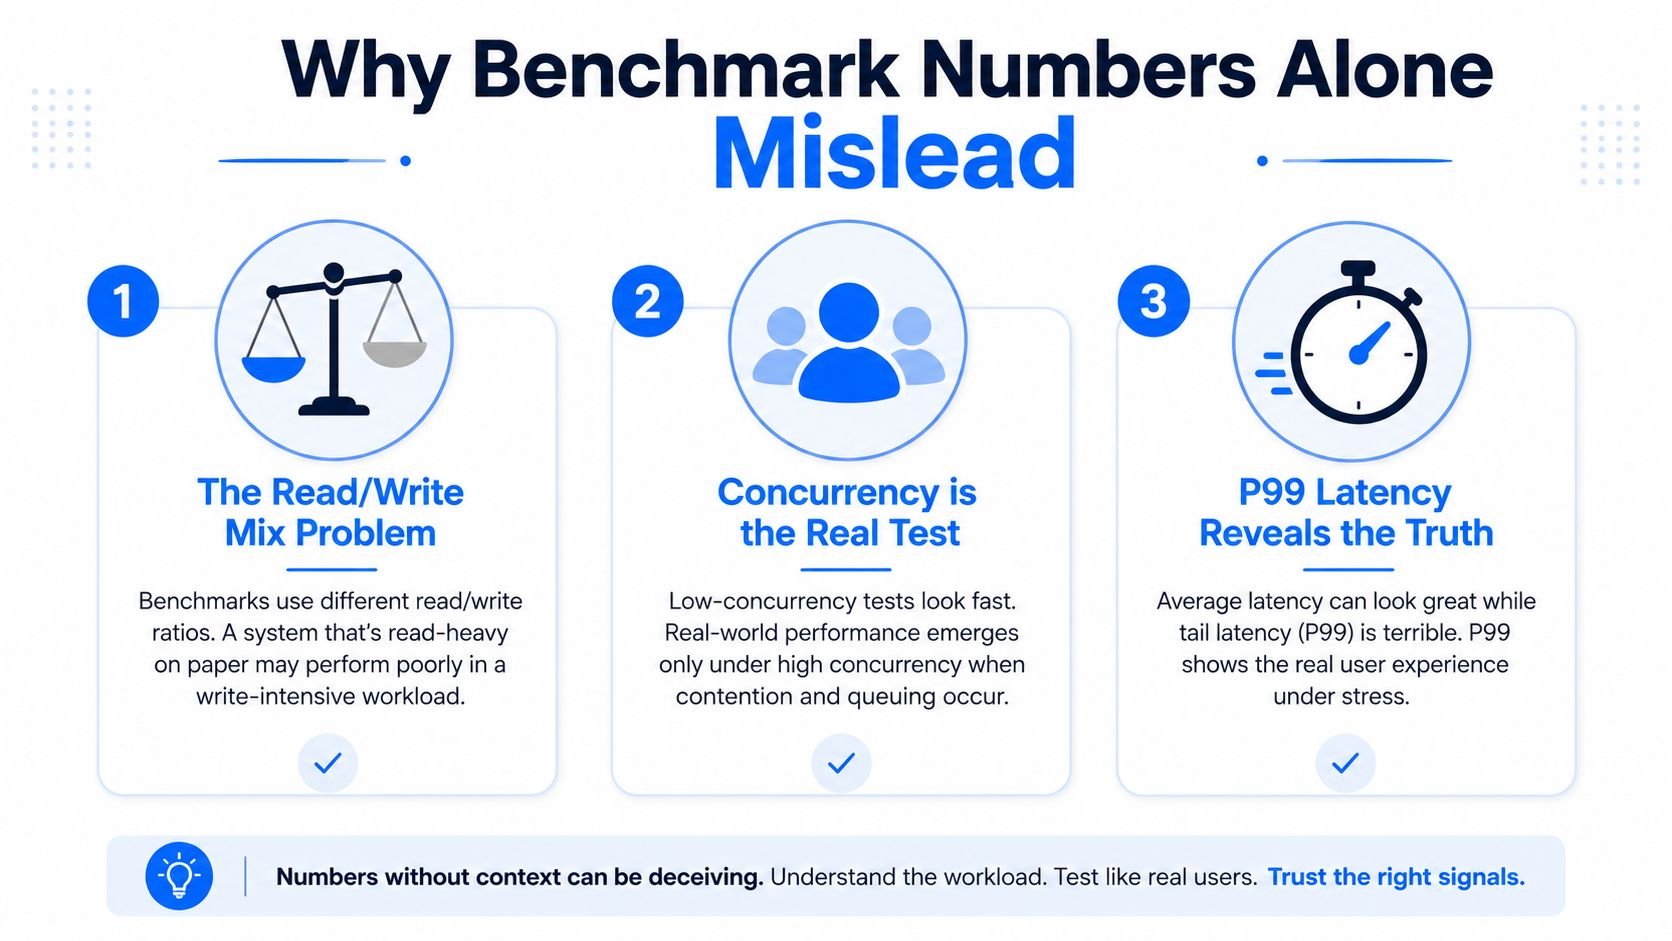
Why Benchmark Numbers Alone Mislead
Benchmark charts look persuasive, and that is exactly why they mislead so easily. A database can sit near the top of a leaderboard and still be the wrong production choice if the benchmark hides the actual read and write mix, the concurrency pattern, or the shape of the queries your team runs all day.
Throughput is not user experience
QPS or raw throughput can look strong and still miss the core issue. The question is whether the system keeps individual queries moving once the workload gets messy, because average numbers hide slow tails, and those tails are what users truly feel.
That is why P99 latency matters more than a single throughput figure. ScyllaDB's benchmarking glossary treats P99 latency as a better signal because it shows whether nearly all queries are returning quickly and consistently (ScyllaDB glossary). If the median looks fine but the tail is ugly, dashboard users still experience the database as broken.
Concurrency exposes the lie
A single-threaded benchmark flatters systems that fall apart under load. Real teams do not hit a database one query at a time, they run dashboards, pipelines, ad hoc analysis, and scheduled jobs together.
Benchmarking guidance also says to look at throughput, latency, concurrency, and resource utilization under realistic read and write mixes, with transparent hardware and reproducible setup details (Aerospike benchmarking guidance). If the vendor will not say what hardware they used, how they tuned the system, or whether someone else can reproduce the result, the number is less useful than it looks.
The read/write mix changes everything
A system tuned mostly for reads can look brilliant until write volume rises. A system that handles writes cleanly can still stumble when analysts run heavy aggregations alongside application traffic.
The “fastest database” claim is usually meaningless on its own. The workload pattern decides the winner, not the bragging rights.
Use a simple rule. Benchmark scores are a screening tool, not a decision. Production fit comes from your actual query mix, your concurrency profile, your observability, your data residency boundary, and the worst latency you can tolerate.
A Real Selection Scenario for a Finance Team
A mid-sized finance team needs a database for reporting and AI scoring. The team also has a hard residency rule, the data has to stay inside its own cloud boundary. That immediately removes a lot of polished managed options from consideration, no matter how good they look on a public benchmark page.
The workload points in one direction. Reporting and scoring are analytical jobs, so a columnar warehouse or a self-hosted OLAP system is the right starting point. For this kind of workload, systems built for analytical SQL are the better fit, while PostgreSQL stays the more natural choice for structured SQL-centric work.
The residency rule sharpens the decision. A managed multi-tenant cloud database can be operationally convenient, but if it cannot live inside the team's own cloud or governance boundary, it creates a compliance problem the benchmark page never mentions. For finance, that is the first filter.
Practical rule: if the data cannot leave your boundary, the “best” database is the one you can deploy inside that boundary without creative exceptions.
A warehouse wins here if it supports the team's SQL, concurrency, and retention needs while respecting the deployment model. A self-hosted OLAP stack wins if the organization wants tighter control over infrastructure and traffic paths. What loses is the generic “best overall” recommendation that ignores where the data must live.
The right answer in this case is not a flashy product category, it is a controlled analytical system with clear operational ownership. The finance team's real constraint is not query syntax, it is governance, residency, and observability. If the database cannot tell you when data quality breaks, it is a bad fit even if the benchmark looks strong.
A serious team should also check whether the platform supports in-database monitoring and the checks needed to catch stale feeds, schema drift, and bad records before they reach reporting. That is a selection criterion, not an afterthought. For a practical reference point, see data quality metrics for monitoring pipelines.
Observability and Data Quality as a Selection Criterion
A database can look healthy and still feed bad decisions to the business. If a schema changes under the pipeline, a source arrives late, or records drift out of consistency, dashboards and models fail while the database reports nothing obvious. That is why observability belongs in database selection, not in the bucket of tools you promise to add later.
A better way to frame the question is simple. Which database can fail in ways your team can detect, explain, and contain?
The failure modes you need to catch
The common ones are easy to name and hard to ignore. Schema drift breaks downstream jobs when columns appear, disappear, or change type. Late-arriving data makes dashboards look stale. Record-level anomalies distort metrics without triggering an outage.
You need monitoring that runs where the data lives. If checks execute inside the customer environment, data stays resident and you avoid moving sensitive records across systems just to inspect them. That is the right place to keep in-database execution, anomaly detection, timeliness monitoring, schema tracking, and validation, because a platform team should demand that level of control from its observability stack.
For teams that want a practical baseline, data quality metrics should cover freshness, schema stability, and record validity before anyone signs off on the database.
Why monitoring belongs in the selection decision
The old model treats data quality as an afterthought, something you bolt on after storage is chosen. That is backwards. The database and the monitoring model need to fit together, because the way data is stored and queried shapes how quickly you spot a break.
A platform that computes metrics in-database can inspect trends without shipping sensitive data elsewhere. That matters for teams with residency or governance constraints, because the monitoring layer should not become the weakest compliance point in the stack. The publisher's product page also notes support for historical analytics, expected delivery calculations, and record-level validation, which are the controls teams use to keep pipelines honest.
Pick a database without observability and you are buying a blind spot. The better question is whether you will know, quickly and inside your own environment, when the data stops being trustworthy.
A Short Decision Checklist You Can Reuse
Before you choose, answer these four questions in order.
What failure mode can you not tolerate? If the answer is stale dashboards, broken joins, or compliance exposure, that changes the shortlist immediately.
Where must the data live? If the answer is inside your own cloud or on-prem boundary, eliminate anything that can't operate there cleanly.
What is your P99 latency target? If you only look at averages, you'll miss the slow queries that annoy users and break trust.
How will you test schema drift, timeliness, and quality over time? If the answer is “we'll figure that out later,” your database choice is incomplete.
The best database is the one whose behavior you can observe and govern over time, not the one that wins a generic ranking chart.
If you're making this decision for a real team, digna helps you keep the database honest by monitoring data anomalies, timeliness, schema changes, and validation inside your own environment. Visit digna if you want a practical way to observe the failure modes that benchmark tables leave out and build a data stack you can trust in production.