Real Time Data Quality: A Practical Guide for 2026
|
7
min read

You already know the feeling. The dashboard looked fine in the morning, the source system had changed by lunch, and by the time someone noticed, the warehouse had been telling a story that wasn't true. In regulated environments, that kind of gap isn't a cosmetic issue. It's how a stale feed turns into a bad decision, a broken report, or an incident nobody can explain cleanly.
Real Time Data Quality is the discipline of catching those failures while the data is still moving. That means quality checks aren't a nightly cleanup job anymore, they're part of the live operating path, tied to freshness, latency, schema changes, and null counts as observable signals of health IBM observability metrics. It also means the architecture has to respect one hard truth, streaming validation has to run continuously without wrecking end-to-end latency IJERET streaming quality research.
Table of Contents
The Moment Batch Quality Stops Working
The failure mode is familiar. A finance dashboard looks consistent on Tuesday, a model is scoring normally, and then on Friday the numbers drift, but nobody can point to the exact moment the data turned bad. Batch checks can say yesterday's load passed, while the core problem started between jobs and propagated downstream before anyone had a chance to stop it.
That's why real-time quality isn't just “faster batch.” It's a different operating model. Streaming-quality research describes quality metrics being computed continuously so teams can detect issues as data arrives rather than after nightly processing jobs, which is a meaningful shift in how engineers think about control, not just tooling ACM streaming analytics paper.
Freshness changes the definition of quality
In practice, the missing dimension is often timeliness. A dataset can be technically valid and still be operationally wrong if it's late, missing, or arriving out of cadence. That's why freshness, latency, and pipeline behavior now matter as much as the classic dimensions of accuracy and completeness.
Practical rule: if the dashboard depends on time-sensitive data, treat delay as a quality defect, not just a pipeline nuisance.
Batch validation still has a place, especially for retrospective audits and deep profiling. But for fraud, operations, and customer-facing workflows, waiting for the next scheduled job is how bad records spread. Real-time quality exists because the business cost of being late shows up before the batch window closes.
What Real-Time Data Quality Actually Means
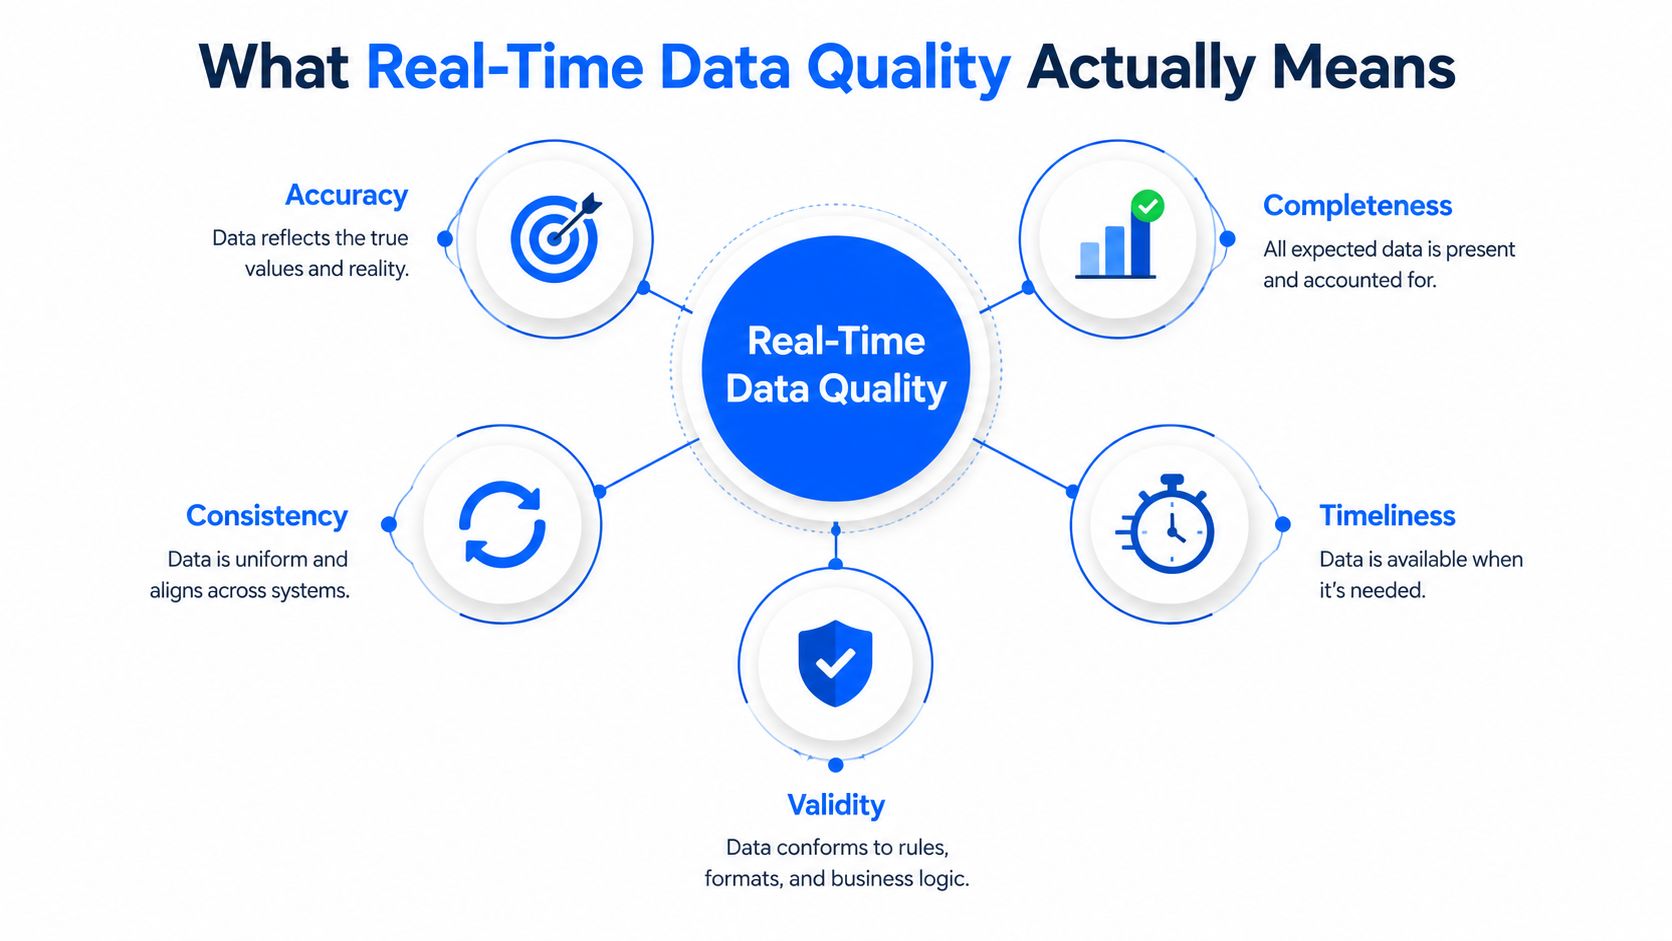
A useful definition is simple. Real Time Data Quality is continuous checking of data as it moves through the pipeline, with controls that judge whether each record is fit for downstream use at the moment it arrives. The point isn't to build a second warehouse of rules, it's to keep structural and behavioral problems from crossing the boundary into production systems.
Freshness sits at the center
For real-time systems, freshness is usually the first metric that reveals trouble. A standard way to define it is the time elapsed since the most recent record was written to a dataset, measured against an SLA Soda freshness metric guidance. That makes freshness operational, not philosophical.
The rest of the dimensions become easier to reason about once freshness is in place:
Completeness tells you whether expected fields and sources arrived.
Validity tells you whether values match the expected format, type, and range.
Consistency tells you whether the same entity agrees across systems.
Uniqueness tells you whether duplicates are leaking into the stream.
IBM's standard dimensions include accuracy, completeness, consistency, timeliness, validity, and uniqueness, and the UK government's definition of validity keeps the focus on format, type, and range IBM data quality dimensions.
A single record can be evaluated against all of them at ingest time. If an order event arrives on time, with the right schema, an accepted currency, no duplicate ID, and matching customer reference data, it passes. If it arrives late or with a type change, the system should flag the specific dimension that failed, not just mark it “bad.”
Timeliness is not a side metric. In live systems, it's part of the definition of quality itself.
Real-Time vs Batch Quality and Where Each Breaks
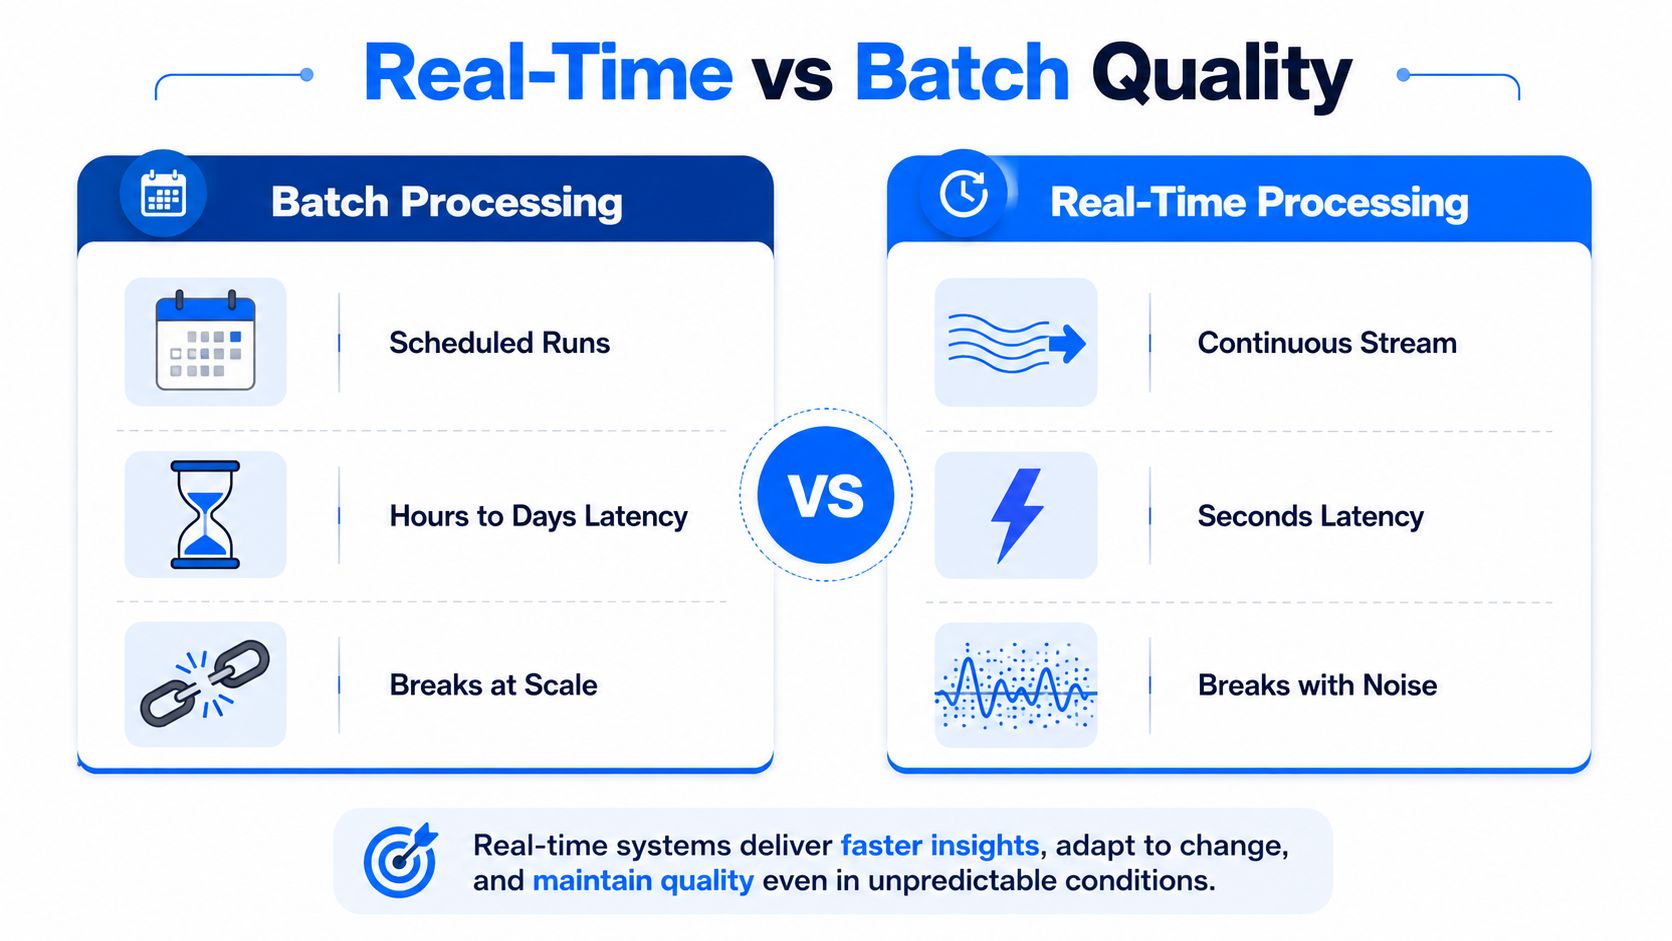
Batch quality and real-time quality are not rivals. They're different control surfaces. Batch gives you breadth, historical context, and cheaper retrospective analysis. Real-time gives you a chance to block bad events before they contaminate dashboards, models, or customer workflows.
The distinction matters because the same dataset behaves differently under each regime. An overnight job may catch malformed rows after load, while a streaming check can stop them at ingestion. Scheduled micro-batches narrow the gap, but they still leave blind spots between runs. Continuous streaming closes that gap by validating while data is still in motion Confluent streaming architecture guidance.
Where batch still belongs
Batch quality still earns its place in programs that need deeper profiling, post-incident investigation, or audit-ready evidence. It's useful when you want to scan large histories, compare distributions, or prove a control ran on a specific schedule. In other words, batch is good for analysis.
Where it fails hard
It fails when the business cares about the current state of the world. Revenue dashboards, fraud detection, clinical alerting, and operational SLAs all depend on data that's current enough to act on. If a supplier misses an overnight run, the report can still look clean while the warehouse is already hours stale. That's the worst kind of failure, because the numbers appear trustworthy.
Batch says the job finished. Real-time says the data is still fit for use.
The practical answer is usually mixed. Let batch do the deep retrospective work, but move ingestion checks, timeliness checks, and business-critical validation into the streaming path. That way, the nightly report becomes confirmation, not the first line of defense.
Inside the Real-Time Quality Pipeline
A practical streaming pipeline follows five steps. First, ingest events into a streaming layer. Then validate the schema at the boundary, apply business rules to the payload, and route invalid records to quarantine instead of dropping them. After that, compute quality KPIs continuously and alert when thresholds are breached. A Confluent pipeline flow is a useful reference for that sequence.
Why execution location matters
The biggest mistake teams make is moving data to a separate quality engine when the source system already has enough context to evaluate it. A Cambridge study on real-time big-data systems found that quality-check overhead depends on transfers between modules, message synchronization, and algorithm complexity, which is why extra hops can slow the entire pipeline Cambridge real-time big-data study. In practice, that pushes teams toward in-stream and in-database checks.
Schema enforcement belongs at ingestion because it is the cheapest place to catch structural drift. Business rules belong right after that, while the event is still actionable. Quarantine is not a failure state, it is a control point. Bad records should be isolated, labeled, and kept available for review without letting them pollute downstream systems.
The architecture also needs a shared place for engineers and analysts to see incidents. A single UI for anomalies, validation failures, and timeliness breaches reduces handoffs, especially when platform teams and business teams need to look at the same record in the same window. That matters even more when the operating model includes real-time data monitoring, because the people watching the pipeline need to separate noise from real breakage quickly.
For teams evaluating tooling, the practical checklist is simple: schema enforcement, streaming rules, quarantine, and visible metrics. The right setup is the one that keeps checks close to the data, keeps failures observable, and keeps latency within the window the business can tolerate.
How In-Database Execution, Anomaly Detection, and Schema Tracking Fit Together
The most effective systems don't treat monitoring modules as isolated features. They work like a control plane. In-database execution keeps data in place so checks happen inside the customer's own environment, which reduces movement and aligns the quality layer with existing governance. Anomaly detection adds baseline learning so the system can flag deviations without forcing engineers to hand-write every threshold.
Three capabilities, three different failure modes
Anomaly detection is strongest when behavior shifts but the schema stays stable. It learns the normal shape of a dataset and flags unusual patterns, spikes, or drops. Schema tracking covers a different class of failure, added columns, removed columns, and data type changes that can break downstream consumers before business logic ever runs.
Timeliness monitoring closes the gap that the other two miss. A dataset can look statistically normal and still be late, early, or missing. That's why arrival patterns, expected delivery times, and delay detection belong in the same operational brain as anomaly detection and validation.
Good quality systems don't ask one module to solve every problem. They stack modules so each one catches a different failure mode.
For a practical lens on model selection, the guide to choose the right anomaly detection solution is useful when you're deciding whether to rely on deterministic checks, learned baselines, or both. And if you're mapping this approach into a warehouse-centric stack, the internal framework on Databricks data quality framework is a helpful reference point.
digna fits this pattern as one option in the market, because it runs checks in the customer's own environment, supports in-database execution, and combines anomaly detection, timeliness, validation, and schema tracking in one platform. That combination matters more than any single feature.
KPIs You Should Actually Track
A real-time program doesn't need a giant dashboard. It needs a short list of metrics that map directly to operational risk. Start with freshness, latency, the number of outdated records, the percentage of values outside accepted ranges, the ratio of records failing validation rules, and syntax or format errors such as invalid email addresses Alation data quality metrics.
The right metric depends on the failure you're trying to stop. Freshness tells you whether the latest load is usable. Latency tells you how much of the dataset met the SLA window. Validation failure rate tells you whether rules are too loose or upstream data changed. Out-of-range values catch bad business events that still look syntactically valid.
Core Real-Time Data Quality KPIs
Dimension | Metric | How to Measure | Reference Threshold |
|---|---|---|---|
Freshness | Time since latest record | Compare latest write time to SLA window | Defined per critical dataset |
Latency | Percentage of records updated within SLA | Measure records arriving inside the expected window | Defined per pipeline |
Completeness | Missing required fields | Count required fields present per record | Defined per dataset tier |
Validity | Records outside accepted range | Validate type, format, and range at ingest | Defined by business rule |
Validation | Records failing rules | Count rejected or quarantined records | Defined per control |
The rule of thumb is to tie every technical metric to a business consequence. If a revenue table misses its freshness SLA, the problem isn't a yellow icon, it's a missed reporting window. That's how monitoring stays useful instead of decorative.
To keep the program grounded, define the metric, set the threshold, automate the check, and track the result over time. The internal page on data quality metrics is a good starting point for turning that discipline into a repeatable operating pattern.
Common Challenges and Security Considerations
Most real-time quality programs fail because of governance, not detection logic. Thresholds get too aggressive, and alert fatigue sets in. Ownership gets blurry when one incident touches the source team, the platform team, and the business owner at the same time. Then someone buys another tool, and the stack gets harder to manage.
Security gets decided in the architecture, not the policy deck
Regulated teams care about where the checks run. If a vendor requires data to leave the customer environment, that creates a review burden and often a blocker. Running checks in-database, inside the customer's cloud, VPC, or on-premises environment, keeps the quality layer under the same access controls as the warehouse itself.
That also changes the economics of monitoring. Transparent, usage-stable pricing makes it easier to expand coverage without worrying that every new alert or scan turns into a surprise cost. A single shared UI helps too, because engineers, analysts, and governance teams can review the same anomaly, timeliness issue, validation failure, or schema change without passing screenshots around.
The main mistake is treating real-time quality as a niche utility. In practice, it's part of platform observability, business monitoring, and control enforcement at the same time. Teams that centralize those needs usually spend less time reconciling tools and more time fixing the actual data problem.
A Phased Rollout Checklist for Getting Started
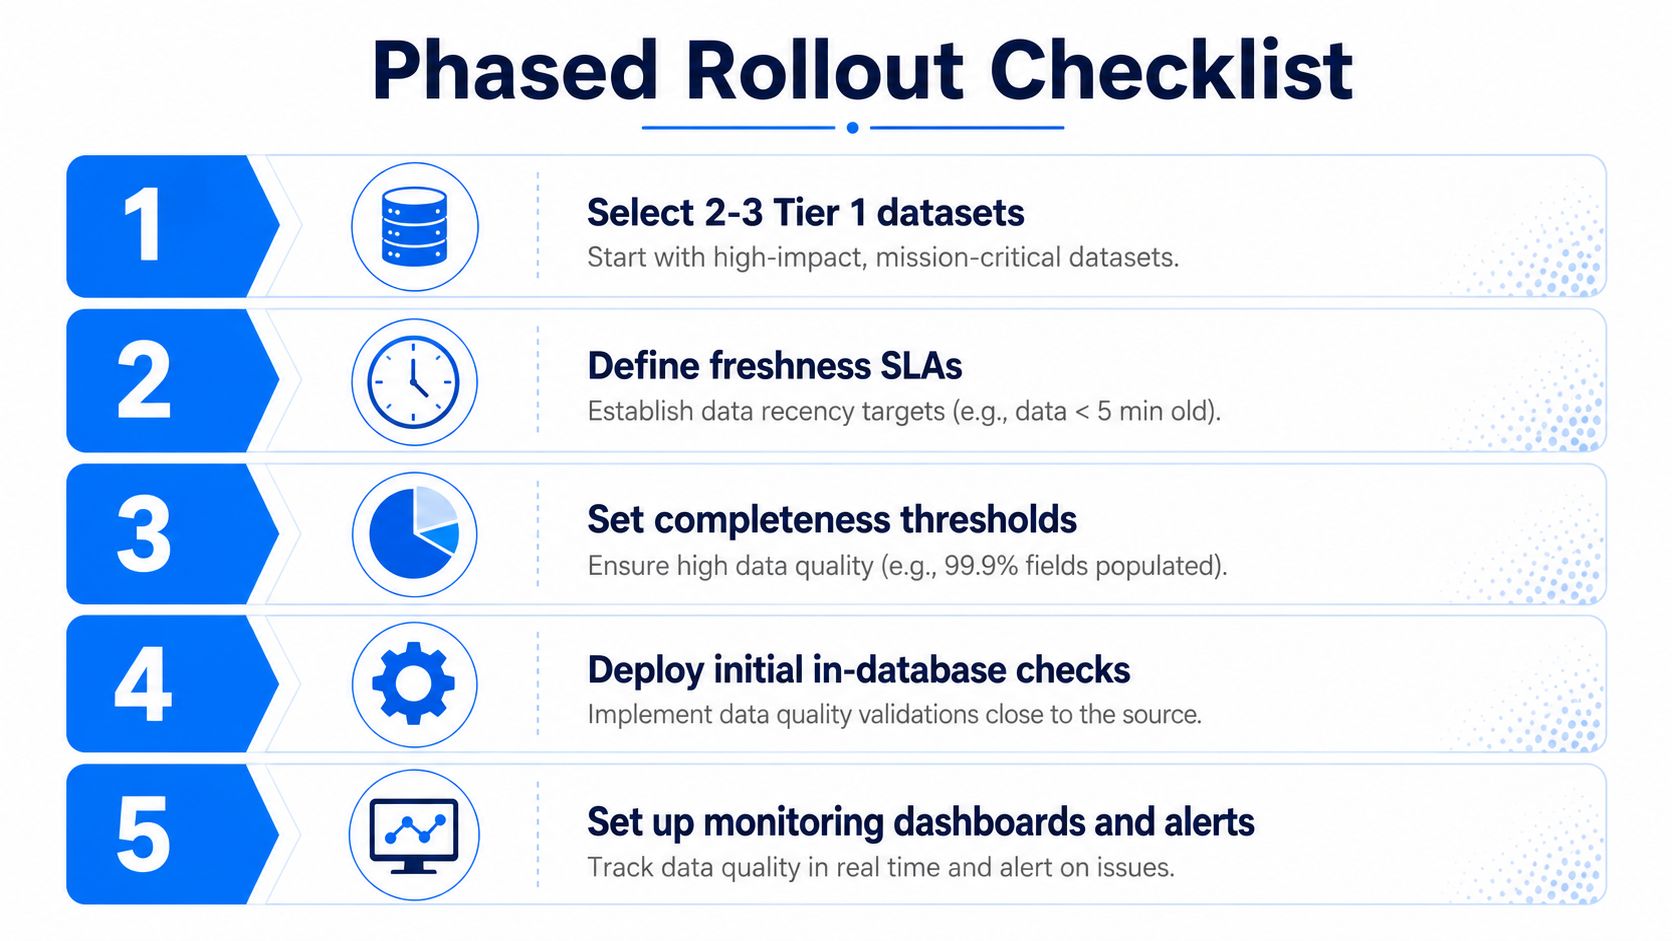
Start small. Pick two or three Tier 1 datasets where stale or invalid data creates obvious business risk. Define freshness and completeness SLAs first, then enable in-database execution so the checks run where the data already lives.
A rollout that doesn't collapse under its own weight
Select the right datasets. Start with tables that directly affect reporting, compliance, or customer workflows.
Define freshness SLAs. Make the acceptable age of the data explicit.
Set completeness thresholds. Decide what “usable” means before the first alert fires.
Deploy initial in-database checks. Catch structural and rule-based defects without adding extra movement.
Turn on monitoring and alerts. Wire incidents into the channels your team already uses.
The mistake to avoid is broad coverage before you've tuned ownership and thresholds. A noisy pilot gets ignored. A focused pilot teaches the team how the controls behave, which is the goal.
If you work in finance, healthcare, telecom, or the public sector, the same pattern applies, just with different controls and reporting obligations. The point is to make trustworthy data the default state of the platform, not a weekly fire drill.
If you're building that operating model and want a platform that keeps checks inside your own environment, supports in-database execution, and brings timeliness, validation, anomaly detection, and schema tracking into one workflow, visit digna. It's built for teams that need real-time data quality to behave like an operating discipline, not a batch job with a shorter interval.
Frequently asked questions
What is real-time data quality?
The discipline of catching failures while the data is still moving, rather than after it has landed. It is not faster batch checking; it is a different operating model, because the window for intervention closes while the stream continues.
What dimension goes missing first in streaming?
Timeliness. When data is continuous, delay stops being a scheduling detail and becomes the defect itself, which is why freshness changes the working definition of quality in a real-time system.
When should delay count as a quality defect?
Whenever the dashboard depends on time-sensitive data. At that point a delay is not a pipeline nuisance to be tolerated but a failure of the data to be what it claims, and it deserves the same treatment as a bad value.
Why does batch quality stop working?
Because its assumptions break. Batch checking is built around a window in which data sits still long enough to be inspected, and once that window disappears the same checks arrive after the decisions they were meant to protect.
What changes in the architecture?
The placement of the control rather than its content. The same freshness, volume, distribution and validity questions apply, but they have to run against a moving stream and produce an answer fast enough to matter.


