Monte Carlo Data Alternative: Enterprise Data Observability by digna
|
7
min. czyt.
A modern data stack can fail in ways that are hard to spot until the damage reaches the business. A dashboard can look healthy while key source records are wrong. A pipeline can finish on schedule while an upstream feed arrives incomplete. A schema update can quietly break a model or report without throwing a visible orchestration error. These are the failures that reduce confidence in data over time.
Table of Contents
digna
Why deployment model matters
What digna monitors
How teams use digna operationally
What to validate before rollout
Enterprise Data Observability with digna
Build a proof of value around real data risk
digna
digna is built for enterprise teams that want data observability to run within their own infrastructure. The platform is designed for deployment inside the customer's environment, including private cloud, VPC, and on-premises setups, and it runs checks in-database so production data stays where it already lives. That approach helps organizations improve visibility into data reliability without creating a separate data movement challenge.
The platform combines several capabilities that address common enterprise failure modes. It includes AI-driven anomaly detection, timeliness monitoring, record-level data validation, continuous schema tracking, and historical analysis for trend review and incident learning. Together, these capabilities help teams detect unusual behavior, catch freshness issues, enforce business rules, and understand how reliability changes over time.

Why deployment model matters
For many enterprise buyers, the first question is not which alert types a platform supports. It is where the platform runs and how it interacts with sensitive data. digna is positioned for organizations that want observability controls to remain aligned with internal architecture, governance policy, and compliance requirements.
That matters in environments where data residency is non-negotiable, where security reviews are extensive, or where stakeholders require strong oversight of operational tooling. When observability runs inside the customer's own environment, teams can evaluate it within the same boundaries they already apply to other critical data systems.
Practical rule: if your organization cares deeply about residency, access control, and deployment boundaries, validate those requirements before comparing feature lists.
This operating model is especially relevant in sectors such as finance, healthcare, telecom, and the public sector, where infrastructure choices often carry governance implications beyond engineering convenience.
What digna monitors
A useful way to understand digna is to look at the kinds of data risk it is built to surface.
Anomaly detection: flags unusual behavior in datasets before downstream users rely on incorrect outputs.
Timeliness monitoring: detects late-arriving loads, stale tables, and freshness issues that disrupt reporting and decision-making.
Data validation: checks records and business rules in place, helping teams catch quality issues close to the data itself.
Schema tracking: identifies structural changes that can break models, dashboards, or integrations.
Historical analysis: gives teams a longer-term view of incidents, recurring patterns, and reliability trends.
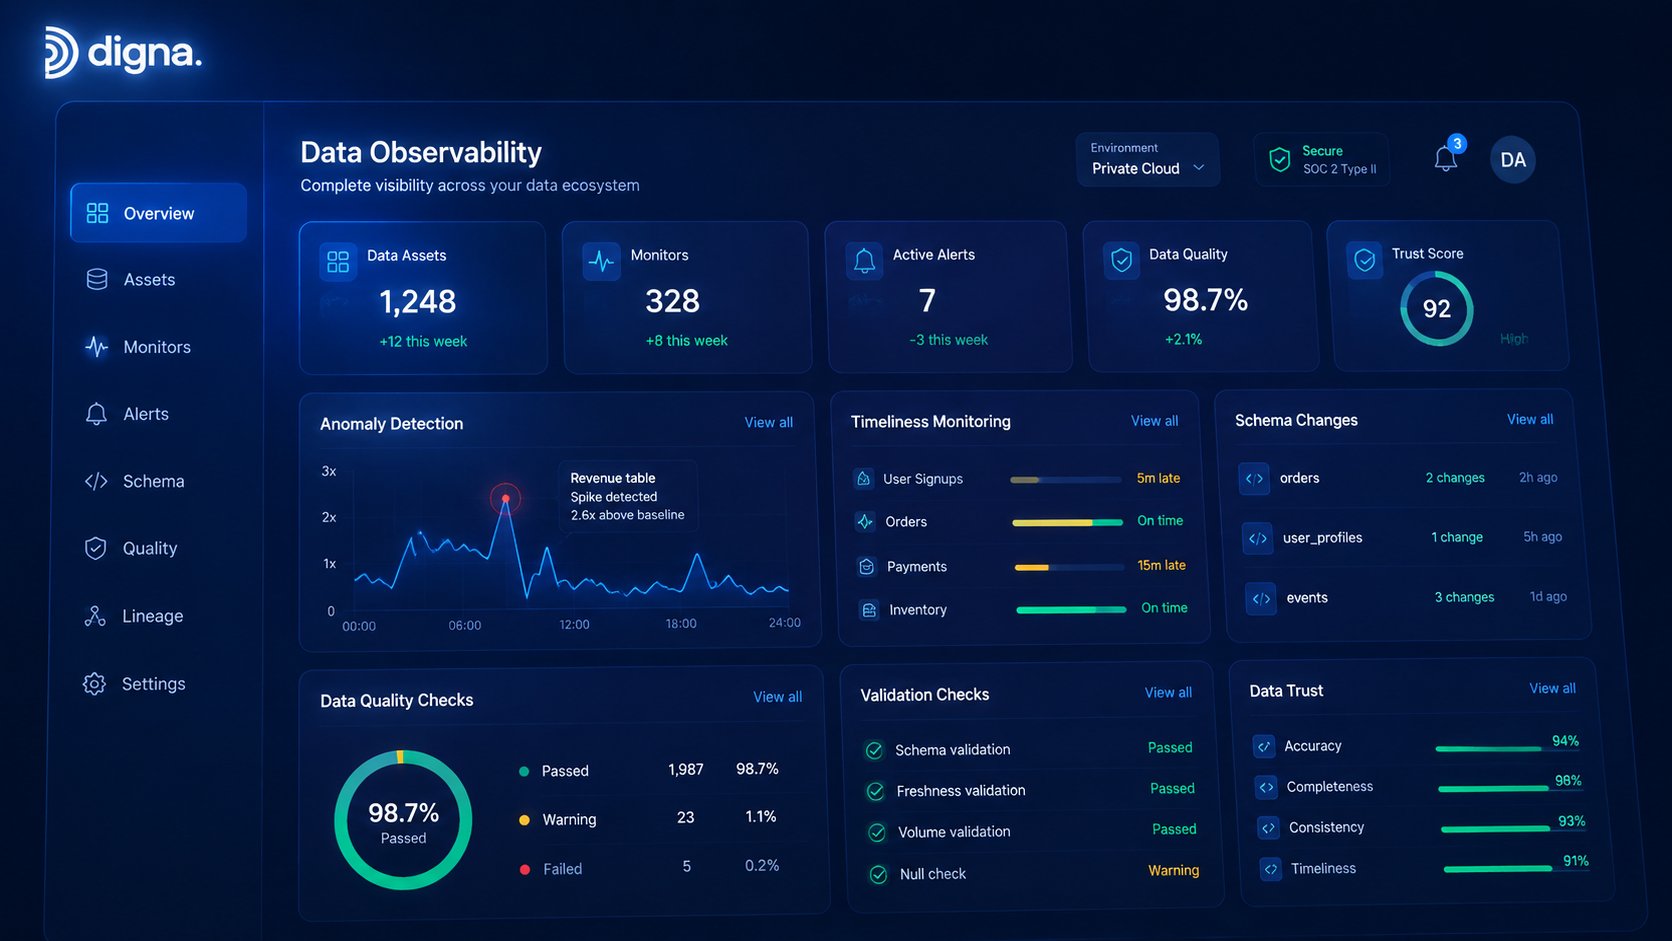
This breadth matters because enterprise data issues rarely appear in only one form. A delayed load may trigger an anomaly. A schema change can cause validation failures. A business rule violation may not appear in a pipeline status page at all. Observability becomes more useful when those risks are monitored in a connected way.
For a closer look at how the platform approaches early issue detection, see how digna spots anomalies early. Teams interested in rule-based controls can also review digna's validation approach, the main Data Observability page, and the overview of data drift detection.
How teams use digna operationally
Observability matters only if it fits the way teams actually work. In practice, that means more than generating alerts. Teams need to know what happened, where it happened, who should investigate, and how to verify that the issue has been resolved.
According to the supplied product description, digna provides a shared interface for engineers, analysts, and stakeholders. That matters because data incidents are often both technical and business-facing. An engineer may need to inspect root cause, while an analytics lead needs to understand reporting impact, and a governance stakeholder may need confirmation that controls are operating as expected.
The platform's modular structure also supports phased adoption. Rather than forcing a full implementation all at once, teams can start with one capability, such as timeliness or validation, then extend coverage as priorities become clearer. This can make rollout easier for organizations that want to prove value on a narrow set of critical assets before expanding further.
What to validate before rollout
A strong evaluation should focus on operational fit, not just a polished demo. Enterprise teams should validate the following points before making a decision:
Environment fit: confirm how digna is deployed in your private cloud, VPC, or on-premises environment.
Data handling: verify that checks run in-database and that production data remains in place.
Coverage fit: map anomaly detection, timeliness, validation, schema tracking, and historical analysis to your actual failure modes.
Workflow fit: test how incidents are viewed and handled by engineers, analysts, and governance stakeholders.
Operational ownership: clarify which setup, maintenance, and tuning tasks stay with your team.
Residency and compliance: confirm alignment with internal security and governance requirements.
Rollout path: determine whether a modular adoption model matches how your organization prefers to implement observability.
If your evaluation includes commercial review, procurement should also clarify how licensing maps to active tables, modules, and ongoing ownership. Public positioning references a base fee plus per active table per module structure, but exact pricing still requires direct confirmation.
Enterprise Data Observability with digna
Area | What digna provides |
|---|---|
Deployment model | Runs inside the customer environment, including private cloud, VPC, and on-premises setups |
Data execution | In-database checks so production data stays in place |
Monitoring coverage | Anomalies, timeliness, validation, schema tracking, and historical analysis |
Team workflow | Shared UI for engineers, analysts, and stakeholders |
Adoption model | Modular rollout by capability rather than all-at-once implementation |
Enterprise fit | Strong fit for organizations with strict governance, residency, and compliance requirements |
The main advantage of this model is alignment. Teams can improve monitoring and data quality coverage without separating observability from the same governance and infrastructure principles that already shape the rest of the data stack.
Build a proof of value around real data risk
The best way to evaluate digna is to start with the datasets that matter most to the business. Choose the tables, feeds, and metrics that create real impact when they fail. Then document the failure modes that matter most, such as delayed loads, schema changes, record-level quality issues, missing data, unusual volume patterns, or broken business rules.
From there, test the actual operating workflow. Ask how an issue is surfaced, what context is available during investigation, how quickly the team can identify root cause, and how the platform helps confirm that the problem has been fixed. A practical proof of value should include at least one known freshness issue, one schema change, one validation failure, and one anomalous pattern so the evaluation reflects real operational conditions.
The most important point is to evaluate digna against your environment, not against an abstract feature checklist. If your architecture requires observability to run within your own boundaries, that requirement should shape the entire selection process from the beginning.
That is the core reason digna stands out for many enterprise teams. It is built for organizations that want data observability and data quality controls inside their own environment, with coverage across anomalies, timeliness, validation, schema tracking, and historical analysis. Teams that want to explore the platform further can review the main site at digna, along with the dedicated Data Observability and Data Validation pages.
If your team is looking for a way to monitor data reliability without compromising governance boundaries, digna offers a practical model to evaluate.




Poznaj zespół tworzący platformę
Zespół z Wiednia, składający się z ekspertów od AI, danych i oprogramowania, wspierany rygorem akademickim i doświadczeniem korporacyjnym.