What Is Data Quality Management: A Practical Guide for 2026
|
9
min di lettura

Data quality management is the continuous practice of measuring, monitoring, and improving the fitness of data across its lifecycle, using dimensions like accuracy, completeness, timeliness, consistency, validity, and uniqueness. In a 2024 industry survey summarized by Precisely, only about 25% of enterprises consistently measure and communicate data quality metrics, and the average maturity score was 56 out of 100, which puts the typical organization at stage 3, Established, out of 5. Precisely's 2024 data quality management trends summary
That gap is easy to recognize if you've ever watched a finance team trust a revenue dashboard that was wrong. A staging schema drops a column, refunds get double-counted, the board gets a bad number, a vendor relationship gets damaged, and three days disappear into reconciliation. The problem wasn't a lack of cleaning effort. It was the absence of a living control system.
Table of Contents
A Working Definition You Can Use Today
Data quality management (DQM) is the continuous practice of ensuring data is fit for use across its lifecycle, combining measurement, monitoring, remediation, and governance. Its goal is to prevent defects before they reach decision-makers and to fix root causes, not just symptoms.
To clarify what DQM is (and isn't), consider these distinctions:
vs. Data Cleansing: Cleansing is reactive, fixing bad records after errors appear. DQM is proactive, building controls to prevent those errors from spreading.
vs. Data Governance: Governance provides the policy and standards. DQM provides the operational execution, checks, alerts, and remediation workflows that enforce those policies.
vs. Data Observability: Observability detects anomalies in schema, volume, and freshness. DQM provides the broader framework that incorporates observability signals into defined business rules and remediation processes.
Practical example: In a finance environment, DQM prevents a reporting failure before it reaches leadership by checking for duplicate keys in transactional data at ingestion. If a duplicate exists, the pipeline halts or flags the record before the ledger is updated, avoiding hours of post-close reconciliation.
For a concise reference on the same operational view, digna's overview of data quality frames the topic clearly. The rest of this guide turns that definition into controls you can run in production.
How We Evaluated Data Quality Management in This Guide
This guide evaluates DQM programs based on five criteria: dimensions covered (accuracy, completeness, timeliness, consistency, validity, uniqueness), lifecycle stages (source, ingestion, staging, transformation, serving), controls considered (prevention, detection, remediation, governance), management versus one-off cleansing, and operational sustainability (owner assignment, escalation paths, SLAs).
I used this lens to structure the article. A program that only cleans data after failures appear is maintenance, not management. A mature program defines quality rules by dimension, assigns ownership, monitors continuously, and reviews performance against business impact. The following framework ties these elements together.
How Data Quality Management Became a Discipline
Data quality used to be treated like janitorial work—something you did after a report looked suspicious. That model breaks down once pipelines multiply, data products cross team boundaries, and every manual fix adds more delay than the issue itself. The industry response has been a shift toward governance, repeatable measurement, and accountability, because the cost of waiting keeps rising.
The economic case for that shift is stark. Poor data quality remains one of the most expensive operational problems in enterprise analytics. Gartner has estimated the average annual cost of poor data quality at about USD 12.9 million per organization, with industry summaries placing the range between USD 9.0 million and USD 15.0 million per year depending on the sector. That figure covers not only IT rework but also missed revenue, bad decisions, compliance penalties, and the labor cost of teams that spend large portions of their time fixing data instead of creating value Actian's data quality cost analysis.
Survey evidence reinforces this gap between intent and execution. In a survey of 825 data and analytics professionals, 75% said data quality is a top goal, yet 39% reported that their organizations do not measure quality across the enterprise. That disconnect is critical—quality cannot improve consistently when it is checked only in isolated projects or after failures appear in dashboards. The same research found that 64% of organizations have an ongoing data governance program, but most struggle to operationalize it at scale Precisely's 2024 data quality management trends summary.
Beyond financial loss, poor data quality consumes specialist time that should be spent on analytics and decision support. One widely cited statistic indicates data professionals spend up to 80% of their time cleaning and preparing data, leaving only 20% for analysis and insight generation. Even conservative estimates point to severe inefficiency—such as 60% of analysts spending more than 60% of their time on preparation work. In business terms, DQM is also a productivity strategy: every hour saved on data preparation is an hour reinvested in value creation Zipdo's data quality statistics.
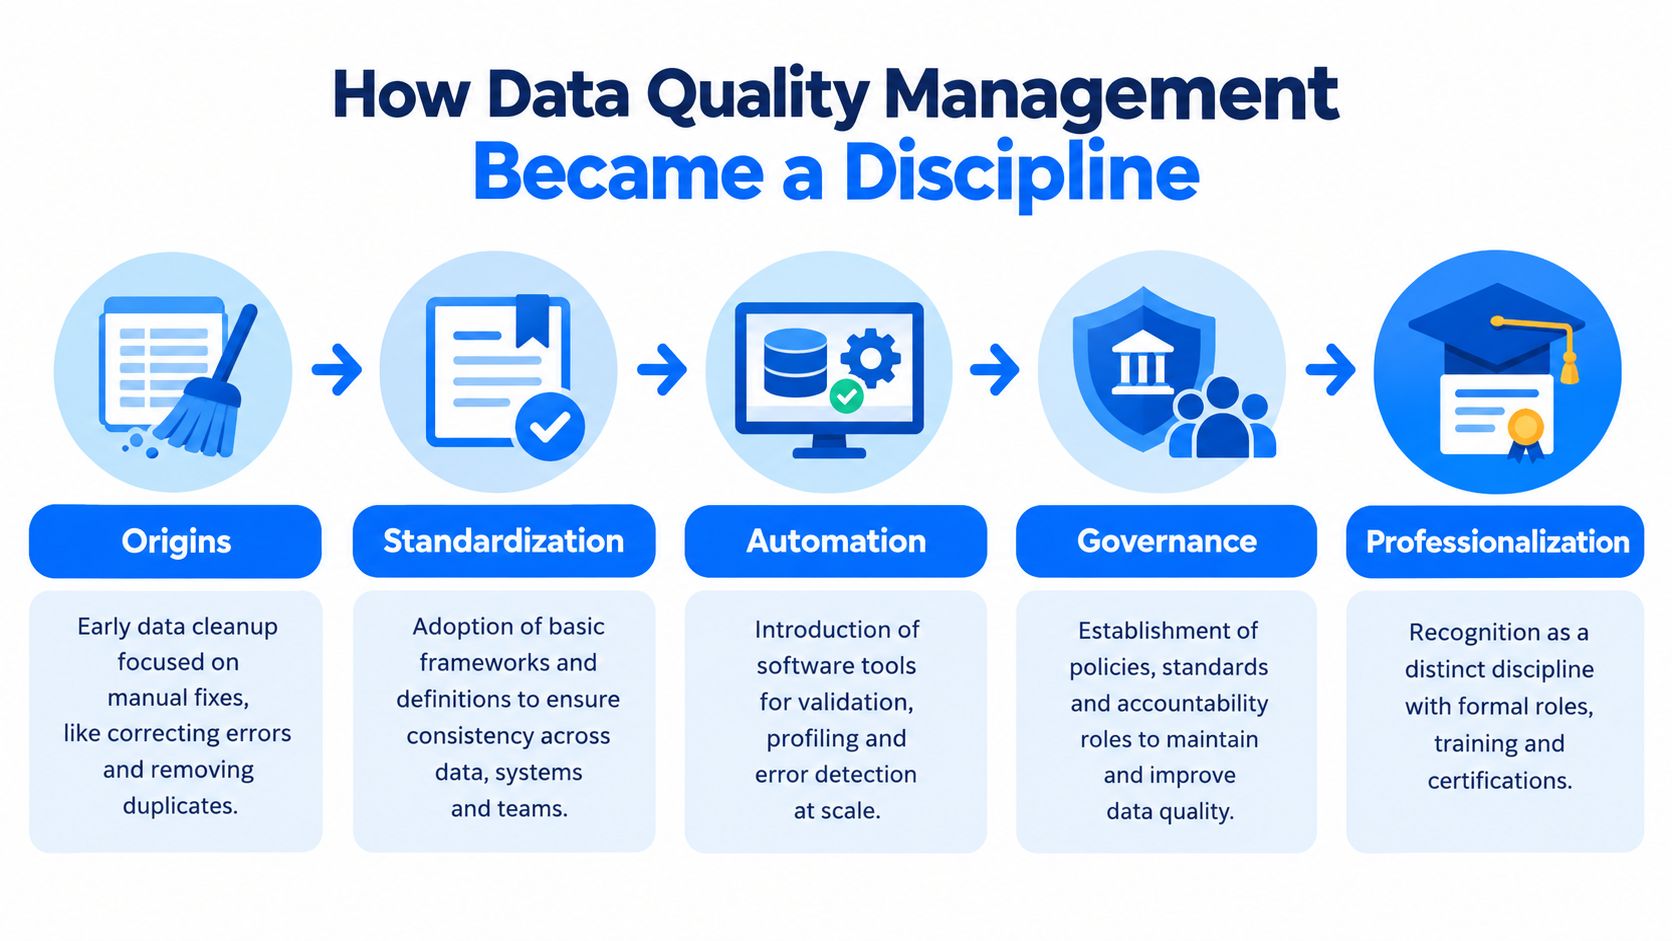
That logic changed DQM from a cleanup task into a lifecycle discipline. Government and industry guidance now treat data quality as something you monitor across acquisition, storage, processing, distribution, and archival, with standards and accountability attached to each handoff. When a schema change, delayed feed, or broken rule can invalidate dashboards and regulatory reports, post-load cleanup isn't enough.
What changed in practice
Reactive cleanup: teams fix visible errors after users complain.
Governed monitoring: teams define controls, ownership, and escalation before defects spread.
Enterprise discipline: teams measure quality, communicate it, and treat drift as an operational risk.
The maturity jump matters because it changes where work happens. Instead of asking analysts to discover bad data, strong programs make quality visible close to the pipeline, where the fix is cheaper and the blast radius is smaller.
Data Quality Management Framework and Dimensions
An effective DQM framework connects dimensions, lifecycle controls, and business impact into a repeatable operating model. Without this structure, quality efforts remain scattered—checking correctness in one place, freshness in another, with no unified view of risk.
Dimension | Typical Owner | Common KPI | Lifecycle Stage |
|---|---|---|---|
Accuracy | Data Steward | % records matching source of truth | Transformation |
Completeness | Data Engineer | % populated required fields | Ingestion |
Timeliness | Data Engineer | % loads within SLA window | Staging/Ingestion |
Consistency | Data Steward | % cross-system reconciled records | Serving |
Validity | Data Engineer | % records conforming to rules | Landing |
Uniqueness | Data Engineer | % duplicate keys detected | Staging |
Some teams use five pillars or the five C's of data quality (correct, complete, consistent, compliant, current). These models overlap significantly with the six-dimension structure used here—the differences are mostly semantic. The six-dimension model is preferred in practice because it separates validity (rule conformance) from accuracy (alignment with reality) and uniqueness (deduplication), which often require different controls.
The Six Dimensions That Define Data Quality
The six dimensions are useful because they map to different failure modes. A dataset can be accurate and still arrive too late, or complete but inconsistent with a downstream system. If you treat quality as one vague score, you miss the actual defect.
Dimension | Failure Mode Example | Operational Check |
|---|---|---|
Accuracy | An address geocoder returns the right city but the wrong ZIP | Reconcile against a trusted source and use field-level validation |
Completeness | A | Required-field check, populated fields divided by required fields |
Timeliness | A daily feed lands after the morning standup, so the SLA is technically met but operationally useless | Freshness monitor against the expected delivery window |
Consistency | The same customer ID maps to different records in CRM and billing | Cross-system reconciliation and referential checks |
Validity | A status enum accepts a typo that should've been rejected | Schema constraint or rule-based validation against allowed values |
Uniqueness | Duplicate rows inflate monthly active user counts | Deduplication rule, key uniqueness constraint, duplicate detection |
How to read the dimensions in production
Accuracy checks whether a value reflects reality. If a geocoder tags the right city but the wrong ZIP, the problem isn't formatting—it's a mismatch between the record and the world object it describes. That usually calls for reconciliation against a source of truth, not a prettier transformation.
Completeness is about whether the data needed for a use case is present. The cleanest operational measure is simple: populated required fields divided by total required fields, which keeps the conversation away from intuition and toward coverage. A deeper breakdown of quality dimensions from BatchData is useful if you want to compare definitions across teams, and digna's dimensions guide is a handy internal reference for implementation teams.
Timeliness has a concrete meaning. Government guidance defines it as the time between the end of the period the data refers to and when it becomes available to meet user needs, and it also says data is timely when it's available when expected and needed. Government guidance on data quality
Validity is rule conformance. It's not a vibe—it's whether a record conforms to a predefined format, type, or business rule. Dagster's data quality dimensions guide is explicit about this, which is why validation rules belong close to the pipeline.
Consistency and uniqueness are where cross-system problems show up. One record might pass local checks and still disagree with billing, while duplicates can inflate totals and confidence at the same time.
The Data Quality Lifecycle From Source to Consumer
A single customer record can tell you where quality work belongs. It starts in a SaaS API, lands in ingestion, moves through staging and transformation, and finally gets served to analysts, applications, and models. Every stage needs a different control, because a defect can be born upstream and only become visible downstream.

Where the gates belong
At landing, schema validation catches breaking shape changes before they spread. In ingestion, freshness checks tell you whether a feed arrived when users expected it, which matters far more than a generic "load succeeded" signal. In staging, completeness audits catch missing required values before transformations make the gaps harder to trace.
At transformation, accuracy reconciliation compares derived data to the source of truth. That's where a broken join, stale reference table, or incorrect business rule usually surfaces. Before serving, consistency rules and uniqueness enforcement prevent contradictory or duplicated records from reaching the consumer layer.
Governance roles slot into those handoffs rather than sitting outside them. A data steward owns definitions and escalation context, an engineer wires checks into the pipeline, and an analyst notices whether the delivered data is fit for the question being asked. digna's data ingestion pipeline overview fits neatly into this pattern because the lifecycle only works when the gates are close to the data, not bolted on afterward.
Data quality gets better when every handoff produces a signal, not just a file.
The most important mental model is that the lifecycle is circular. Consumer-side complaints, dashboard drift, and model errors should feed back into source contracts, not just into a support queue. If the same issue appears twice, the control belongs upstream.
Data Quality Management Meets Observability
DQM and observability are no longer separate conversations. Classic data quality checks focus on known rules, while observability watches runtime behavior for unknown drift, sudden schema changes, odd null-rate shifts, and freshness failures. The overlap is where modern platforms make the biggest difference.
The useful split is straightforward. Validation tells you whether a record meets a business rule. Observability tells you whether the dataset's behavior has changed in a way that deserves attention. A platform that does both can catch a bad status code, a late partition, and a sudden row-count swing without forcing every team to handcraft the same control set.
What to monitor and how to execute it
Dimension | Observability signal | Execution pattern |
|---|---|---|
Accuracy | Reconciliation drift, mismatched reference values | In-database checks at transformation boundaries |
Completeness | Null-rate spike, missing required columns | Statistical profiling on landing tables |
Consistency | Cross-system mismatch, lineage impact | Lineage-linked rule checks routed to owners |
Timeliness | Late arrival, missing load, early delivery | Freshness monitor against learned schedules |
Validity | Format violations, invalid enums, range breaches | Deterministic validation in warehouse or pipeline |
Uniqueness | Duplicate-key growth, repeated records | Deduplication checks before serving |
A platform like digna's data observability module makes sense in this model because it combines anomaly detection, timeliness monitoring, schema tracking, and validation in one operational flow. For additional best practices on implementing observability at scale, see the Data Observability Best Practices guide via Kagool.
The architecture choice matters too. Running checks in-database keeps data in place, reduces movement, and works better for privacy-sensitive workloads than pulling samples out to a separate tool.
The trade-off is real. Sample-based checks are easier to start, but they can miss edge cases and create blind spots in high-volume pipelines. In-database execution is better when you care about freshness, data residency, or not duplicating sensitive records outside the warehouse boundary.
Implementing Data Quality Management in Practice
A DQM rollout works best when it starts narrow and earns trust. The first target should be the top revenue-critical datasets—the ones that feed executive dashboards, billing, risk, customer reporting, or models that people act on quickly. Broad coverage sounds impressive, but it usually turns into noisy alerts and a half-finished control library.
A rollout pattern that doesn't stall
Define critical data products. Start where a defect would hurt the business, not where the table is easiest to test.
Set quality rules by dimension. Don't apply every check everywhere. A transactional feed might care more about timeliness and uniqueness, while a reference dataset may need tighter consistency and validity rules.
Assign owners and escalation paths. Every rule needs a human accountable for response.
Monitor continuously. Checks must run automatically at each lifecycle stage, not just on demand.
Triage incidents and remediate root causes. Block resolution without addressing why the defect occurred.
Review performance against SLAs. Measure time to detection, time to resolution, and escaped-defect rate.
Practical example: For a finance dataset, I'd introduce timeliness and uniqueness checks first—these catch the most common errors early. After two weeks, I'd add accuracy reconciliation against the general ledger. Success is measured by reduced manual reconciliation time and fewer board-report corrections.
The architecture choices that pay off
The strongest pattern is to co-locate checks with the warehouse or lakehouse so quality signals are computed where the data already lives. That keeps latency down and avoids extra movement. For distributions that shift over time, anomaly detection usually works better than static rules, because real data doesn't sit still long enough for fixed thresholds to stay useful.
Schema tracking should sit beside both of those controls. Upstream teams change column names, types, and shapes more often than they realize, and that's how downstream jobs fail without a visible incident in the source system. digna's implementation approach aligns with this pattern because it treats monitoring, validation, and schema drift as one operating model instead of three separate tools.
The goal isn't more checks. It's fewer surprises with clearer ownership.
Review false positives on a regular cadence. If the team ignores half the alerts, the program has already lost credibility. Good quality engineering creates a loop where rules are tuned, owners are clear, and each incident improves the next release.
Common Pitfalls and Best Practices That Actually Work
Most DQM programs don't fail because the team lacks tools. They fail because the program becomes an alert factory. If every anomaly pages someone, regardless of severity or ownership, the first month is noisy and the second month is ignored.
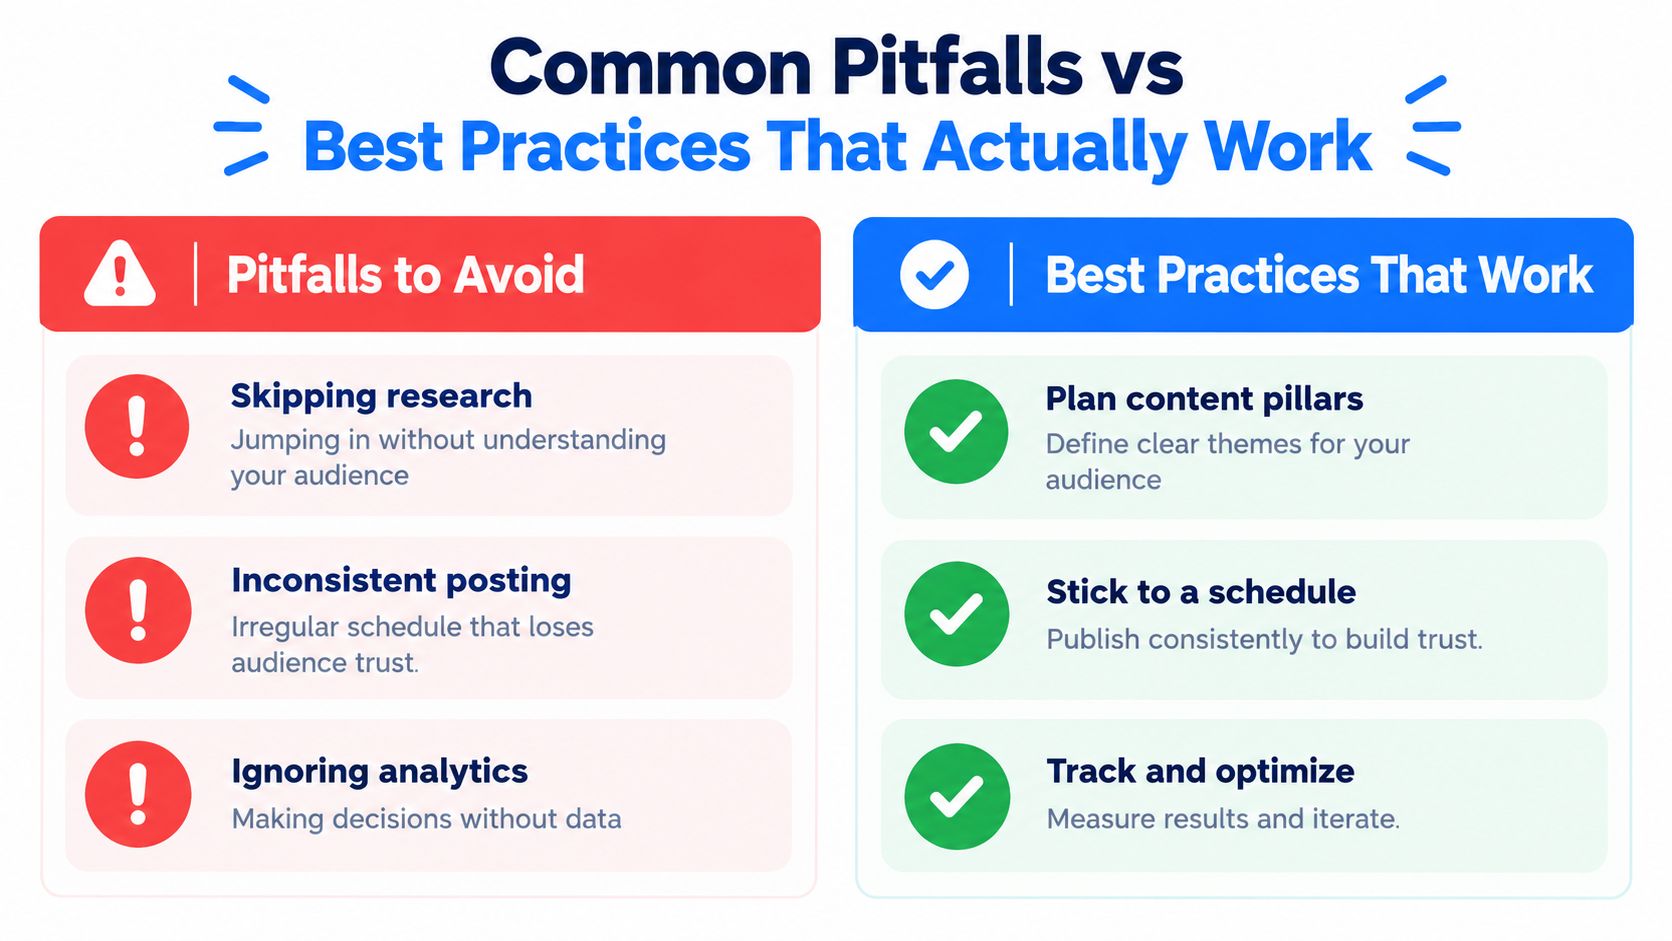
Another common mistake is measuring only row counts. A table can have the right volume and still contain plausible but wrong values, late records, or conflicting definitions. The defect stays hidden because the metric was too blunt to catch it.
What to avoid
Alerting on everything: if severity and ownership are missing, people stop caring.
Starting with every table: broad coverage without business priority creates noise.
Using copied thresholds: what works for one dataset can be wrong for another.
Treating cleansing as the whole answer: prevention matters more than after-the-fact cleanup.
Letting scores become gospel: a quality score without context can hide the true failure mode.
What actually holds up
Sustainable programs focus on critical data products, not the entire warehouse. They define service-level objectives, route failures to accountable owners, and review outcomes with domain stewards so the controls reflect the business, not just the schema. They also track the things that matter operationally, like escaped-defect rate, incident volume, time to detection, time to resolution, freshness compliance, and affected downstream records.
I've seen the biggest improvement come from versioning rules, documenting known exceptions, and removing checks that never trigger action. That keeps the system honest. The right balance is prevention at ingestion plus detection through transformation and delivery, because no single layer catches everything.
Frequently Asked Questions About Data Quality Management
How is DQM different from data cleansing? Cleansing fixes a specific bad record set. DQM sets up continuous controls for prevention, detection, measurement, ownership, and remediation across the lifecycle. One is a repair task, the other is an operating model.
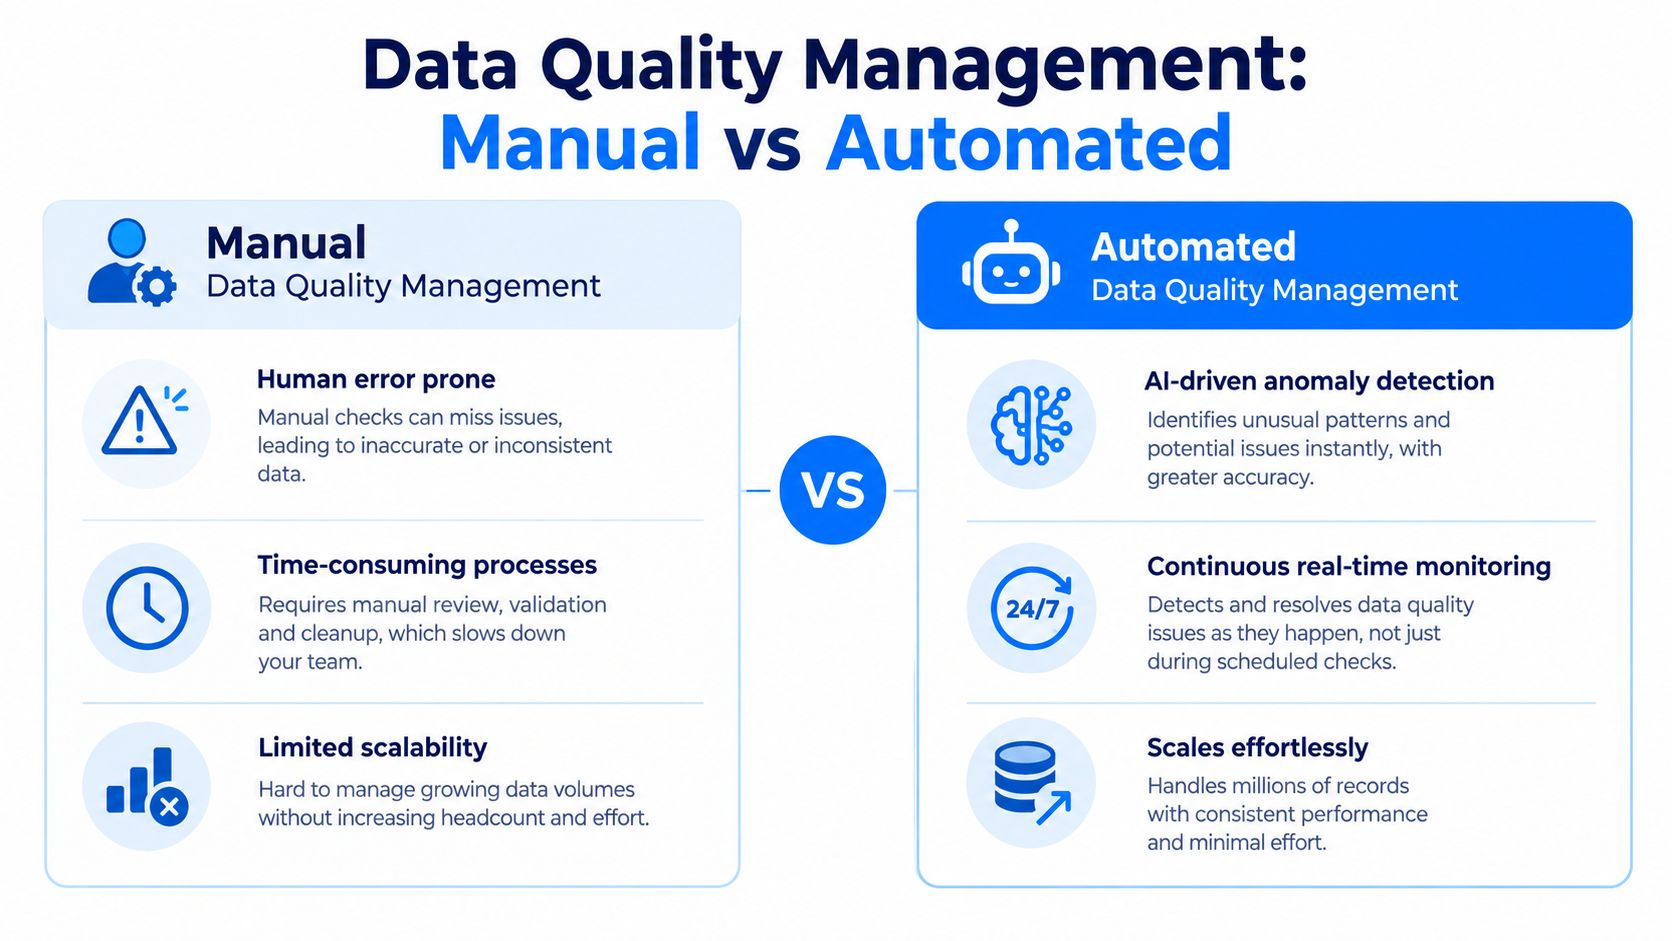
How does DQM relate to data governance? Governance defines the policies, standards, and escalation paths. DQM provides the checks, metrics, and workflows that enforce those rules in production.
Who owns data quality? Stewardship and quality engineering do a lot of the daily work, but the accountable owner is usually the domain or data-product owner. Platform teams should provide reusable tooling, and source-system owners should own root causes that start upstream.
How should ROI be measured? Start with a baseline for defects, incidents, manual effort, and business impact, then track reduced rework, faster detection, faster recovery, fewer downstream failures, and better reuse. If you can tie a saved incident to an automated control, do it. If you can't, keep the measurement honest and qualitative rather than inventing a number.
The simplest way to start is still the best one. Pick one business-critical dataset, define fitness-for-purpose rules, put checks where data enters and changes, assign response owners, and expand only after the first workflow proves value. That keeps DQM grounded in operations instead of turning it into slideware.
If you're building a data quality program that has to work inside real pipelines, digna gives teams a way to run validation, anomaly detection, timeliness monitoring, and schema tracking in their own environment. Visit digna if you want a platform built around in-database controls, private deployment, and production monitoring instead of after-the-fact cleanup.
Frequently asked questions
What is the working definition of DQM?
Prevention, detection and remediation across the data lifecycle. That three-part definition is more usable than a list of dimensions, because it names the three places a control can sit rather than the properties it measures.
How mature is the typical organization?
In a 2024 survey summarized by Precisely, only about 25% of enterprises consistently measure and communicate data quality metrics, and the average maturity score was 56 out of 100, putting the typical organization at stage 3 of 5, Established.
When is a quality process too late?
When a data issue can only be fixed by hand after consumers notice it. At that point the process is documenting failures rather than preventing them, whatever its stated coverage.
What is the economic case for the shift?
MIT Sloan Management Review reported estimates that bad data can consume 15% to 25% of revenue for most companies. Numbers at that scale are what moved DQM from a cleanup task into a lifecycle discipline.
What are the three stages of practice?
Reactive cleanup, where teams fix visible errors after users complain; governed monitoring, where teams define controls, ownership and escalation before defects spread; and enterprise discipline, where teams measure quality, communicate it and treat drift as an operational risk.
✦ Generated with Artifical Intelligence



