KPI Monitoring Process: A Complete Step-by-Step Guide
|
6
min di lettura

At 9 AM, a stakeholder calls because the revenue dashboard is up 15%. The team celebrates briefly, then someone checks the transaction feed and finds that the pipeline loaded late and omitted the most recent two days. The KPI didn't reveal stronger performance. It reflected incomplete data.
This is why a reliable KPI monitoring process must monitor more than metric values. It needs to determine whether the data is fresh, complete, structurally valid, and fit for interpretation. A dashboard can be visually polished and still give decision-makers false confidence.
Table of Contents
Why Your KPI Dashboard Is Lying to You
The Six Stages of a KPI Monitoring Process
Define the decision and owner
Establish a representative baseline
Validate lineage before interpreting movement
Calculate at the authoritative source
Detect limits and unusual behavior
Route, resolve, and improve alerts
Separating Business Performance from Data Fitness
Use two alert paths
Make the result auditable
Traditional Rules versus AI-Driven Anomaly Detection
Where deterministic rules work
Where adaptive detection helps
Roles Responsibilities and Operational Practices
Assign responsibilities explicitly
Set cadence by actionability
Common Mistakes and How to Avoid Them
Common failure patterns
Building Your KPI Monitoring Strategy with digna
Why Your KPI Dashboard Is Lying to You
The failure usually starts with a reasonable design. An analytics engineer defines revenue, connects the calculation to a warehouse table, adds a target line, and publishes the result in Power BI or another BI platform. The dashboard refresh succeeds from the reporting tool's perspective, but the upstream transaction load arrived late or contained only part of the expected data.
The stakeholder sees a positive movement. The data engineer sees a delivery incident. Both are looking at the same KPI, but only one has the context needed to interpret it.

Practical rule: Never treat a KPI value as trustworthy until its freshness, completeness, lineage, and validation status are available beside it.
Traditional monitoring often watches only the final number. A threshold might alert when revenue falls below a fixed target, but it won't necessarily flag a delayed load, a missing partition, a changed column type, or a partial extract. Teams then receive alerts that don't explain whether the business changed or the measurement failed.
That distinction affects every operational response. A genuine decline may require a commercial investigation. A late dataset requires pipeline remediation. A schema change may require transformation updates. If the monitoring process sends the same alert for all three, ownership becomes unclear and responders waste time diagnosing the wrong problem.
Dashboards still matter, especially when teams need to create actionable Power BI visuals. But visualization is the final layer, not the monitoring system itself. The underlying process must connect the displayed KPI to the data conditions that produced it.
A practical KPI monitoring dashboard should therefore show the business signal and the evidence supporting its validity. That means recording expected and actual delivery times, row counts, validation outcomes, schema versions, and computation status. Without those controls, a green dashboard can only mean that the dashboard rendered successfully.
The Six Stages of a KPI Monitoring Process
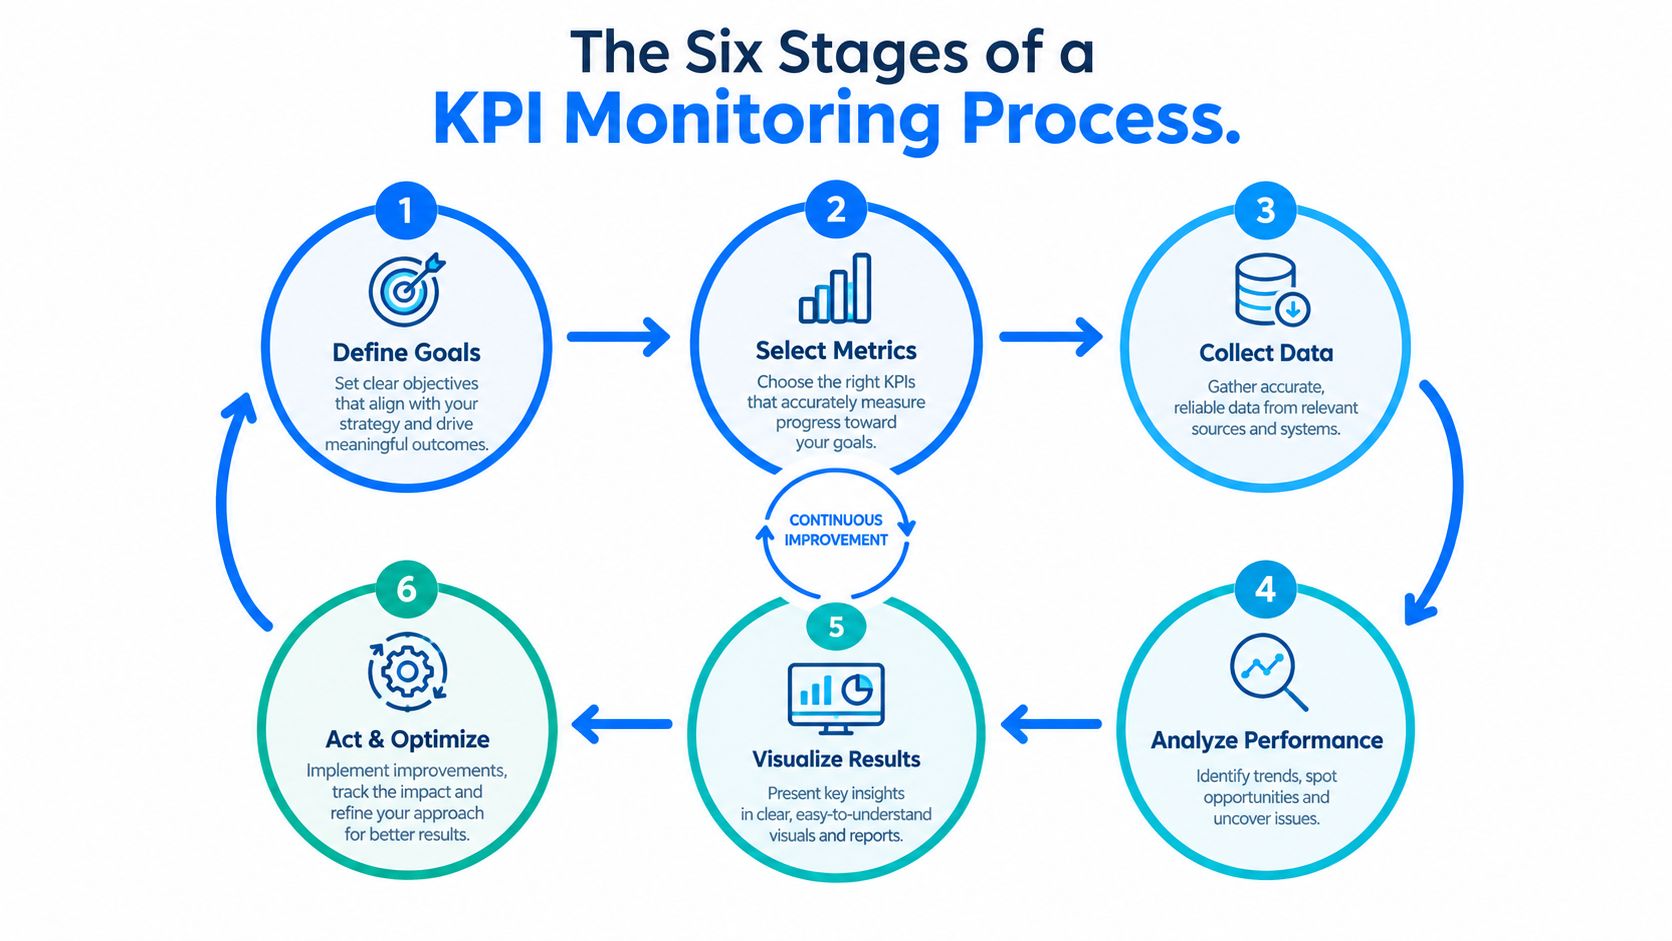
A defensible process is a closed loop. The detailed operating model includes eight distinct stages, from defining the decision and owner through reviewing thresholds against false positives and changing conditions, as described in the NIST AI Risk Management Framework Playbook. In practice, those activities can be organized into six implementation stages that teams can operate day to day.
Define the decision and owner
Start with the decision, not the chart. Write down what action the KPI should influence, who owns the outcome, and who investigates a deviation. Define the numerator, denominator, calculation grain, filters, freshness expectation, acceptable operating range, and escalation path.
A financial services team might assign a settlement-volume KPI to an operations owner, while a healthcare organization might assign a claims-completeness KPI to a data governance owner. In both cases, the owner needs enough semantic detail to determine whether a movement is meaningful.
Establish a representative baseline
A target isn't the same as a baseline. Build historical behavior from representative periods and separate normal seasonality, calendar effects, promotions, planned maintenance, and known outages from genuine changes. A fixed limit may be useful for a hard compliance boundary, but it won't describe normal variation.
Validate lineage before interpreting movement
Check that the source tables, transformations, joins, filters, and delivery jobs are operating as expected. A KPI should carry lineage back to its authoritative source, along with validation results and data-fitness status. If the source is incomplete, label or suppress the business result rather than presenting it as current.
Calculate at the authoritative source
Calculation in-database reduces unnecessary movement and keeps logic close to governed data. It also makes the computation easier to audit because the team can associate the result with the source timestamp, query version, schema state, and validation outcome.
Detect limits and unusual behavior
Use deterministic checks for defined boundaries and integrity failures. Add statistical monitoring for unusual levels, rate-of-change shifts, volatility, and distribution changes. The combination catches both known violations and behavior that doesn't fit the historical baseline.
Route, resolve, and improve alerts
Send alerts by severity to an accountable owner. A sustained low-severity deviation may create a ticket, while a severe integrity failure can require immediate paging. Every alert should include a runbook, suppression window, escalation path, diagnosis, remediation, and business impact.
The process only becomes reliable when teams review its performance. Track false positives, missed incidents, detection time, acknowledgement time, and remediation time, then recalibrate thresholds when operating conditions change.
Separating Business Performance from Data Fitness
A business-performance alert answers, “Did the business behave differently?” A data-fitness alert answers, “Can we trust the measurement?” Those questions are related, but they shouldn't share the same status or response.
A major gap in KPI-monitoring guidance is that it explains metric selection without specifying how to operate when the underlying data is late, incomplete, or structurally changed. Conventional advice often matches monitoring frequency to actionability, but it rarely defines what happens when a scheduled refresh misses its arrival window or when a column is added, removed, or retyped, as described in this KPI design guide.
Use two alert paths
Suppose a telecommunications KPI shows a sudden decline in customer activity. There are at least two plausible explanations:
Business signal: Customer behavior changed, so the commercial or operations team should investigate.
Delivery signal: The latest event partition is missing, so the data platform team should repair the load.
Structural signal: A source column changed type or disappeared, so the transformation and governance owners should assess impact.
A single red tile can't distinguish these cases. The system should attach freshness, completeness, schema, and validation status to the KPI calculation. If the data arrived late, the result can be marked affected and the business alert suppressed until the source is healthy.
Make the result auditable
Every KPI run should retain its data timestamp, expected-versus-actual delivery time, row count, schema version, computation status, threshold version, and incident identifier. These fields let an analyst explain why a value changed without reconstructing the entire pipeline history during an incident.
The distinction is especially important in healthcare and the public sector, where an apparently current report can influence operational or regulatory decisions. A result that reflects partial data shouldn't look identical to a result produced from a complete, validated load.
digna's data quality observability approach reflects this operating model by connecting business metrics with checks for timeliness, validation, anomalies, and schema changes inside the customer's data environment. The practical benefit isn't another dashboard. It's a clearer answer to the first question responders should ask: is the KPI movement real, or did the measurement become unfit?
Traditional Rules versus AI-Driven Anomaly Detection
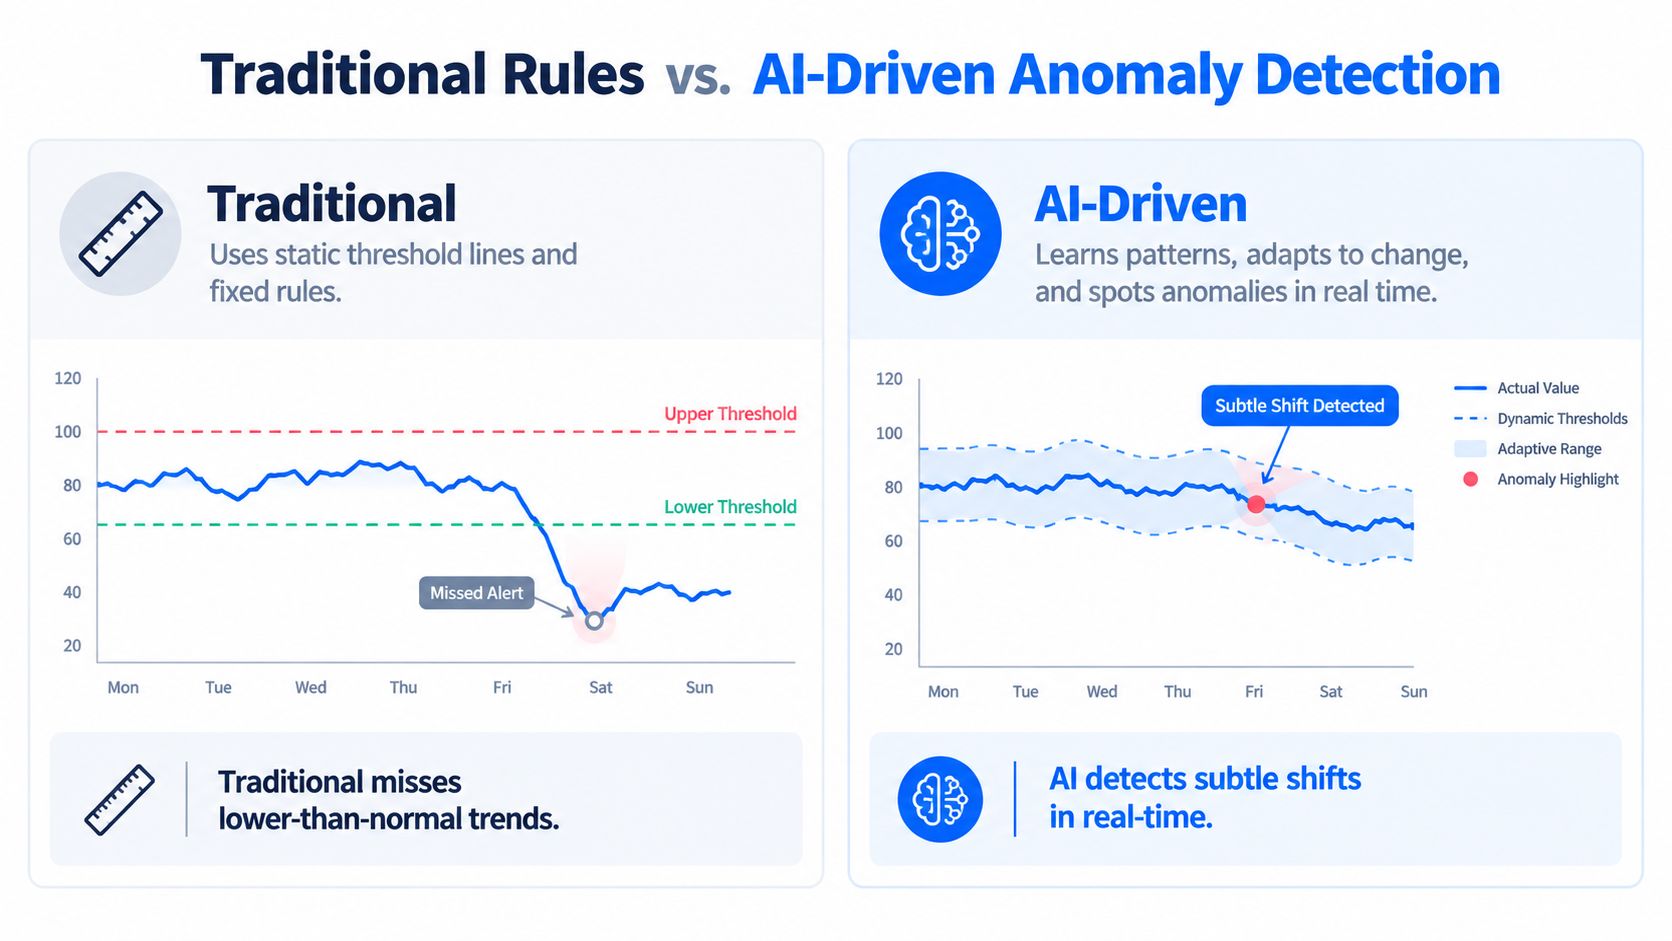
A fixed threshold can protect a clear business boundary, such as alerting when transactions fall below an approved limit. It cannot describe every normal operating condition. Weekends, seasonal demand, low-traffic periods, gradual drift, and changing volatility can all make the same threshold misleading.
That creates two operational failures. A sensitive threshold produces noise, while a broad threshold misses a meaningful decline. Teams begin optimizing alert volume instead of decision quality, a problem discussed in this guidance on monitoring SRE golden signals.
Where deterministic rules work
Deterministic controls fit conditions that are explicit and testable:
Null checks: Required fields must contain values.
Uniqueness checks: Identifiers should not duplicate within the defined grain.
Referential-integrity checks: Child records must map to valid parent records.
Schema checks: Required columns and data types must remain compatible.
Freshness checks: Expected data must arrive within its defined delivery window.
Limit checks: A regulated or operational boundary must not be exceeded.
These checks are transparent, explainable, and easy to connect to a runbook. Replacing them with anomaly detection would weaken controls where the expected condition is already known.
Where adaptive detection helps
Statistical monitoring compares current behavior with a dataset's own history. The overview of types of anomaly detection describes how this approach can identify an unexpected level, rate of change, volatility pattern, or distribution shift without requiring engineers to encode every normal condition manually. It is useful when a metric changes during low-traffic periods or drifts before crossing a fixed limit.
digna's Data Anomalies module applies AI-driven baseline learning and continuous anomaly detection without manual rule setup. Its in-database execution keeps calculations inside the customer's environment, reducing data movement and avoiding vendor access to production data. That design also helps connect a business-metric alert with the underlying data fitness issue instead of treating the KPI as an isolated signal.
Use a hybrid model. Deterministic rules should enforce known contracts and compliance conditions, while adaptive monitoring should cover behavior that no single threshold can represent. Send both alert types through the same incident workflow, but retain the detection method, evidence, and affected KPI so responders can distinguish a genuine business change from a measurement problem.
Roles Responsibilities and Operational Practices
A KPI monitoring process fails when ownership stops at the dashboard. Data engineers maintain delivery and computation, analytics engineers protect semantic accuracy, governance teams define quality expectations, and business owners decide what action a change requires.
NIST recommends selecting metrics that provide meaningful indications of status at relevant levels, defining monitoring and control-assessment frequencies, and automating collection, analysis, and reporting where possible, as outlined in its continuous monitoring publication.
Assign responsibilities explicitly
The data engineer owns pipeline health, delivery schedules, source changes, and recovery procedures. The analytics engineer owns KPI definitions, joins, filters, aggregation logic, and dashboard correctness. The governance or data quality team defines validation rules, evidence requirements, and acceptable data conditions.
The business owner interprets the KPI and decides what should happen when it deviates. That person might approve a commercial response, accept a known exception, or escalate an operational incident. A shared data quality roles and responsibilities model helps prevent the common situation where everyone receives an alert but nobody owns the decision.
Set cadence by actionability
High-volatility operational indicators may need frequent evaluation, while slower strategic measures can be reviewed less often. The important point is to record the cadence explicitly, including the measurement interval, expected update schedule, timestamp, and recipient group.
Every run should carry:
Delivery metadata: Expected and actual arrival times.
Data evidence: Row count, source timestamp, and completeness status.
Technical context: Schema version and computation status.
Control context: Threshold version and validation outcome.
Operational trace: Incident identifier, owner, and resolution state.
Before enabling a production alert, require a severity, runbook, suppression window, owner, and escalation path. Automation should collect and analyze evidence, but people must remain accountable for judgment and remediation.
Common Mistakes and How to Avoid Them
More alerts don't mean better monitoring. If every small deviation generates a notification, responders learn to dismiss the channel, and a material incident can disappear among routine warnings.
The most damaging mistake is optimizing for alert volume rather than decision quality. Measure whether alerts lead to action using precision, incident coverage or recall, mean time to detect, mean time to acknowledge, and mean time to remediate. A quiet alerting system may be healthy, or it may be missing incidents. You need evidence.
Common failure patterns
Alert fatigue: Too many notifications train teams to ignore alerts. Combine severity levels, suppress duplicates during known maintenance windows, and send only actionable events.
Vanity metrics: A metric can look impressive while failing to support a decision. Tie each KPI to a business objective and identify the action that follows a meaningful change.
No ownership: An alert without a named responder becomes shared background noise. Assign one accountable owner, even when several teams contribute to diagnosis.
Static thresholds: Fixed limits miss seasonality, off-peak failures, and gradual drift. Pair boundaries with baseline-aware monitoring.
Unverified data: A KPI can move because the source is late or incomplete. Keep data-fitness status beside the business value and separate the response paths.
Every alert needs a predefined response before production activation. If the team can't explain who investigates, what evidence they need, how long suppression lasts, and when escalation occurs, the alert isn't operationally ready.
Building Your KPI Monitoring Strategy with digna
Start with the KPIs that drive real decisions, not every metric available in the warehouse. Define owners and calculation logic, establish representative baselines, validate lineage, attach data-fitness metadata, and combine fixed controls with adaptive anomaly detection.
A practical rollout can begin with one critical dataset or business domain. Then add timeliness monitoring for delivery risk, validation for business rules, schema tracking for structural change, and platform observability where workload or performance affects reporting. The KPI monitoring tools should fit the operating model rather than force every team into the same alerting pattern.
digna runs inside the customer's own environment, with checks executed in-database across warehouses, lakes, and pipelines. Teams can use its modular licensing approach to start with a single module and expand, while the Python SDK supports programmatic integration into existing workflows. A shared user-centric dashboard gives data engineers, analysts, and stakeholders one place to review incidents, trends, and status.
The strongest implementation connects metric design to collection, interpretation, escalation, and remediation. With digna, teams can move from installation to initial insights in under two hours, then refine thresholds and workflows as they learn how their data behaves in production.
digna connects business KPI monitoring with data quality, timeliness, validation, anomaly detection, and schema tracking inside your own environment. Visit digna to see how you can build an auditable monitoring process that distinguishes genuine performance changes from unreliable data.
To put a number on what a late or incomplete KPI feed actually costs the business, run your own figures through the data downtime cost calculator before you decide how much monitoring each metric deserves.
Frequently asked questions
What is a KPI monitoring process?
A closed loop that defines each KPI's decision and owner, establishes a representative baseline, validates lineage, calculates at the authoritative source, detects limits and unusual behaviour, and routes alerts to an accountable person. The point is to know both what the metric says and whether the data behind it can be trusted.
Why can a KPI dashboard show misleading numbers?
The reporting tool can refresh successfully while the upstream load arrived late or only partly. In the post's example, revenue looked 15% higher because the pipeline omitted the most recent two days of transactions. Without freshness and completeness checks, incomplete data looks exactly like stronger business performance.
What is the difference between a business alert and a data-fitness alert?
A business-performance alert asks whether the business behaved differently, so the commercial or operations owner investigates. A data-fitness alert asks whether the measurement can be trusted, so the data platform team repairs a missing partition or a changed schema. Keeping two alert paths sends each problem to the right team.
Should KPI monitoring use fixed thresholds or anomaly detection?
Both. Fixed thresholds suit hard, explicit boundaries such as null checks, uniqueness, referential integrity, schema compatibility and delivery windows. Adaptive anomaly detection compares a metric with its own history, so it catches unusual levels, rate-of-change shifts and drift that a single static limit would either miss or flag as noise.
Who should own KPI monitoring?
Ownership is split. Data engineers own pipeline health and delivery schedules, analytics engineers own KPI definitions and dashboard logic, governance teams set validation rules and evidence requirements, and the business owner decides what action a deviation needs. A KPI without a named responder tends to become everyone's problem and nobody's task.


