Data Quality Assessment Definition: A Practical Guide
|
7
min di lettura

A data quality assessment is a systematic process that measures fitness for use across multiple dimensions, including accuracy, completeness, timeliness, consistency, and lineage, rather than a single accuracy check. The modern idea grew from the 1996 “fitness for use” definition and now includes structured frameworks such as the IMF's six-part assessment model.
The popular advice is to clean the data, count the nulls, and move on. That approach breaks down as soon as a technically valid dataset arrives late, uses conflicting business definitions, or loses its traceability before reaching an analytics or machine learning workload.
Table of Contents
Rethinking the Data Quality Assessment Definition
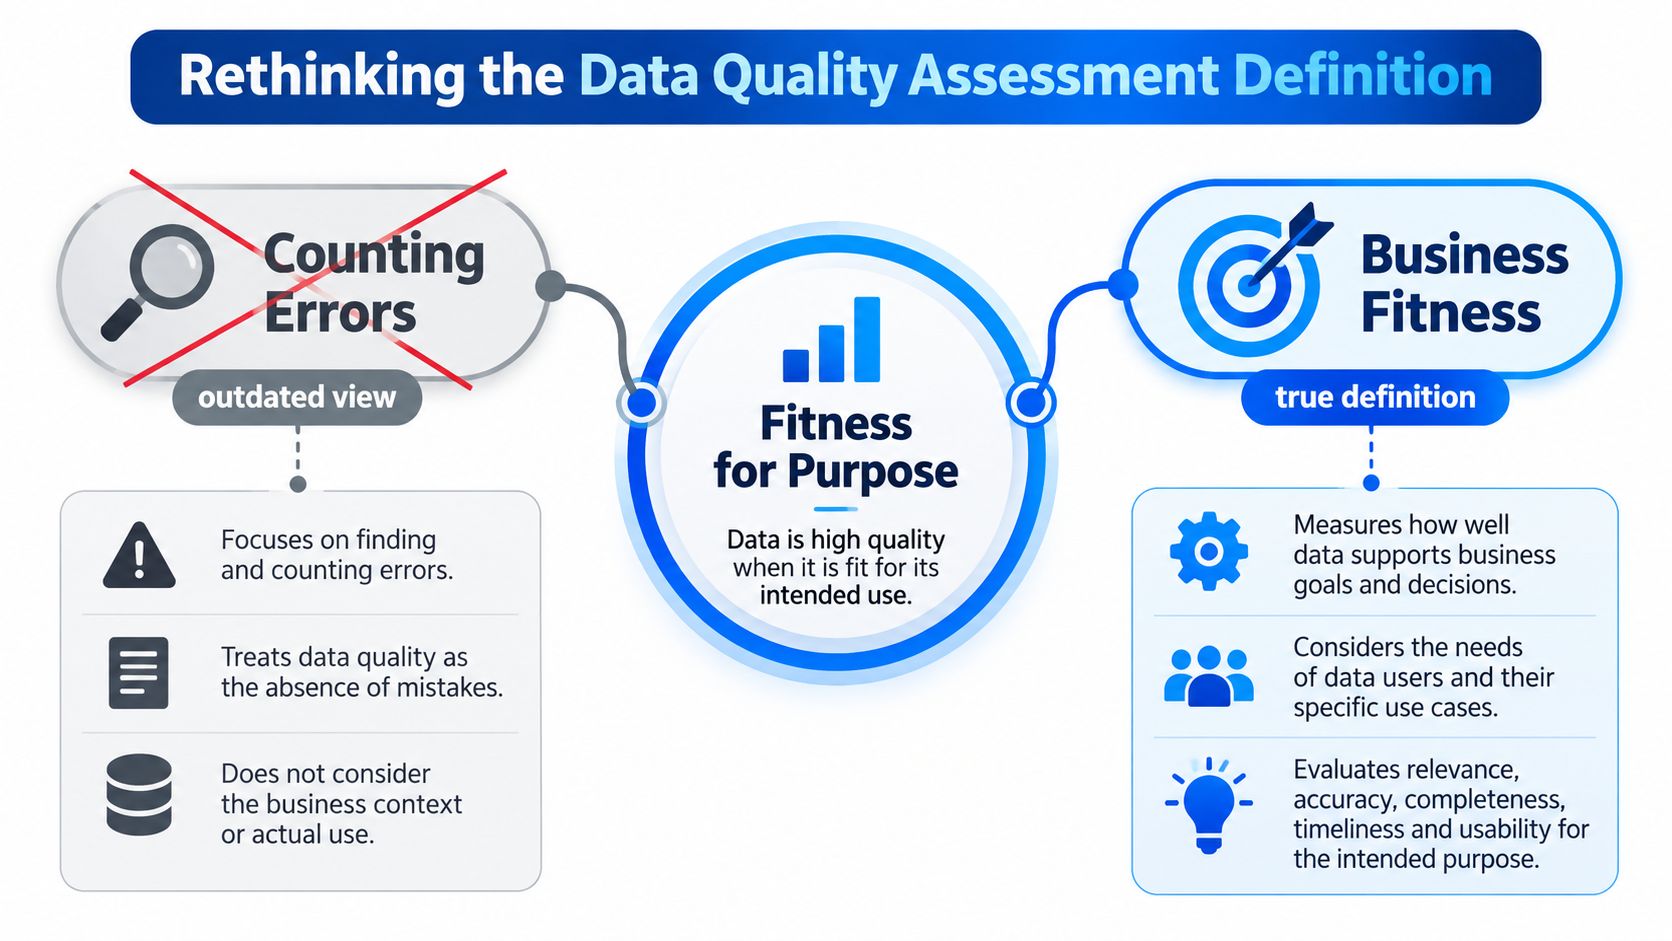
A clean dataset can still produce an untrustworthy result. Data quality assessment is not checking whether values contain errors. It is a standards-based process that profiles data, measures the dimensions relevant to its use, and tests whether the result supports an operational, analytical, regulatory, or machine learning purpose.
A technically valid table may still fail in production. Yesterday's records can be accurate but too late for an operational decision. A populated field can conceal missing coverage because an entire customer segment never entered the dataset. Two systems can reconcile internally while assigning different meanings to “active customer.” For analytics and AI, those semantic conflicts can create features that look consistent but represent different business concepts.
The broader fitness-for-use approach emerged in academic data quality research during the 1990s. Wang and Strong defined data quality as “fitness for use” in 1996, shifting attention from error counts to the needs of data consumers, as documented in this review of data quality assessment history.
Why one score isn't enough
A single accuracy score cannot show whether definitions, lineage, freshness, and population coverage support a decision. A repeatable assessment ties each measurement to a documented purpose and identifies the risks that matter for that workload.
Operational use: Can the pipeline deliver usable data when downstream processes need it?
Analytical use: Do definitions, joins, and coverage support a defensible conclusion?
Regulatory use: Can the organization explain the source, controls, transformations, and evidence behind the output?
AI use: Do training data and features represent the intended business concepts consistently enough for evaluation and deployment?
Statistics Canada describes quality through characteristics including relevance, coverage, granularity, accuracy, reliability, standardization, timeliness, punctuality, reproducibility, and trustworthiness in its Data Quality Toolkit. That range explains why assessment is an operating control, not a one-time verdict. Schemas, sources, definitions, users, and requirements change, so checks and ownership must change with them.
For a broader introduction, see this guide to what data quality means. The practical question is whether the right users can rely on the data for a specific decision, and whether the organization can show why.
The Five Core Dimensions of Data Quality
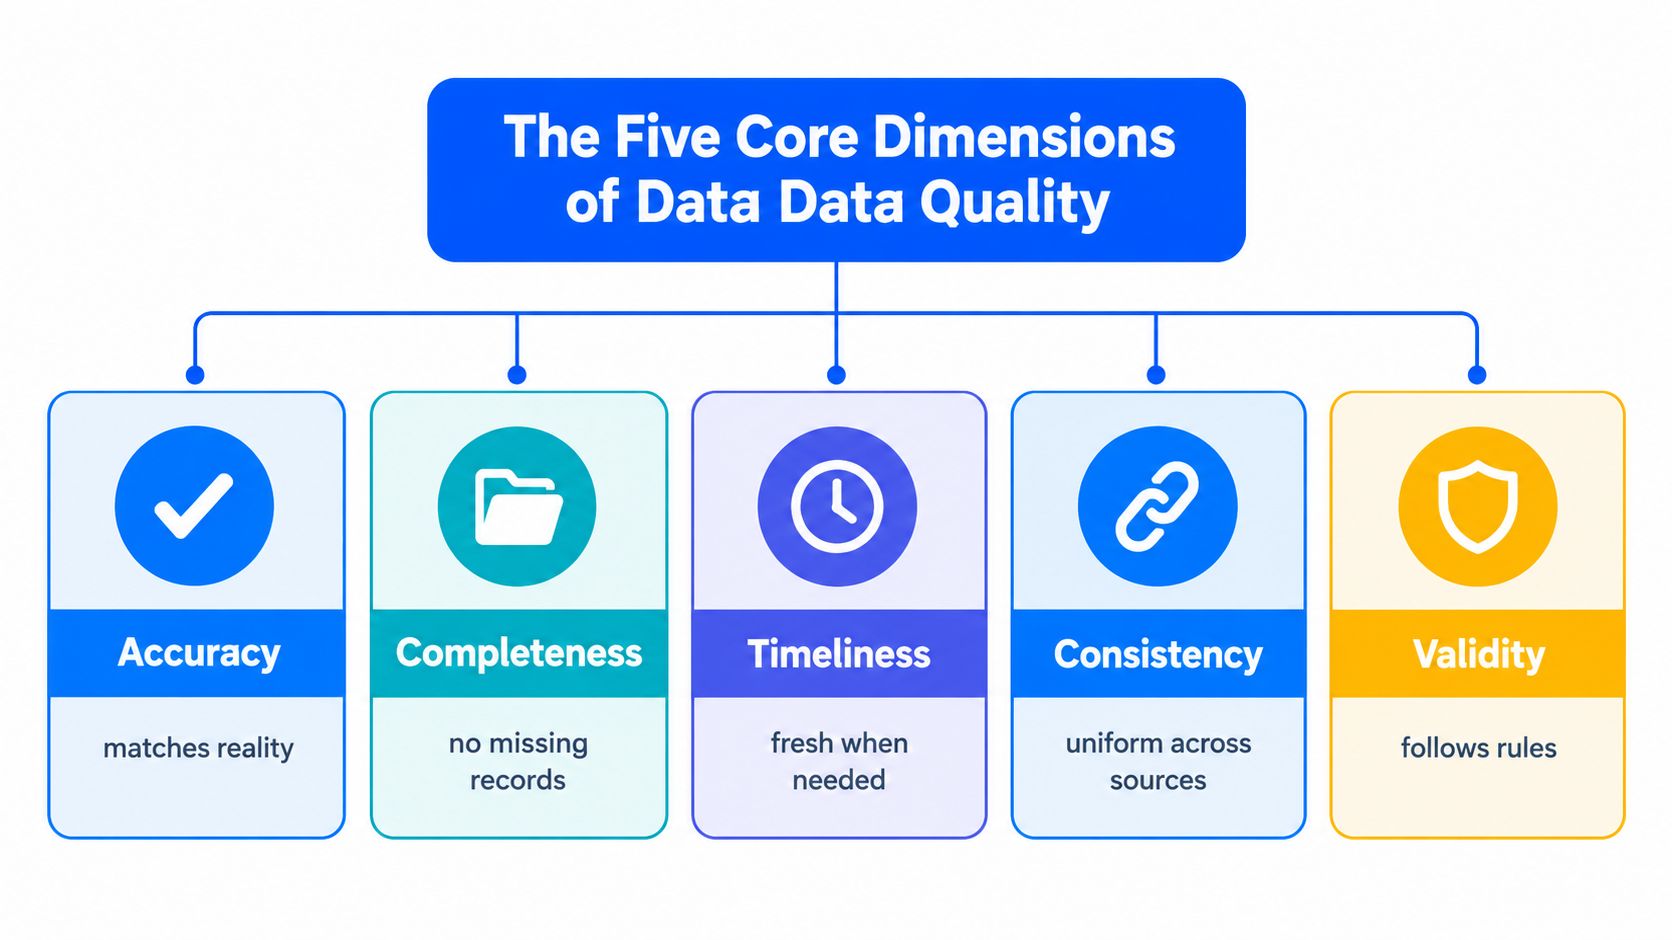
A usable assessment needs a small set of dimensions that teams can measure repeatedly and interpret in context. These dimensions expose different failure modes. A dataset can pass format checks yet remain untrustworthy for analytics or machine learning when its values carry the wrong business meaning. Use this overview of the dimensions of data quality as a measurement model, then adapt the rules to the workload.
Accuracy asks whether data reflects reality or an authoritative source. A date can match the required format and still be wrong. Production checks may compare records with source systems, reference data, reconciliation totals, or approved business facts. For machine learning, inaccurate labels or features can produce a model that performs consistently against flawed inputs.
Completeness asks whether required records and attributes are present. Separate a permitted null from a missing value that blocks a process, analysis, or model feature. Coverage matters as well. Check systems, populations, and relevant time periods, rather than judging completeness from populated columns alone.
Timeliness measures whether data arrives fresh enough for its intended use. A monthly report, operational alert, and model feature can have different freshness requirements. Define acceptable delivery windows and assess the consequence of lateness, instead of treating every delay as equally serious.
Consistency checks whether equivalent values, relationships, and definitions agree across systems and transformations. It includes formats and codes, but it also exposes semantic conflicts. Two departments may calculate the same metric differently, leaving clean-looking data that cannot support a reliable comparison or training set.
Validity tests whether values conform to declared rules, formats, reference lists, and structural expectations. A rule can confirm that a status belongs to an approved set. Cross-field rules test whether related attributes make business sense together, which catches errors that column-level validation misses.
Add traceability to the model
Lineage is not a separate pillar in the visual model, but production teams need it to interpret every result. When a rule fails, engineers should be able to identify the affected source, transformation, table, report, or model. Without that path, a score describes a symptom without showing where remediation belongs.
ISO-related guidance distinguishes syntactic quality, semantic quality, and pragmatic quality. Syntax covers declared structure, semantics covers intended meaning, and pragmatics covers the user's purpose, as explained in this overview of ISO 8000 quality concepts. That distinction prevents teams from treating technically clean data as automatically fit for analytics or AI.
Each dimension needs an owner, a rule or metric, an acceptable threshold, and an escalation path. Continuous checks make those controls actionable instead of leaving the model as a checklist.
Historical Context and Standards
The definition of data quality assessment developed in stages. Academic work in the 1990s broadened quality from simple correctness to fitness for use. Formal standardization followed, with ISO publishing its data quality standard in 2011, as noted in the historical review cited earlier. That shift still matters because a value can be cleanly formatted and technically valid while carrying the wrong business meaning for an analyst or machine learning model.
The IMF developed its Data Quality Assessment Framework after an Executive Board discussion in December 1997. A paper was presented in July 2001, and the framework was publicly described in 2003. Its structure contains six parts, beginning with prerequisites of quality and then examining five additional dimensions. The IMF Data Quality Assessment Framework separates enabling conditions, including governance and institutional arrangements, from the quality of statistical products and processes.
That separation exposes a common enterprise failure. A team may produce technically correct records through an undocumented process, or maintain formal governance while its data remains incomplete. Neither result is trustworthy for reporting, forecasting, or AI training. An assessment should therefore examine ownership, legal conditions, documentation, process capability, and the meaning assigned to each field, not only its stored values.
The ISO data profiling standard treats profiling as a foundation for assessment. Profiling provides column analysis and dataset statistics, but engineers still need to map those observations to business requirements and quality dimensions. ISO 8000-61 also connects data quality management with process capability and organizational maturity.
Standards turn opinions into evidence
Standards do not remove judgment. They make it explicit and repeatable. A regulated team can document why a freshness threshold exists, which records are in scope, how a failure is calculated, and who accepts the remaining risk.
That audit trail makes government guidance useful in commercial settings too. The EPA approach to data quality assessment frames assessment as a scientific and statistical evaluation of whether data has the right type, quality, and quantity for its intended use. The same principle applies to finance, healthcare, and public-sector analytics.
Teams seeking broader governance context can pair standards with DAMA DMBOK guidance. The practical test is simple: a framework earns its place when engineers and data owners can use it to make consistent decisions about semantic risk, model suitability, and remediation.
Operational Risks of Poor Assessment
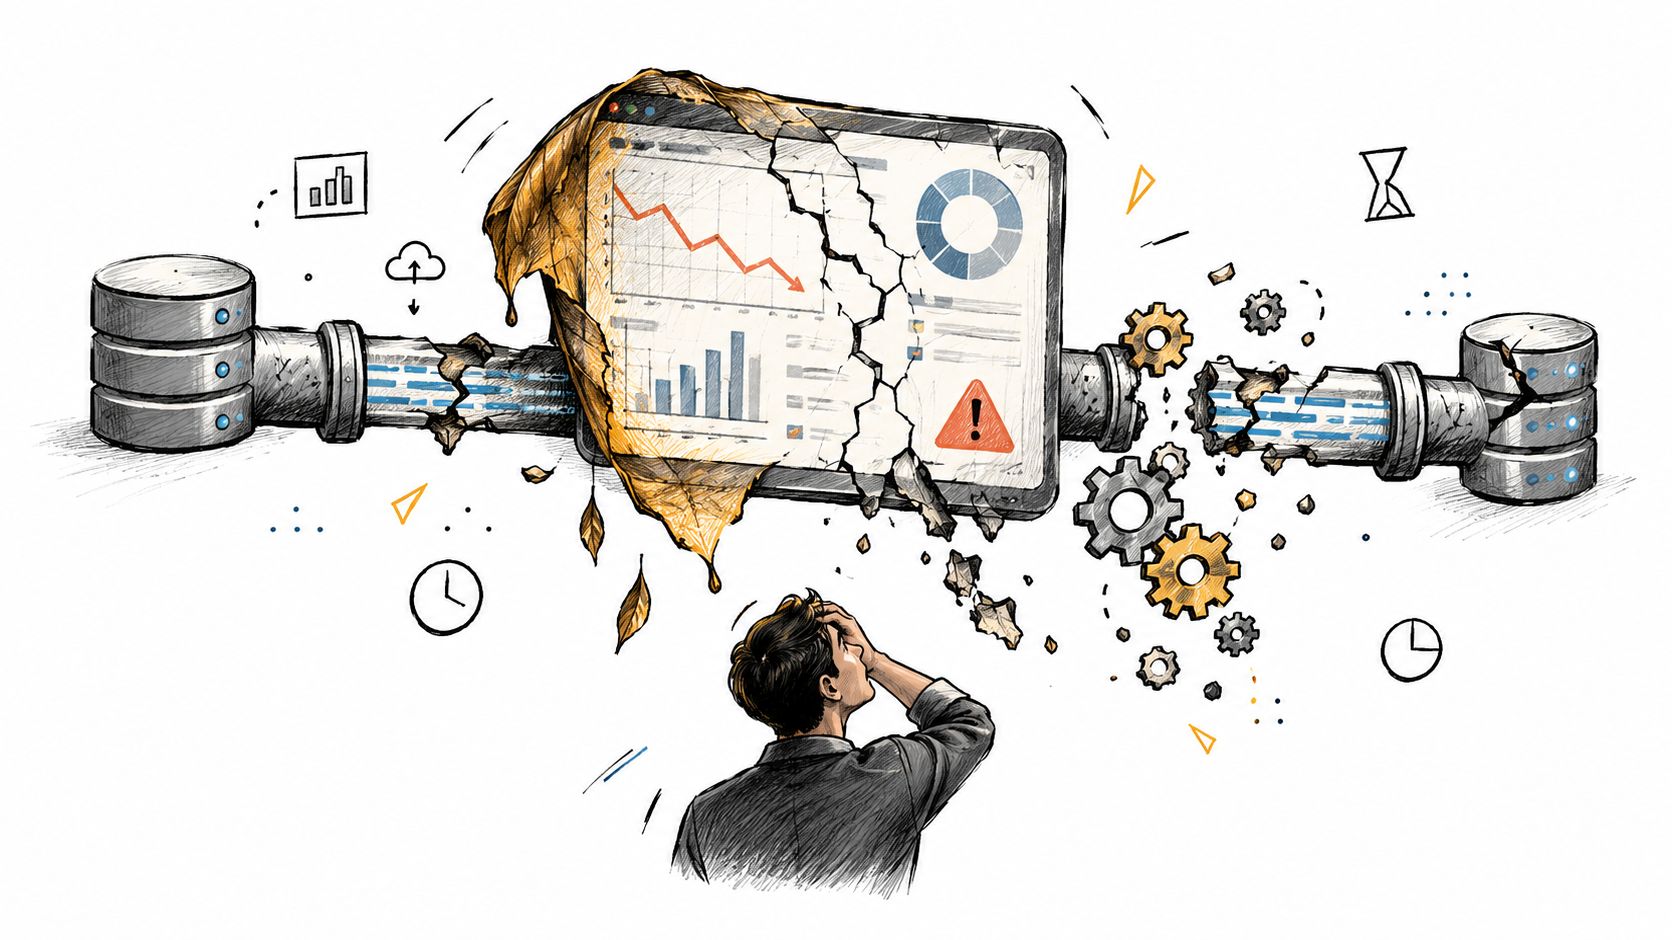
Poor assessment rarely fails with an obvious red warning. More often, a pipeline succeeds technically while delivering data that no longer supports the decision attached to it.
A stale dashboard is a timeliness failure. A renamed source column that passes through an unmonitored transformation is a schema and lineage failure. A report that combines two valid but differently defined measures is a consistency and semantic failure. Each problem can remain invisible when teams monitor only nulls, formats, or row-level validity.
What breaks first
The visible incident is often downstream from the quality defect:
Dashboards lose credibility: Analysts find conflicting numbers and start reconciling extracts manually.
Pipelines hide delays: A successful job status can conceal a file that arrived late or contained only a partial load.
Schemas drift without notice: Added, removed, or retyped columns can change downstream behavior without producing an application error.
Models inherit ambiguity: A machine learning workflow may treat conflicting definitions as comparable features because the values look structurally valid.
Remediation slows down: Without lineage and ownership, teams debate where the problem started instead of fixing the responsible process.
The cost isn't limited to rework. Users may stop trusting governed datasets and create private spreadsheets or parallel queries. Engineers then support multiple unofficial versions of the same metric, making future assessments harder.
Practical rule: Assess the failure modes that can invalidate the decision, not only the defects that are easiest to count.
Continuous assessment addresses this operating reality. Teams can profile at onboarding, but production monitoring should watch delivery behavior, distributions, structural changes, validation outcomes, and business metrics over time. The goal isn't to eliminate every anomaly. It's to identify material changes early, connect them to affected consumers, and give an owner enough evidence to act.
Manual Rules Versus Continuous Observability
Hand-written rules still have a place. They work well when a requirement is explicit, stable, and legally or operationally important. A mandatory field, an approved status code, or a referential integrity condition should remain deterministic because the organization needs a clear pass or fail decision.
The trouble starts when teams use manual rules for every possible pattern. Rule libraries grow faster than their owners can review them, and a rule that made sense for last year's schema may become irrelevant after a migration. Static checks also tend to detect known defects while missing unusual but valid changes in volume, timing, distribution, or behavior.
Assessment Approach | Scalability | Maintenance | Detection Capability |
|---|---|---|---|
Manual deterministic rules | Strong for targeted, well-defined controls | Requires ownership, review, and updates as requirements change | Effective for known conditions and business constraints |
Periodic profiling | Useful for discovery across unfamiliar datasets | Low operational continuity between assessments | Finds patterns, nulls, distributions, and outliers at review time |
Continuous observability | Scales across changing pipelines when baselines and ownership are managed | Requires tuning, incident triage, and governance discipline | Detects deviations in behavior, timeliness, structure, and quality trends |
Hybrid assessment | Combines broad monitoring with precise controls | Balances maintenance across rule types | Covers both explicit requirements and previously unknown anomalies |
Choosing the right mix
Manual rules are appropriate when the business can state the requirement precisely and explain why a violation matters. Continuous detection is more useful for behavior that varies naturally, such as delivery timing or dataset distributions. Statistical and machine learning methods can establish expected patterns, but they don't replace business context. An unusual result may be a defect, a legitimate seasonal shift, or a planned change.
The production pattern that works best is usually deterministic validation plus adaptive monitoring. One enforces what must always be true. The other watches for changes that nobody thought to encode in advance.
Teams evaluating the trade-off can also review this discussion of manually maintained technical data quality rules. The important design decision isn't whether rules or observability wins. It's which evidence requires a fixed policy and which behavior deserves continuous comparison with a changing baseline.
Executing a Data Quality Assessment
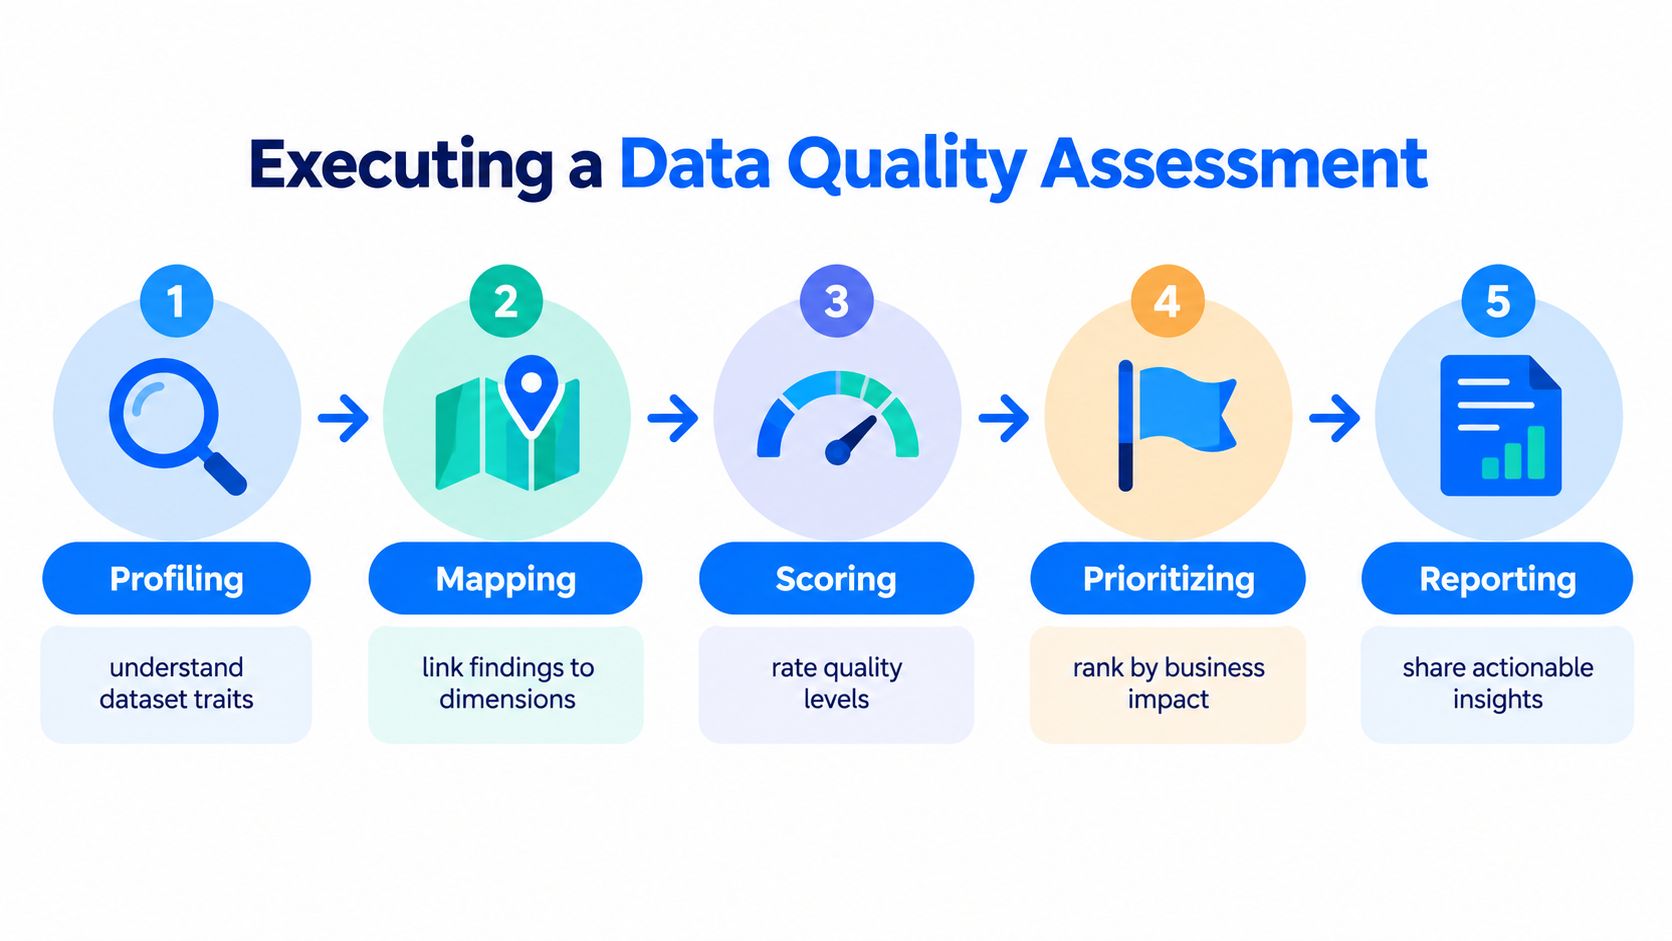
A useful assessment turns observations into decisions. The following workflow keeps profiling, measurement, business context, and remediation connected.
Start with profiling
First, inspect the dataset's structure and behavior. Record columns, types, value patterns, nulls, uniqueness, distributions, relationships, delivery history, and available metadata. Profiling is discovery, not the final assessment. It tells you what appears to be happening, but it doesn't decide whether the pattern is acceptable.
Map findings to intended use
Next, identify the consumers and the decision supported by the data. Map each finding to dimensions such as accuracy, completeness, timeliness, consistency, validity, and lineage. Then record the semantic requirements that technical profiling can't infer, including business definitions, scope, ownership, and source authority.
A missing value may be acceptable in one workflow and disqualifying in another. A change in distribution may indicate data drift, or it may reflect a legitimate business event. Context determines the interpretation.
Define thresholds
Set measurable expectations per dataset rather than using organization-wide defaults. Useful controls include required and optional fields, acceptable null rates, freshness limits, schema-change detection, expected row volumes, permitted values, and reconciliation conditions. Standards-based quality guidance emphasizes explicit dimensions and documented requirements, which makes results more reproducible.
Validate and prioritize
Apply record-level business rules alongside dataset-level monitoring. Then rank failures by business impact, affected consumers, regulatory exposure, and remediation effort. A small defect in a critical regulatory field may deserve faster action than a larger defect in an unused attribute.
The government-oriented measurement model provides a practical pattern: identify assertions tied to policies, connect them to business impact, categorize flaws, quantify their contribution to conformance, and report results in a drillable format.
Report and operationalize
Finally, publish the result with evidence, ownership, affected assets, and the next action. Put checks into the pipeline or observability layer so the same assessment runs when data changes, not only when someone remembers to launch an audit.
A practical data quality audit workflow should preserve history. Trend results over time, record accepted exceptions, and verify remediation. Without historical evidence, teams can't distinguish a new incident from a recurring defect.
Case Study - ITSV's Data Quality Transformation
ITSV, Austria's social insurance IT backbone, faced the maintenance burden created by a large collection of hand-crafted quality rules. The organization replaced 9,000 manually created rules with digna Data Anomalies and Data Timeliness, moving from a primarily rule-maintenance model toward continuous observability.
The value of the change wasn't just fewer rules. ITSV needed a monitoring approach that could scale with its data environment without requiring specialists to remember every expected pattern. Continuous anomaly detection helped reduce alert noise, while timeliness monitoring focused attention on whether data arrived according to expected operational behavior.

What the example demonstrates
The transformation illustrates three practical lessons:
Rule volume isn't quality maturity: Thousands of checks can create a large maintenance obligation without covering semantic drift or unexpected behavior.
Adaptive monitoring preserves attention: Reducing unnecessary alerts gives engineers more time to investigate meaningful changes.
Knowledge should live in the system: A monitoring process that depends on individual memory becomes fragile when people change roles or leave.
The ITSV example doesn't make deterministic rules obsolete. Critical business requirements still need explicit validation. It shows why teams benefit from combining those controls with monitoring that learns the normal behavior of datasets and flags deviations for review.
The strongest operating model also assigns responsibility after detection. An anomaly without context, lineage, and ownership becomes another ticket in a backlog. An anomaly tied to an affected process and a clear decision owner can become a controlled remediation workflow.
Enterprise Implementation Considerations
Enterprise adoption succeeds when the assessment architecture respects security, governance, and the way teams already work. Moving data into a separate monitoring service can create unnecessary exposure, duplication, and approval friction. In-database execution keeps metric computation and analysis within the customer's databases, so the data remains in place while teams still receive quality evidence.
Deployment flexibility matters just as much. Private cloud and on-premises installation can fit organizations that need controls inside their own cloud, virtual private cloud, or data center. The right choice depends on security policy, network design, operational ownership, and how quickly the platform must connect to existing warehouses and pipelines.
Design for shared ownership
A data engineer needs incident details and lineage. An analytics engineer needs to understand metric behavior. A business stakeholder needs a clear status and impact statement. A user-centric dashboard should serve all three without forcing each group to assemble its own interpretation.
Look for an implementation that includes the operational basics from the start:
In-database computation: Keep source data in the customer-controlled environment.
Modular adoption: Begin with the capability that addresses the most urgent risk, then expand as ownership and measurement mature.
Integrated scheduling: Run assessments consistently instead of relying on ad hoc scripts.
Catalog and collaboration: Connect findings to assets, owners, incidents, and decisions.
Transparent commercial logic: Understand how active tables, modules, environments, and support affect the cost model.
AI-driven monitoring can reduce manual maintenance, but it still needs governance. Teams must review baselines, explain exceptions, protect sensitive data, and decide which findings block downstream use. Automation should remove repetitive detection and routing work, not remove accountability.
The best implementation is therefore neither a giant rule-writing project nor an opaque machine learning layer. It is a controlled system that combines explicit business rules, adaptive anomaly detection, lineage, timeliness monitoring, schema awareness, and visible ownership.
digna provides an enterprise data quality and observability platform that runs inside the customer's environment, with anomaly detection, timeliness monitoring, record-level validation, schema tracking, in-database execution, and shared dashboards for data teams and stakeholders. Visit digna to explore how continuous assessment can make data more trustworthy for analytics and AI.
Rules cover the failures you can predict; for the ones you cannot, digna Data Anomalies learns the normal volume, distribution and behavior of each table and flags deviations that no hand-written rule anticipated.
Frequently asked questions
What is a data quality assessment?
A data quality assessment is a standards-based process that profiles data, measures the dimensions relevant to its use, and tests whether it supports an operational, analytical, regulatory or machine learning purpose. It goes beyond counting errors, because a technically valid table can still arrive too late or carry the wrong business meaning.
What are the dimensions of data quality assessment?
The post uses five core dimensions: accuracy, completeness, timeliness, consistency and validity, with lineage added for traceability. Lineage is not a separate pillar, but it lets engineers trace a failed rule back to the affected source, transformation, table, report or model, so remediation lands in the right place.
Who defined data quality as fitness for use?
Wang and Strong defined data quality as fitness for use in 1996, shifting the focus from error counts to the needs of data consumers. Formal standardization followed when ISO published its data quality standard in 2011, and the IMF described its six-part Data Quality Assessment Framework publicly in 2003.
How do you perform a data quality assessment step by step?
Start by profiling structure, nulls, distributions and delivery history, then map findings to the intended use and its consumers. Next, set per-dataset thresholds such as freshness limits and acceptable null rates, rank failures by business impact, and finally build the checks into the pipeline so the assessment reruns whenever data changes.
Should data quality checks be manual rules or automated monitoring?
Most teams need both: deterministic rules for requirements that must always hold, plus adaptive monitoring for behavior nobody encoded in advance. ITSV, Austria's social insurance IT backbone, replaced 9,000 hand-crafted rules with digna Data Anomalies and Data Timeliness, while keeping explicit validation for critical business requirements.



