Why Data Quality Is Important to an Organization
|
0
minuto de lectura

A leadership team starts the morning with a familiar routine. Finance reviews the revenue dashboard, operations checks fulfillment volumes, sales studies the pipeline, and customer service prepares for the day's demand. By afternoon, someone discovers that one source delivered late, another changed a field name, and a third contains duplicate customer records. The dashboard looked precise, but the organization was making decisions from an incomplete picture.
The problem usually isn't one dramatic database failure. It's a missing field, a stale extract, an inconsistent definition, or a schema change that nobody noticed. Those defects travel into forecasts, regulatory reports, customer workflows, and AI systems before anyone connects them to the original source.
That's why why data quality is important to an organization is a business question, not merely a technical one. Reliable data helps people decide, act, explain, and comply with confidence. Poor data forces teams to question reports, repeat work, delay initiatives, and defend numbers they can't fully trace. This guide explains how data quality creates organizational control across decisions, compliance, and AI risk, and how leaders can turn it into a sustained operating capability. For a practical overview of its business value, see the organizational benefits of data quality.
Table of Contents
How Organizations Build Reliable Data Quality and Observability
Real World Examples of Data Quality Impact Across Industries
Introduction Why Data Quality Shapes Organizational Success
A forecast can fail even when the calculation is correct. Suppose a planning team expects a rise in orders and schedules inventory, staffing, and transport accordingly. The forecast uses a valid model, but one regional system sends yesterday's transactions late and another records returns under a changed category. The planning team isn't looking at nonsense. It's looking at data that no longer represents the business as a whole.
That distinction matters. Most organizational decisions depend on several systems joining together: customer records, orders, payments, inventory, service interactions, workforce data, and external information. A defect in one stream can alter the meaning of a combined result. Finance may see revenue that doesn't reconcile, customer service may contact the wrong person, and executives may spend a meeting debating whose spreadsheet is right instead of deciding what to do.
Quality problems cross functional boundaries
Data quality affects every team that consumes information:
Finance uses it for close processes, planning, controls, and reporting.
Operations relies on timely and complete records to coordinate work.
Sales and marketing need consistent customer and account data to prioritize opportunities.
Customer service depends on accurate identities, histories, and case details.
Risk and compliance require traceable evidence that supports formal obligations.
Data and AI teams need dependable inputs for dashboards, models, and automated workflows.
The data team may detect the defect, but the business often absorbs the consequence. A late delivery can become a missed operational decision. A duplicate account can become confused customer treatment. A renamed column can cause a downstream report to display an empty or misleading measure without producing an obvious error.
Practical rule: Treat every critical dataset as part of an operational process, not as a passive technical asset.
Organizations often begin quality work after a visible incident. A report breaks, a regulator asks for evidence, or a model produces an implausible result. That reaction is understandable, but it leaves leaders paying for discovery, investigation, correction, and communication at the most expensive point in the lifecycle.
A stronger approach asks earlier questions. Who owns the data? What does “complete” mean for this use case? How fresh must it be? Which changes should stop a pipeline, and which should create a warning? Once those answers are explicit, data quality becomes something the organization can manage rather than something it can only debate.
What Data Quality Means Inside an Organization
Think of organizational data as a water supply system. Information begins at many sources, moves through treatment and distribution points, and eventually reaches a tap where someone uses it. A clean-looking glass doesn't prove the whole supply chain is healthy. The organization also needs to know whether the water arrived on time, whether contaminants entered upstream, and whether the pressure is sufficient for the intended use.
Data quality works the same way. A dataset is fit for purpose when it contains the characteristics a particular decision or process requires. A monthly strategy report may tolerate a short delay, while a fraud process or operational alert may not. An AI training dataset may require strong lineage and consistent labels in addition to the qualities expected in a dashboard.
Six checks make quality practical
Start with the dimensions that describe whether data can safely support a use:
Accuracy means the value reflects the world thing it represents. A customer's current address should identify where the customer can be reached.
Completeness means critical information isn't missing. An order without a product identifier may exist in the system, but it can't support dependable product analysis.
Consistency means related systems use compatible values and definitions. If one team labels a customer as active while another uses a conflicting status, users can't interpret the combined record confidently.
Timeliness means information arrives and remains current when the process needs it. A correct value delivered after a decision window may still be operationally useless.
Validity means data follows required formats, ranges, and business rules. A date, identifier, or category can be present yet fail the rules required to process it.
Uniqueness means the organization doesn't count the same world entity multiple times. Duplicate customer or transaction records can distort volume, value, and prioritization.

Fitness matters more than perfection
No organization needs every field to be perfect before it can operate. The useful question is whether the data is reliable enough for its intended purpose, with known limitations and accountable owners. A customer service workflow may prioritize identity accuracy and completeness, while an executive trend report may prioritize consistency and historical comparability.
This is why quality requirements should be defined with business users. Ask what decision the data supports, what failure would cost, how quickly an issue must be detected, and what evidence users need to trust the result. The meaning of data quality becomes clearer when teams connect each dimension to an actual process rather than treating it as an abstract score.
The True Cost of Poor Data Quality for Organizations
Poor data quality creates visible losses, such as incorrect payments or failed reports. Its larger cost often appears as accumulated friction. Analysts reconcile files manually, engineers investigate unexplained pipeline changes, and managers delay decisions while teams verify numbers. Commercial teams lose confidence in records that should guide action.
IBM cites Gartner research estimating that organizations lose an average of USD 12.9 million per year because of poor data quality, as reported in IBM's analysis of the cost of poor data quality. The same analysis says 43% of chief operations officers rank data quality issues as their most significant data priority. More than a quarter of organizations estimate annual losses above USD 5 million, while 7% report losses of USD 25 million or more.
These figures describe enterprise-scale exposure, but the mechanism is familiar in organizations of every size. A defective record creates rework. Rework consumes capacity, and lost capacity delays initiatives expected to generate value. Teams can also estimate their exposure with this data downtime cost calculator.
The bill extends beyond remediation
Anomalo's 2024 executive brief reports that 95% of executives had experienced a data quality issue with a direct impact on business outcomes, according to the State of Enterprise Data Quality report. The impact can take several forms:
Manual effort: Teams compare extracts, repair records, and explain discrepancies instead of improving products or services.
Revenue leakage: Incorrect customer, product, or account information can prevent the right offer, invoice, or follow-up from reaching the right place.
Decision latency: Leaders wait for reconciliation before approving actions, launches, or investments.
Transformation drag: Modernization programs stall when older definitions and new platforms produce conflicting results.
Control costs: Compliance and audit teams spend more time assembling evidence and investigating exceptions.
A 2025 CRM data management report found that 76% of organizations said less than half of their CRM data was accurate and complete. The same report said 37% identified poor data quality as a direct cause of revenue loss, and 37% said it delayed key revenue-generating initiatives, as reported by Validity's 2025 State of CRM Data Management release.
Why costs compound
Data defects rarely remain in the system where they begin. A missing identifier can break a join, distort a metric, alter a forecast, and influence a staffing or investment decision. Each downstream team may then perform its own correction, multiplying the original effort.
Independent research cited in recent literature reports average annual losses of about US$12.9 million per organization. Other studies estimate that bad data can consume 15% to 25% of revenue in many companies through rework, error correction, lost opportunities, and flawed decisions, as discussed in the published research on data quality costs.
The investment question is therefore broader than the cost of a quality platform. Organizations also fund recurring correction work, delayed decisions, control activity, and exposure created when ownership, timeliness, or schema changes go unnoticed.
How Poor Data Quality Undermines Decisions Trust and AI
A finance dashboard shows revenue rising, so leadership approves new hiring. Later, the team discovers that a source table arrived late and excluded recent transactions. Nothing looked broken on screen. The decision was still built on incomplete evidence.
A report can render normally while its meaning has changed. A renamed field, altered schema, or revised business definition may pass through the pipeline without an obvious error. The result is more dangerous than an empty report because familiar numbers encourage action before anyone investigates.
Trust then weakens across the organization. Leaders question official metrics, analysts defend figures they did not create, and teams maintain personal spreadsheets or verbal explanations to fill gaps. Data quality has become an organizational control issue, not merely a dashboard concern.
Silent failures damage trust
Several failure paths deserve attention:
Stale data makes current conditions appear historical.
Schema drift changes fields, types, or structures that downstream users may interpret incorrectly.
Incomplete delivery removes part of a population or reporting period from a measure.
Unobserved distribution shifts cause data to behave differently from the baseline used by a report or model.
Inconsistent definitions let two credible teams produce different answers to the same business question.
Research and industry material associate bad data with weaker decision accuracy, lower confidence in reporting, and slower responses. One survey-based source identified data quality as the second-most cited barrier to realizing value from data and analytics. Another reported that 91% of leaders said investing in data quality positively affected business growth, as summarized in O'Reilly's discussion of data quality.
These failures also create control gaps. If nobody owns a definition, monitors freshness, or reviews schema changes, the organization may be unable to explain why a number changed or prove which data supported a decision.
AI raises the standard
AI systems reuse data at speed and scale. A model may learn from incomplete records, an agent may query a renamed column, and an automated workflow may act on a stale status. The output can sound confident while its evidence is wrong. For a practical explanation of this dependency, see why AI models depend on data quality.
ISO/IEC 5259-5:2025 presents data quality governance as an organizational framework across the data life cycle for analytics and machine learning, as described in the ISO/IEC 5259-5:2025 standard overview. The executive question therefore extends beyond dashboard accuracy: who governed the data, which controls applied, and did it remain fit for training, inference, and regulatory evidence?
Governance insight: AI risk begins upstream, where teams define, collect, transform, describe, and approve the data an automated system will use.
Quality functions as a control plane connecting operational correctness, decision trust, compliance evidence, and AI accountability. Monitoring only model outputs or dashboard availability means observing the final stage after earlier failures may already have passed unnoticed.
How Organizations Build Reliable Data Quality and Observability
Reactive cleanup and proactive observability solve different problems. Cleanup repairs known defects after they reach a consumer. Observability helps teams understand what changed, when it changed, which assets are affected, and whether the behavior differs from an expected baseline.
A sustainable program uses both, but it places prevention and early detection closer to the source. The aim isn't to create endless rules. It's to make important expectations explicit, monitor them continuously, and route failures to the people who can correct them.
Start with ownership and purpose
Assign an owner for each critical data domain. That owner should work with data engineers, analysts, risk teams, and operational users to define acceptable quality for the processes that depend on the data.
A useful ownership record includes:
Business purpose: What decision, customer interaction, control, or model uses the dataset?
Quality expectations: Which fields must be complete, valid, consistent, unique, accurate, or timely?
Impact level: What happens if the dataset is wrong or late?
Response path: Who investigates, who approves a workaround, and who confirms resolution?
Evidence: Which checks, lineage details, and incident records demonstrate control?
Without ownership, monitoring becomes a notification service. Alerts arrive, but nobody has the authority or context to decide whether the issue matters.
Compare reactive cleanup with continuous control
Reactive cleanup | Proactive quality and observability |
|---|---|
Finds defects after a report or user notices them | Detects unusual behavior before downstream use |
Focuses on individual records or known rules | Combines validation with freshness, volume, lineage, and schema signals |
Repairs symptoms downstream | Helps teams correct problems at the source |
Produces one-off explanations | Builds repeatable evidence for governance and audit |
Measures incidents after disruption | Tracks patterns and degradation over time |
Continuous checks should cover record-level business rules, delivery timing, volume behavior, and structural changes. In-database execution can also keep data inside the customer's environment while metrics and analyses run where the data already resides.
Use observability as a shared operating layer
digna provides a modular platform for data quality and observability that runs inside a customer's own environment. Its capabilities include anomaly detection, historical metric analysis, timeliness monitoring, record-level validation, schema change tracking, in-database execution, private or on-premises deployment, and a shared dashboard for data engineers, analysts, and stakeholders. Teams can learn more about data observability as an operating discipline, then evaluate which controls fit their architecture and risk profile.
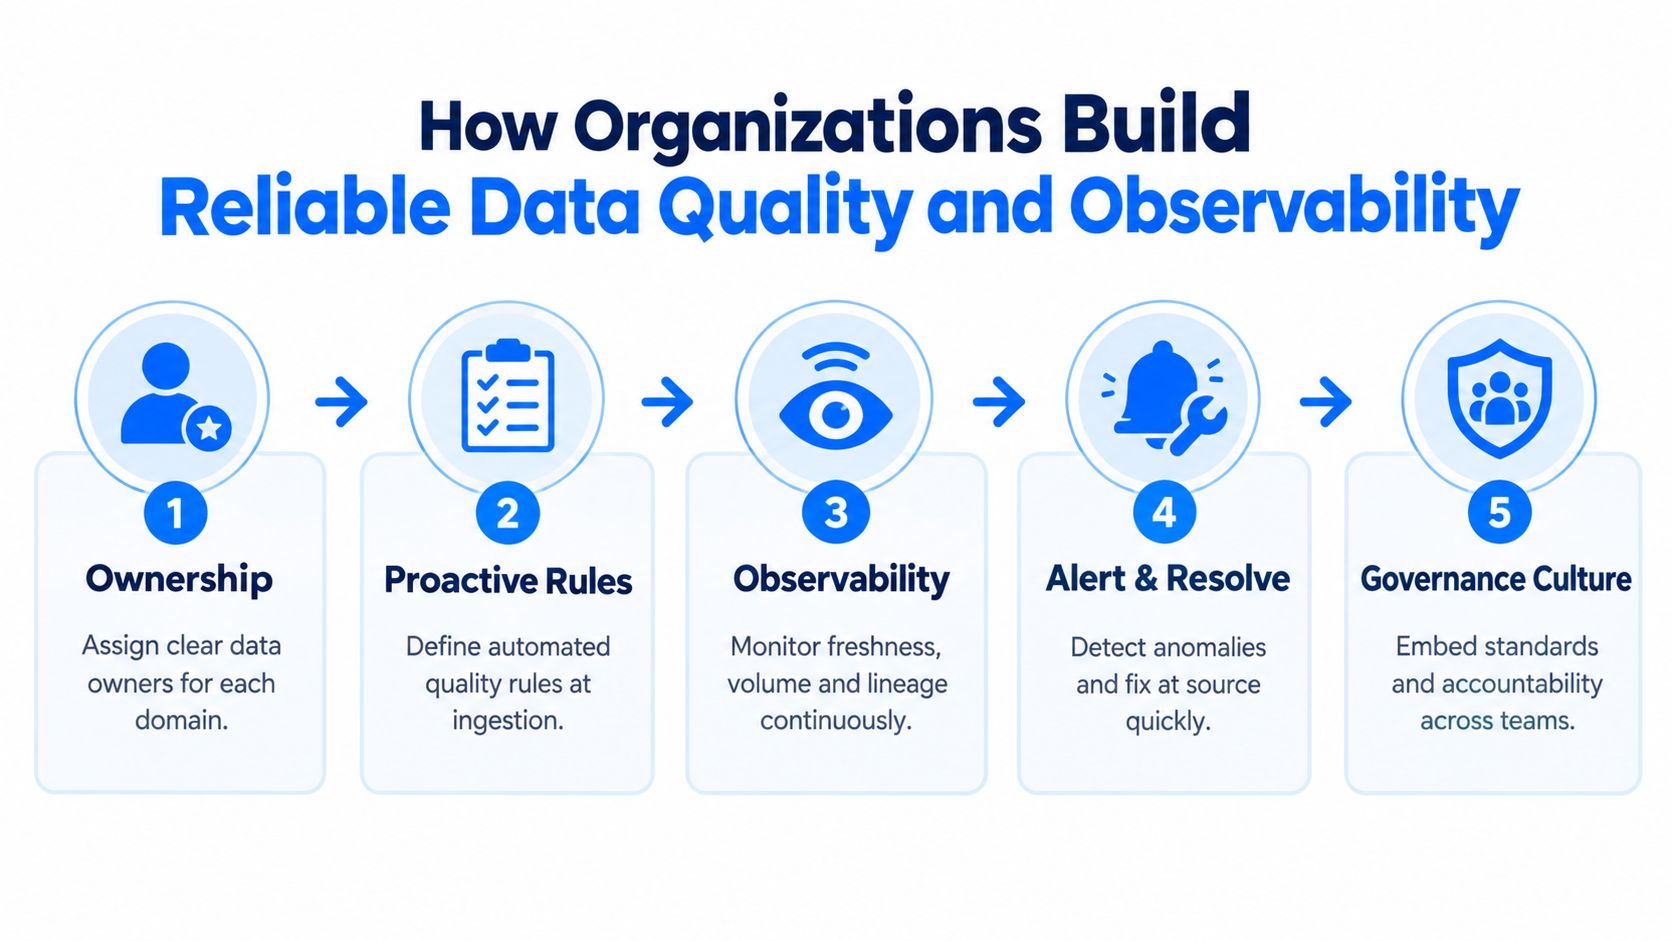
The platform is only one part of the program. Leaders still need clear definitions, response agreements, and incentives that reward prevention rather than quiet downstream repair. Observability gives people visibility. Governance gives them authority and accountability.
Real World Examples of Data Quality Impact Across Industries
The same quality dimensions create different risks depending on the industry. A late transaction feed can affect risk reporting in financial services, while a missing clinical value can affect care coordination in healthcare. The control pattern remains recognizable, but the business consequence and required evidence change.

Financial services
A bank may depend on transaction, customer, risk, and regulatory data that moves through several platforms. If a schema change alters a field type or a feed arrives late, reporting teams may reconcile numbers manually while risk teams question whether they're using the same population. Quality controls need to validate business rules, track delivery, detect unusual patterns, and preserve evidence showing what changed and how the organization responded.
Healthcare
Healthcare organizations combine clinical, administrative, claims, and operational records. Inconsistent identifiers can separate related events, while incomplete or delayed information can make it harder for teams to understand a patient or service episode. Here, completeness and consistency support safe coordination, while timeliness and traceability support operational and regulatory processes.
Telecommunications
Telecommunications teams work with high-volume customer, network, billing, and usage data. A sudden change in record volume may indicate a pipeline issue, a source-system change, or a genuine shift in activity. Monitoring expected delivery, unusual behavior, and structural changes helps teams distinguish business movement from data failure before reports or operational workflows respond incorrectly.
Public sector
Public sector organizations often need to combine records across departments while preserving auditability and consistent definitions. A gap in lineage can make it difficult to explain how a figure was produced. Validation, ownership, and evidence matter because decision-makers may need to justify not only the result, but also the process that produced it.
Industry principle: The right quality control is the one tied to a real decision, obligation, or service outcome.
These examples also show why a single enterprise score rarely tells the full story. A dataset can be acceptable for broad trend analysis and unsuitable for a regulated calculation. Quality programs should therefore classify data by use, risk, and required response rather than applying one universal threshold.
Building a Data Quality Mindset That Lasts
A lasting data quality program rests on three habits: ownership, continuous visibility, and business accountability.
Ownership means every critical dataset has a named person or team responsible for its definition, acceptable condition, and resolution path. Responsibility shouldn't disappear when data moves from an operational system into a warehouse, lake, dashboard, model, or AI workflow.
Continuous visibility means teams monitor more than pass or fail rules. They watch freshness, volume, completeness, validity, unusual behavior, and structural change. They also preserve enough lineage and incident context to explain which consumers may be affected.
Business accountability means quality measures connect to outcomes. Instead of reporting only that a check failed, teams should explain whether the failure threatens a customer process, a financial control, a regulatory submission, a forecast, or an AI use case.
A practical starting checklist looks like this:
Choose critical assets: Identify the datasets that support important decisions and obligations.
Define fitness: Agree on what accurate, complete, consistent, valid, unique, and timely mean for each use.
Assign response: Establish who receives alerts and who can resolve source problems.
Monitor continuously: Detect degradation before it reaches reports, models, or automated actions.
Review value: Track reduced rework, faster issue resolution, stronger evidence, and greater confidence in analytics.
The central lesson is simple. Data quality isn't a final polish applied before reporting. It's the control layer that helps an organization decide responsibly, demonstrate compliance, and use AI without surrendering judgment to unreliable inputs.
digna helps organizations monitor data behavior, validate records, track timeliness, detect schema changes, and observe business and platform metrics inside their own environment. Visit digna to see how its modular data quality and observability platform can support a more reliable foundation for analytics and AI.


