Finding the Best Free Data Monitoring Software in 2026
|
7
min. Lesezeit

When someone says "free data monitoring software," it's easy to picture a single, no-cost solution. The reality is a lot more nuanced. The term covers a wide spectrum of tools, from powerful, do-it-yourself open-source projects to limited free versions of commercial platforms.
For data engineers and MLOps teams, these tools are often the first step toward gaining critical visibility into their pipelines. They help you catch issues early and build trust in your data—all without a huge upfront investment.
What Does 'Free' Really Mean for Data Monitoring?
When dashboards break or machine learning models give bizarre results, the culprit is often a silent data quality issue hiding deep in a pipeline. Free data monitoring tools offer a crucial first line of defense, giving you a way to see what's happening without the price tag of a full enterprise platform.
It's helpful to think about it like setting up security for your house. You have a few different paths you can take, each with its own set of trade-offs.
A breakdown of the three main categories of free software, outlining their core characteristics, typical users, and primary use cases.
Types of Free Data Monitoring Software Explained
Category | Definition | Example Tools | Best For |
|---|---|---|---|
Open-Source | DIY solutions built from community-maintained code. You host and manage everything yourself, giving you full control and customization. | Teams with strong engineering skills who need maximum flexibility and are willing to invest time in setup and maintenance. | |
Free Tiers | A limited, no-cost version of a polished commercial product. It handles the essentials but often has caps on usage, features, or data volume. | Commercial vendors offering a "free forever" plan for small-scale use. | Individuals or small teams wanting to try a polished tool, monitor a non-critical project, or get started quickly with minimal setup. |
Freemium | An introductory plan with core features available at no cost. It's designed to let you see the value before upgrading for advanced capabilities. | Tools that offer basic monitoring for free but charge for features like SSO, advanced alerting, or higher data throughput. | Teams evaluating a long-term solution. They can prove the tool's value on a small scale before committing to a paid plan. |
Each of these options gives you a starting point. The "right" one depends entirely on your team's skills, your project's scale, and how much time you can afford to spend on maintenance.
The Shift Toward Open-Source Reliability
Free and open-source tools aren't just for side projects anymore; they've become standard in many enterprise data stacks. By 2025, their adoption rate hit 78%, with tools like Prometheus, Zabbix, and Grafana becoming household names in the data world.
A 2026 report found that Prometheus alone is now deployed in over 45% of Kubernetes-based data pipelines. That’s not a niche tool—that’s a core piece of infrastructure.
The real goal here is proactive data reliability. It’s about shifting from fighting fires to preventing them by finding and fixing data problems before they affect a single business decision, dashboard, or ML model.
This proactive mindset is what builds lasting trust in data and prevents the all-too-common pain of "data downtime."
The path you choose should deliver immediate value while fitting your team's resources and long-term strategy. For a closer look at the DIY route, check out our guide on the best open-source data observability tools in 2026.
When you're evaluating a free data monitoring tool, it’s easy to get lost in feature lists and marketing buzz. But what really matters? A free license is worth nothing if the software can't actually protect you from the costly, silent errors that plague data pipelines.
Think of these features as your non-negotiable checklist. They are the absolute minimum you need to keep your data healthy and trustworthy.
The first and most critical capability is anomaly detection. This is your automated watchdog, constantly scanning for unexpected patterns in your data. Without it, you're flying blind, only discovering problems like a sudden spike in null values or a drop in data volume after they’ve already broken a dashboard or skewed an executive report.
Core Capabilities for Data Integrity
Next up is timeliness monitoring. You can think of it as a delivery tracking service for your data. This capability makes sure your data arrives when it's supposed to, alerting you to delays or missing updates long before business users start complaining about stale reports. It answers one simple but vital question: "Is my data fresh?"
Another key component is data validation. If anomaly detection is your watchdog, then validation is the bouncer enforcing your business rules at the door. It checks each record against specific, user-defined criteria—for instance, making sure a product ID actually exists in your master list or that a price is never a negative number.
Finally, you absolutely need schema tracking. This acts as a silent alarm that goes off whenever the structure of your data changes without warning. A recent cybersecurity study highlighted this exact risk, revealing that over 60% of data breaches in 2024 originated from silent data drift and unmonitored schema changes.
This diagram helps illustrate the different kinds of "free" tools where you're likely to find these features.

As you can see, "free" can mean a hands-on open-source project, a limited commercial tier, or a freemium plan. Each model offers these core capabilities to varying degrees. If you want to dive deeper, you might find our article on real-time data monitoring helpful.
Protecting Privacy and Performance
Beyond just detection, how a tool operates is just as important. In-database execution is a crucial architectural feature to look for, especially when you're dealing with sensitive information.
By performing all analysis directly within your own database or data warehouse, this approach minimizes data movement. It ensures your private data never leaves your secure environment—a vital consideration for any organization serious about data governance.
When choosing a solution, it's also wise to consider the broader principles of SaaS monitoring, which balance cost, performance, and security. For a great overview, check out LicenseTrim's guide to SaaS monitoring. Ultimately, these foundational capabilities—from anomaly detection to privacy-preserving execution—form the bedrock of any reliable monitoring strategy, whether it's free or paid.
So, how does this all work in practice? When you move from theory to the real world, you'll find that data teams rarely rely on a single free tool to do everything. It’s just not realistic. Instead, engineers assemble a "monitoring stack" by combining several specialized, often open-source, tools that work together.
Think of it like building a custom home theater system. You'd hand-pick the best receiver, speakers, and screen for your specific needs and then connect them to work in harmony. A free data monitoring stack is built on the same principle, integrating individual components for metrics, visualization, and alerting.
The Popular Prometheus and Grafana Stack
One of the most common combinations you'll see for Free Data Monitoring Software is the trio of Prometheus, Grafana, and Alertmanager. This stack is incredibly popular for a reason—it’s a battle-tested solution for monitoring general system health, application performance, and data pipeline metrics.
Here’s a quick breakdown of how they fit together:
Prometheus is the workhorse. It actively collects and stores time-series data by scraping metrics from your data pipelines and applications, such as job completion times, data processing volumes, or error counts.
Grafana is the visualization layer. It connects to Prometheus as a data source and lets you build powerful, interactive dashboards to see what’s happening in real time. This is where you turn raw numbers into actionable charts and graphs that make sense to a human.
Alertmanager, which integrates directly with Prometheus, handles the notifications. When Prometheus detects that a metric has crossed a predefined threshold (like a data pipeline job taking 50% longer than usual), Alertmanager steps in to send an alert to your team via Slack, email, or PagerDuty.
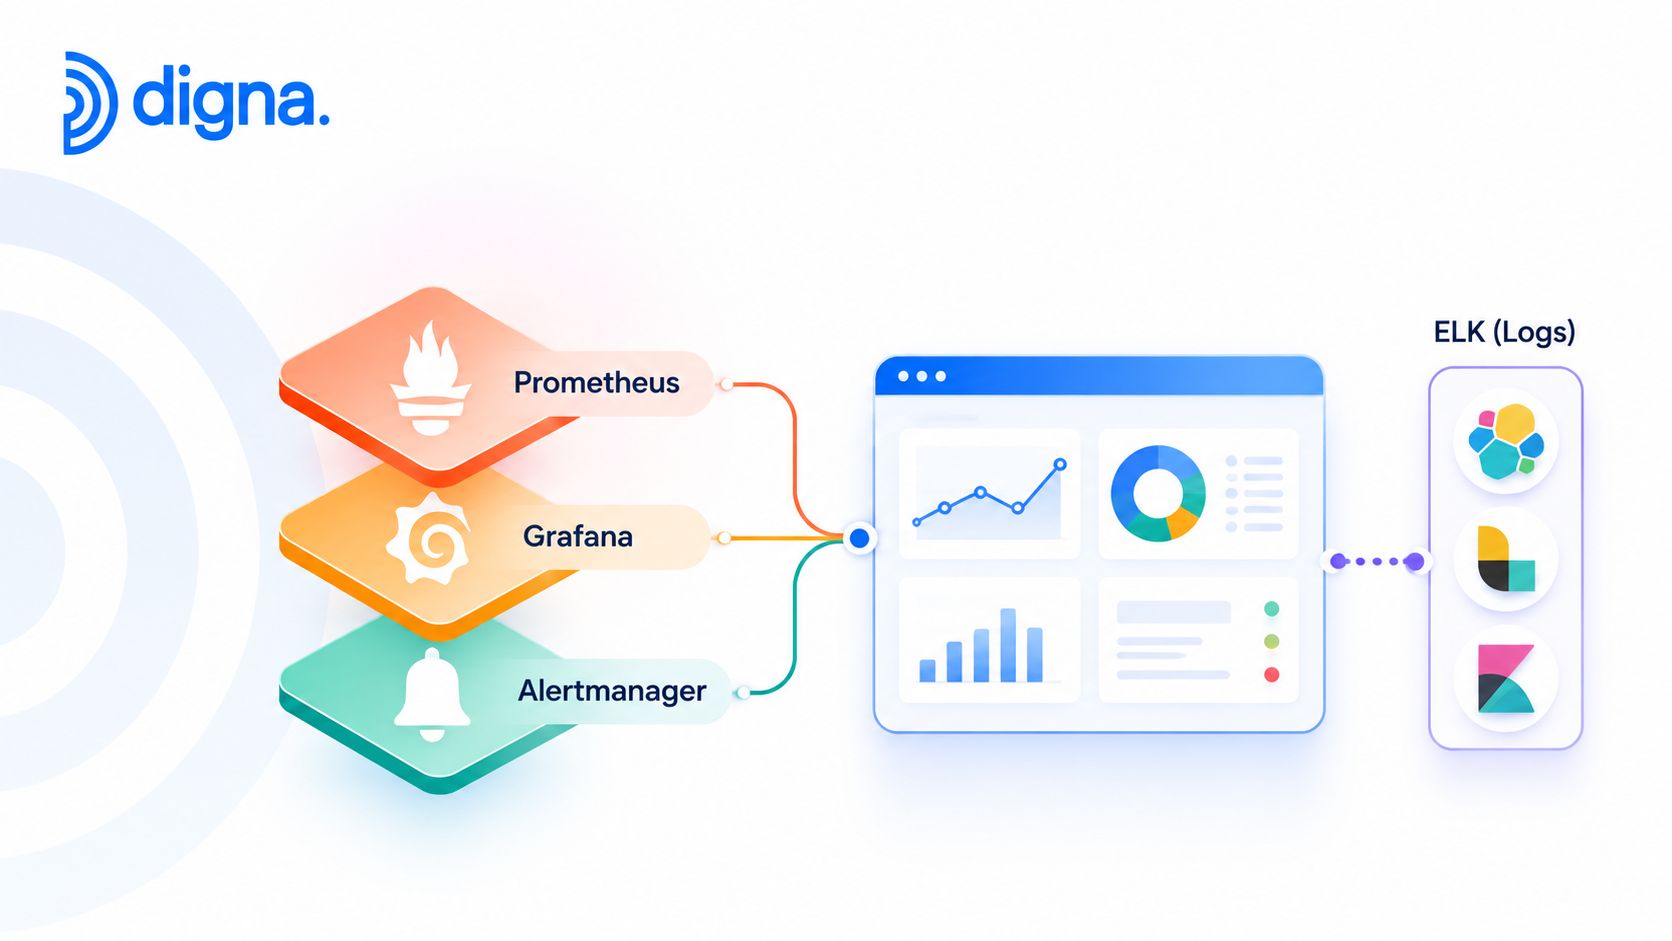
This setup provides a solid foundation for observing the health of your pipelines. But it has its limits. While it's great for showing you what happened, it doesn't always tell you why it happened. For that, you need to dig deeper.
Digging Deeper with the ELK Stack
When a dashboard breaks or a data load fails, metrics often just confirm the problem. To find the root cause, you need to analyze the logs. This is where the ELK Stack—Elasticsearch, Logstash, and Kibana—comes into play.
While Prometheus tracks the "what" (e.g., "the job failed"), the ELK Stack helps you discover the "why" by letting you search and analyze detailed logs from the failed process.
This powerful combination allows engineers to troubleshoot complex failures that metrics alone can't explain. For example, if a data validation step fails, you can use the ELK Stack to search the logs for the specific error message, tracing it back to the problematic records or a subtle bug in the code. You can find more on this in our dedicated article on free data validation tools.
Table of Contents
Weighing the Hidden Costs of Free Software
A "free" license rarely means zero cost, especially when it comes to sophisticated software. While the idea of a no-cost solution is always appealing, it’s crucial to look past the price tag and consider the total cost of ownership—the sum of all direct and indirect expenses that pile up over the software's lifecycle.
The biggest hidden investment is almost always engineering time. Open-source or disparate freemium tools demand a huge commitment from your data team for initial setup, ongoing maintenance, performance tuning, and just patching everything together. It’s like building a car from a kit versus buying one from a dealership; the kit is cheaper upfront but requires a massive investment of your time, expertise, and a garage full of specialized tools.
This DIY approach also creates a major operational headache. When you stitch multiple tools together, you often end up with a fragmented view of your data's health, making it nearly impossible to get a clear, unified picture when something inevitably goes wrong.
The True Price of 'Free'
The trade-offs don't stop with engineering hours. With most Free Data Monitoring Software, your support system is the community—forums, Slack channels, and GitHub issues. While often helpful, this is a world away from the dedicated, prioritized support that comes with an enterprise solution. When a critical data pipeline fails, you're left relying on community goodwill instead of a guaranteed service-level agreement (SLA).
It's important to recognize that even 'free' solutions can come with unforeseen expenditures, similar to how cheap design services might have hidden costs of cheap design.
This reality has fueled a booming market for free tools but also a growing awareness of their limits. In 2025, the global market for free data monitoring software grew by 34%, reaching a value of $1.8 billion. A 2026 GetApp survey further revealed that 71% of enterprise data teams now use at least one free statistical analysis or monitoring tool alongside commercial platforms, acknowledging that a hybrid approach is often necessary. You can discover more insights about data analytics software trends on GetApp.
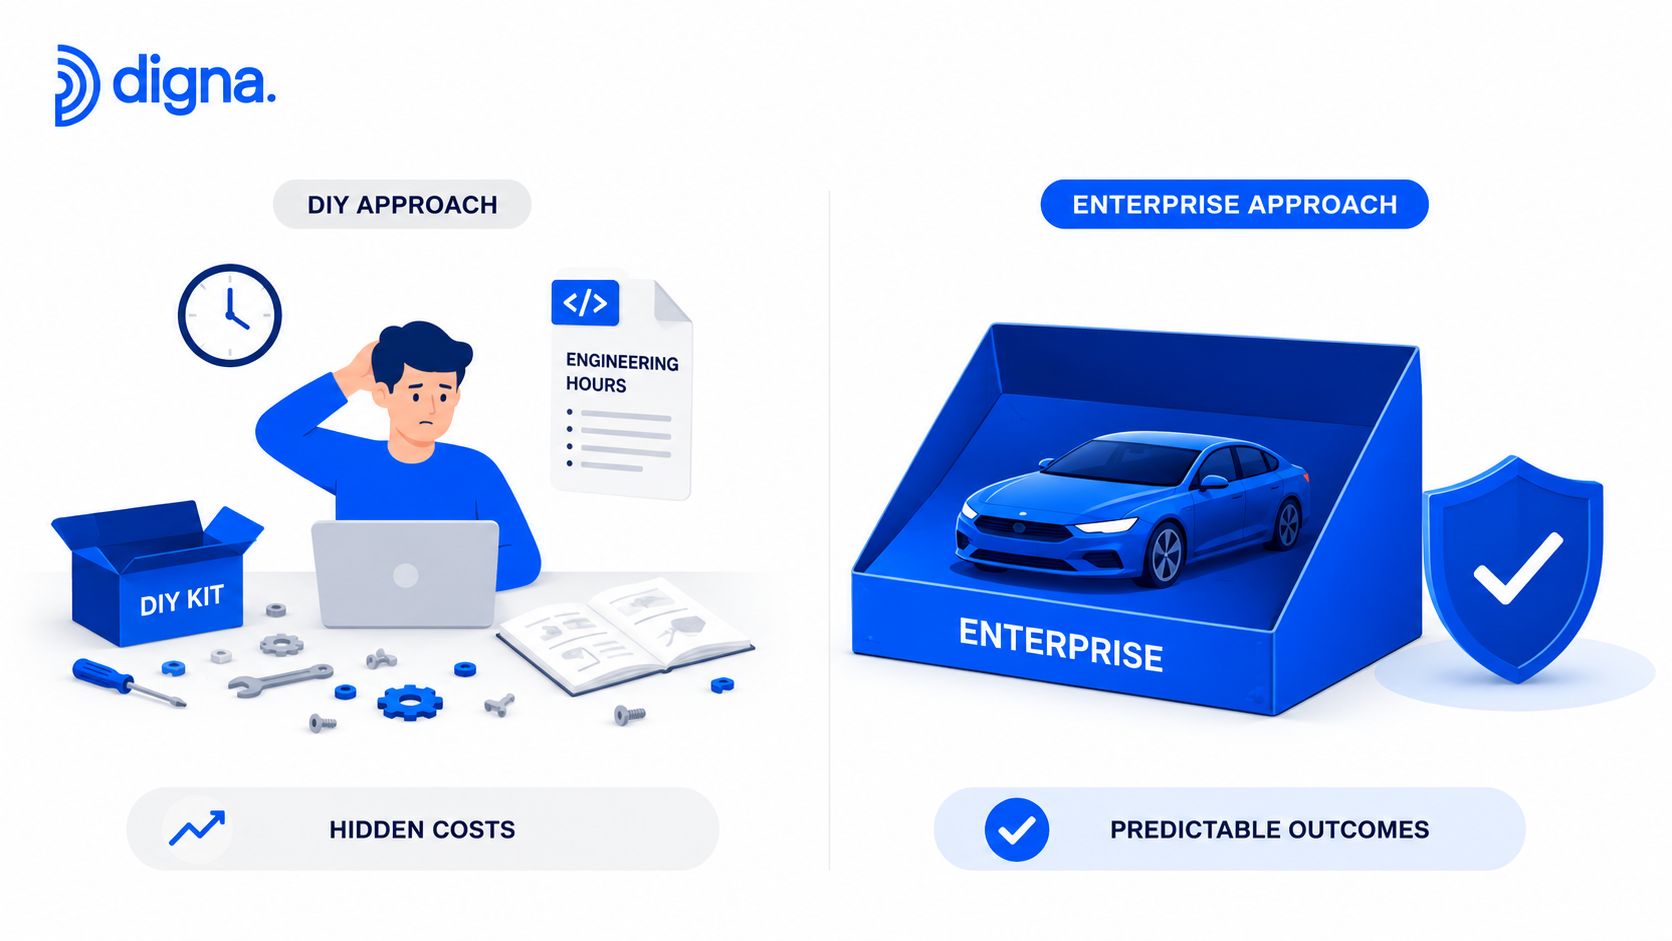
This illustrates the core choice teams face: invest heavily in internal resources to build and maintain a free stack, or adopt a managed solution that handles the complexity for you.
Calculating the Real Investment
To make an informed decision, you have to calculate the true cost. This means estimating the hours your engineers will spend on non-core activities that a commercial platform would simply automate.
The real cost isn't the software's license fee; it's the value of your engineers' time spent wrestling with tools instead of delivering insights. Every hour spent on maintenance is an hour not spent on building new data products or improving models.
Consider these factors when evaluating a free tool:
Setup and Configuration: How many engineering hours will it take to deploy, configure, and integrate the tool into your existing stack?
Ongoing Maintenance: Who is on the hook for updates, security patches, and performance tuning?
Training and Onboarding: How steep is the learning curve for your team, and what is the cost of that training time?
Understanding these hidden expenses is vital. To quantify the financial impact of data problems on your organization, use our data downtime cost calculator to see just how quickly the issues tied to "free" tools can add up.
Free tools are a fantastic entry point for any data team. They offer a way to get basic monitoring in place without needing an upfront budget. But as your data stack and team grow, you’ll eventually hit a wall where that free, do-it-yourself system starts creating more headaches than it solves.
Knowing when you’ve reached that tipping point is crucial. It’s the key to protecting your data's reliability without slowing your engineers down.
One of the first signs is when your engineers spend more time babysitting the monitoring system than acting on its insights. If your team is constantly patching broken integrations, fiddling with alerts to cut down the noise, or manually digging through a fragmented stack, they aren't building value. That time is a real, and very significant, hidden cost.
When Complexity Outgrows Your DIY Setup
Another clear trigger is the sheer complexity of your data ecosystem. A simple, self-managed setup might work fine for a few dozen tables. But when you’re dealing with hundreds or thousands across multiple data warehouses and lakes, that same setup quickly becomes a liability. The system feels brittle, slow, and impossible for anyone to get a clear picture from.
The moment data quality issues start to visibly impact revenue, erode customer trust, or make stakeholders lose faith in your analytics, the 'cost' of your free solution has become too high. At that point, an upgrade isn't just a technical decision—it's a business necessity.
This is the stage where moving to a modern, integrated platform like digna directly addresses these growing pains. Instead of wrestling with infrastructure, your team gets a unified system built for enterprise scale from day one.
The Business Value of an Integrated Solution
The biggest advantage of an enterprise platform is that it gives your team their time back. For instance, a platform like digna provides AI-powered anomaly detection right out of the box. This completely removes the need for your engineers to build, train, and maintain their own complex machine learning models just for monitoring.
This focus on efficiency also applies to security and governance. With free tools, ensuring data privacy can be a major headache, often requiring complex workarounds to keep data from leaving your environment. A platform designed for this challenge delivers key advantages:
A Unified View: All monitoring, from data freshness to validation checks, is in a single dashboard. This drastically cuts down the time it takes to find the root cause of a problem.
In-Database Execution: Platforms like digna run all computations directly inside your data warehouse. This architecture is fundamentally more secure because your sensitive data never leaves your control.
Dedicated Support: Instead of searching through community forums for answers, you have a dedicated support team ready to help you solve problems and fine-tune your monitoring strategy.
Ultimately, the decision to upgrade is an investment in your team’s productivity and the trustworthiness of your data. When the hidden costs of a free solution—measured in engineering hours, data downtime, and missed opportunities—start to outweigh the price of a commercial platform, you know it’s time to make the switch.
Making the Call: A Checklist for Choosing Your Path
So, how do you decide? Whether you’re looking at your first Free Data Monitoring Software or wondering if it's time to upgrade, the choice can be paralyzing. Let’s make this practical. This isn't just a generic checklist; it's a guide to structure the conversation your team needs to have.

The best choice is the one that fits your technical reality and your business goals. By asking the hard questions now, you can land on a solution that works for you today and scales with you tomorrow.
Data Monitoring Solution Evaluation Checklist
This is where the rubber meets the road. Use this table to walk your team through the key trade-offs. The goal isn't to find a single "right" answer, but to understand your priorities and capacity right now.
Evaluation Area | Key Question to Consider | Favors Free/DIY Solution If... | Favors Enterprise Solution (like digna) If... |
|---|---|---|---|
Team Resources | Do we have dedicated engineering hours to build, integrate, and maintain an open-source tool? | ...you have engineers with available bandwidth who are eager to own and customize the system. | ...your engineers are already stretched thin and you need a tool that works out of the box with minimal upkeep. |
Business Impact | What's the real, dollar-and-cent cost when our data is wrong or late? | ...data issues are annoying but don't halt core business operations or impact revenue directly. | ...bad data directly impacts customer trust, financial reporting, or critical operational decisions. |
Scalability | Will our data volume and complexity crush this tool in six months? | ...your data sources and volumes are relatively stable and not expected to grow exponentially. | ...you're rapidly adding new data sources, pipelines, or seeing exponential growth in data volume. |
Security & Compliance | Do we handle sensitive data that absolutely cannot leave our environment? | ...your data isn't highly sensitive and the tool's security model is "good enough" for your needs. | ...you require in-database execution, granular access controls, and a zero-data-exfiltration guarantee for compliance. |
Answering these questions honestly as a team will quickly show you whether a free, self-managed approach is a good fit or if the efficiency, security, and power of an enterprise platform like digna is the smarter investment. It's about being realistic about your resources and the true cost of data downtime.
Straight Answers to Common Questions
When data teams start exploring free data monitoring software, a few key questions always come up. Here are some straight answers based on what we see in the field.
What's the Real Downside of Most Free Tools?
The biggest limitation isn't a missing feature—it’s the massive, hidden total cost of ownership (TCO). While the software license is free, the cost in engineering hours for setup, configuration, and ongoing maintenance can be staggering. You're often left stitching together multiple tools just to get a partial view.
Beyond the setup, many free solutions simply lack the horsepower you need as you scale. They often don't have a unified interface, miss AI-powered anomaly detection, and come with zero enterprise support. These gaps become painful once data quality issues start directly impacting the business.
Can We Use Free Software to Monitor Sensitive Data?
You can, but you have to be extremely careful. The only safe way is to use open-source tools that you can deploy and manage entirely within your own private cloud or on-premises environment. Data privacy is non-negotiable, so you must guarantee the tool never sends any data or metadata to an external server.
This is why solutions built for in-database execution are so important. All the analysis happens inside your secure perimeter. But be warned: you are now solely responsible for securing, auditing, and maintaining this setup. It’s a major reason why companies in regulated industries eventually move to commercial platforms built from the ground up for enterprise security.
How Do We Know When We've Outgrown Our Free Solution?
The clearest sign is when your data engineers spend more time babysitting the monitoring tools than they do delivering value from the data itself.
Other tell-tale signs include:
Constant fire-drills caused by data quality incidents that break reports or derail AI models.
An inability to find the root cause of a problem quickly because you're juggling three different tools.
Hitting a wall with scalability as your data volumes keep growing.
Struggling to meet new compliance rules that your DIY setup was never designed for.
If the cost of data downtime and engineering burnout is higher than the license fee for a commercial platform, it’s time to upgrade.
Ready to move past the limitations of free tools? See how digna provides a unified, secure, and AI-powered platform to ensure your data is always reliable. Learn more at digna.ai.