Database Anomaly Detection: A Practical Guide
|
9
min. Lesezeit

The first sign is rarely a dramatic failure. A revenue dashboard stays green, the row counts look normal, and nobody pages the warehouse team, but a quiet upstream change has already pushed part of the data into a fallback path or changed the shape of a feed. By the time finance notices the forecast is off, the bad rows have already made their way into models, reports, and executive slides.
That's why database anomaly detection works better when you treat the warehouse itself as the monitored surface. The useful question isn't only whether a chart looks strange, it's whether the data's timeliness, shape, and distribution still match the baseline your consumers depend on. In practice, that means SQL-native feature extraction, baseline comparison close to the source, and alerting that understands context instead of screaming at every expected spike.
Table of Contents
When Silent Data Drift Breaks Your Reports
Extracting Detection Features With In-Database SQL
Start With Rolling Windows And Deltas
Choosing Between Statistical Baselines and AI-Driven Learning
Building Segment-Similarity Baselines for Repeating Workloads
Fingerprint Each Run In SQL
Detecting Schema Drift and Delivery Delays as One Signal
Treat Structure And Freshness Together
Designing Context-Aware Alerts That People Actually Trust
Wiring Database Anomaly Detection Into Your Observability Stack
Connect The Warehouse To The Incident Feed
When Silent Data Drift Breaks Your Reports
A finance team can trust the same daily revenue dashboard for weeks and still be wrong. One upstream schema rename, one branch in a transformation, or one type change in a source table can drop rows into a default path, so the dashboard still renders and the numbers still look tidy. The problem is that the denominator is now partial, and the organization is making forecasts on top of a filtered slice of reality.
Dashboard checks and dbt-style assertions fall short. Row counts can stay within a normal range while active customer IDs drift downward, a pipeline can arrive late without breaking outright, or a previously populated column can start turning up NULL in the wrong place. None of those patterns always trip a simple rule, but all of them can distort decisions.
A warehouse-native approach catches the issue at the source. Instead of waiting for downstream consumers to notice that something feels off, database anomaly detection compares the current state of the data with the way that table, metric, or pipeline normally behaves. That includes structure, freshness, and value distribution, not just whether the job succeeded.
Practical rule: if the data changed in a way that a dashboard can't explain on its own, your detection layer should live where the data is produced, not three tools downstream.
The historical lesson is clear. Early benchmarking already showed that anomaly detection quality is highly data-dependent, and a later benchmark at much larger scale made the same point with far broader coverage, testing 30 algorithms across 57 benchmark datasets and 98,436 experiments to study supervision level, anomaly type, and noise conditions (ADBench benchmark). The reason that matters in warehouses is simple, workloads differ, schemas drift, and baselines that work on one dataset can fail in production-like settings.
Extracting Detection Features With In-Database SQL
The fastest way to make anomaly detection useful is to keep the feature engineering inside the warehouse. If you export raw tables to a separate feature store first, you add latency, duplication, and another place for freshness to go stale before the detector even runs. SQL already knows how to calculate the signals you need, so use it.
Start With Rolling Windows And Deltas
For most warehouse checks, I start with rolling aggregates over 7-day and 28-day windows. Window functions like AVG, STDDEV, and COUNT give you a local baseline without leaving the database, and LAG plus simple diffs show period-over-period change directly in the query. That combination catches gradual decay, sudden jumps, and changes that only show up when you compare today with the same point in the prior cycle.
Percentiles matter too. A mean can stay flat while the median moves, especially in skewed business data, so PERCENTILE_CONT helps catch drift that average-based checks miss. Classical methods such as standard deviation, median absolute deviation, interquartile range, z-score, and modified z-score are still useful because they're transparent and cheap to compute on a live table (classical statistical methods).
If a metric is important enough to page on, it's important enough to compute next to the data, not after a batch export.
A practical pattern looks like this, on a fact table with a composite grain:
Partition by day and metric, so each signal has its own history.
Compute rolling baselines for mean, spread, and count.
Add lagged deltas for day-over-day and week-over-week change.
Persist the result into a features table that downstream jobs can read without recomputing everything.
SQL Pattern | Function Used | Signal Surfaced |
|---|---|---|
Rolling baseline | AVG, STDDEV, COUNT | Local trend, volatility, and missing volume |
Period delta | LAG, subtraction | Step changes and sudden regression |
Median drift | PERCENTILE_CONT | Distribution shift hidden by averages |
This is also where in-database execution pays off operationally. You avoid copying terabytes into another system, and you keep the detection logic close to the freshness signal. For an architectural comparison of this pattern, see the internal note on in-database data quality execution and safer external pipelines.
Choosing Between Statistical Baselines and AI-Driven Learning
Statistical baselines are still the right starting point for a lot of production tables. A moving mean plus standard deviation, median absolute deviation, interquartile range, and z-scores are easy to explain, easy to audit, and easy to run in SQL. They work especially well when a metric is stable, the seasonality is weak, and the business wants a clear threshold rather than a black box.
The weakness shows up as soon as the series becomes messy. Weekly cycles, holiday effects, and multivariate interactions make fixed thresholds brittle, and manual tuning turns into a maintenance chore. That's why learned baselines exist. They can absorb more context, handle seasonality better, and model relationships across columns or tables that a single univariate rule won't see.
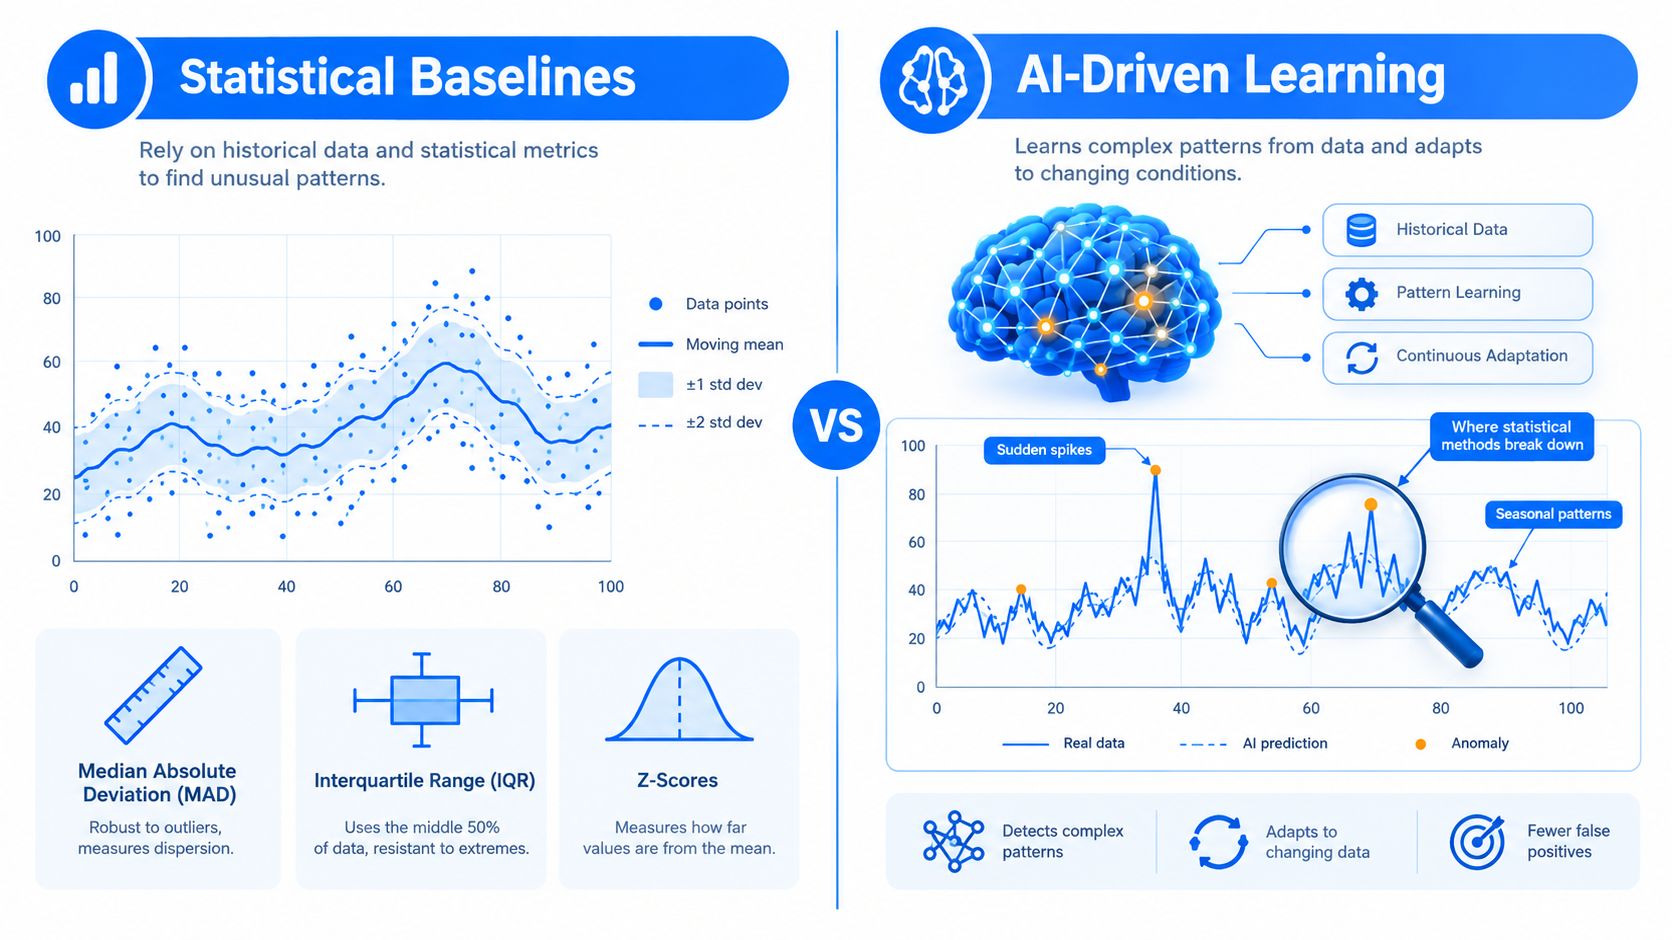
The trade-off is operational, not just mathematical. Learned models introduce a training pipeline, versioning, and drift in the model itself. They also make explainability harder when someone asks why a row-level or metric-level alert fired, which is a real problem in regulated environments where teams need defensible evidence, not just a score.
A useful benchmark framing is this. Statistical methods often catch roughly 60-70% of univariate anomalies with near-zero false positives on stable metrics, while learned baselines can push toward 85% recall but require more tuning. Those are internal reference points, not universal promises, but they match what most practitioners see when they move from hand-tuned thresholds to model-based detection.
If you want a practical starting place, use statistical baselines for per-metric thresholds and layered learned models for high-value, high-variance series. That approach lines up with the broader industry split between explainable rules and adaptive models, and it's also why resources like AI anomaly detection in social ops are useful reading even if your use case is a warehouse rather than a queue of customer events. For a deeper statistical framing, the internal material on statistical pattern recognition is a good companion.
Building Segment-Similarity Baselines for Repeating Workloads
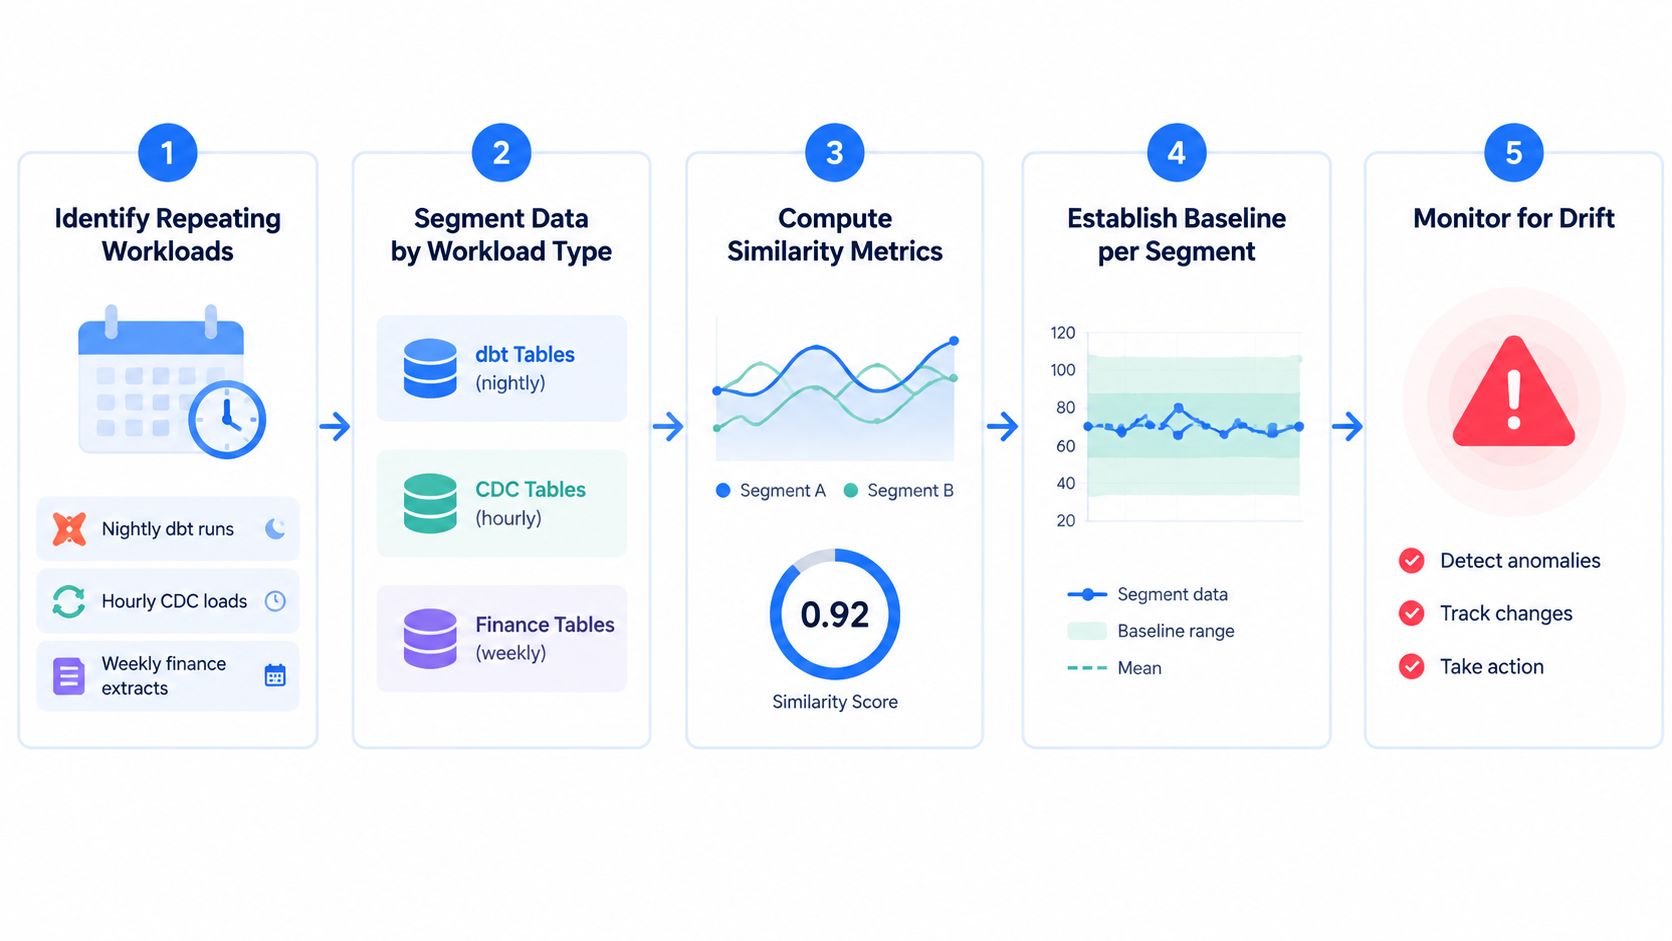
Repeated workloads need a different baseline than always-on metrics. Nightly dbt runs, hourly CDC loads, and weekly finance extracts all have a cadence, so the right comparison is usually not “today versus a generic mean,” it's “today versus the most similar historical segment.” That's how you separate actual drift from a Monday backfill or a Black Friday spike.
Fingerprint Each Run In SQL
Start by fingerprinting each completed run in the warehouse. I usually include row counts, a hash of key column distributions, null ratios, and a few numeric summaries from PERCENTILE_CONT or a warehouse equivalent. Those values give you a compact representation of the workload without dragging the entire table through the detector.
Store those fingerprints in a baseline_segments table keyed by job_id, day_of_week, and hour_of_week. Then compare the current window against the K most similar prior segments using a similarity metric on the fingerprint vector. If the similarity falls below a review threshold, such as 0.85, the run deserves a human look before it contaminates downstream consumers.
The logic is straightforward, but the benefit is subtle. You're not asking whether the workload is “normal” in the abstract. You're asking whether it's behaving like its own historical peer group, which is a much better fit for warehouses where seasonality is part of normal operation.
A baseline that ignores cadence will always over-alert on healthy periodic behavior.
The hard part is baselines that age out. When a workload legitimately evolves, the fingerprint library needs to be invalidated and rebuilt, or you'll compare new behavior against an obsolete history forever. That's a governance problem as much as a modeling problem, and it belongs in the same observability pipeline as the job itself.
For a practical reference on segmenting repeatable data behavior, the internal guide on data profiling techniques is relevant here.
Detecting Schema Drift and Delivery Delays as One Signal
Most monitoring stacks split structural change from freshness. That separation is convenient, but it hides breakage. A schema change can arrive on time and still break downstream casting, while a late file can look harmless until it cascades into a stale report and a missed SLA.
Treat Structure And Freshness Together
For schema drift, compare today's incoming schema to a baseline schema and classify the differences. The concrete sets are missing columns (Β\I), new columns (I\B), and type mismatches in shared fields (schema drift detection pattern). If missing columns or type mismatches appear, you're looking at a breaking change. If only new columns appear, the change is additive.
Timeliness should sit beside that check, not below it. A freshness monitor can classify each delivery as early, late, missing, or partial, and a schedule can be explicit, such as every weekday before 7:30 AM (data timeliness monitoring). When the actual arrival time drifts too far from expectation, the delivery state becomes part of the alert, not a separate dashboard nobody opens.
Signal Type | What It Catches | Primary SQL Source | Typical Alert Latency |
|---|---|---|---|
Schema drift | Added, dropped, or type-changed columns | INFORMATION_SCHEMA diffs | Immediate on ingest |
Delivery delay | Late, missing, early, or partial loads | Arrival timestamps and freshness tables | At schedule breach |
Combined breakage | Structural change plus freshness regression | Joined schema and freshness checks | Near real time |
A real-world example makes the value obvious. If a vendor widens a string column to VARCHAR(500) and a downstream numeric cast starts failing on a slice of rows, the schema check should fire before the report lands. A volume-only check would likely wait until the next day, which is too late for operational triage.
This is the kind of case where a platform like digna can be used as one option among others, because it combines timeliness, schema tracking, and in-database checks in a single operating model. The internal explainer on schema drift and structural changes that break data pipelines fits this pattern well.
Designing Context-Aware Alerts That People Actually Trust
More alerts don't mean better detection. They usually mean alert fatigue, and once a team is getting hammered with noisy pings, the useful page gets ignored right alongside the junk. A team that sees 40 Slack pings per day will start muting channels, and that's how real outages hide in plain sight.
The fix is context-aware alerting. Suppress known deploy windows with a deploy_event table, downgrade severity when a deviation lines up with a scheduled batch change, and require a second corroborating signal before paging on-call. That corroboration can be another metric, a schema change, or a freshness regression, depending on the workload.
The payload itself should explain the alert. Include the baseline segment used, the z-score or similarity value, and the top contributing features so the engineer can triage fast. If the on-call person has to reconstruct the context from three different dashboards, the alert isn't production-ready.
Practical rule: if an engineer can't understand the alert in under a minute, the alert is too thin.
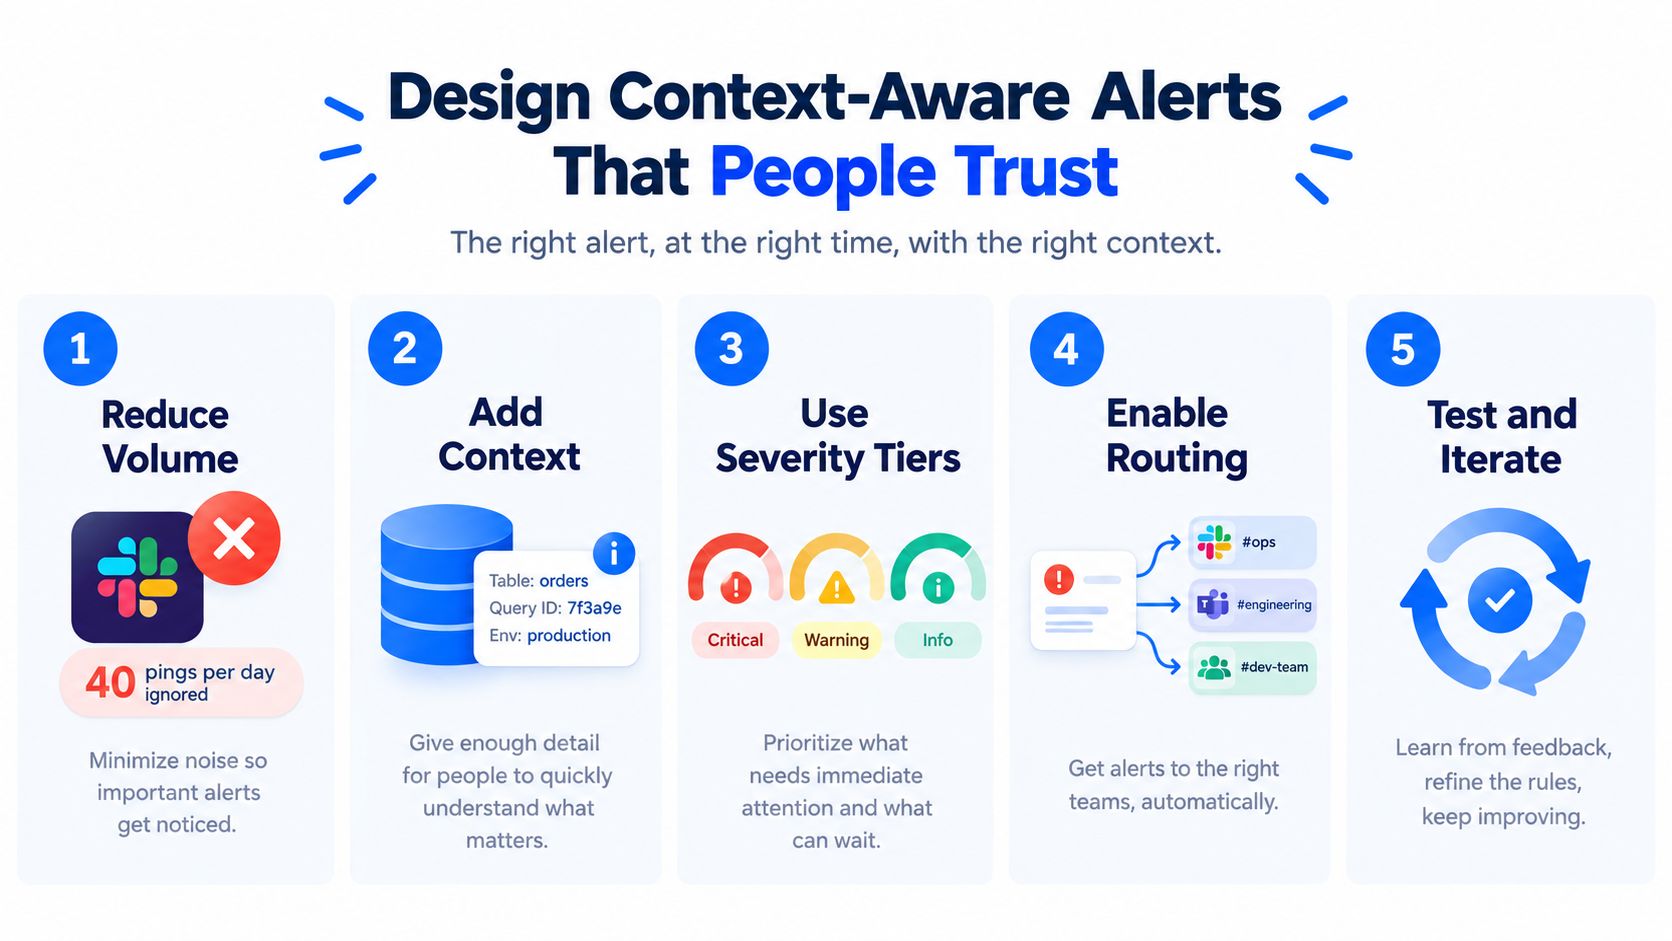
The operational target should be fewer than 5 high-signal pages per week per critical table, with trust measured by the ignored-alert rate rather than the total alert count. That framing changes the conversation from “How many alerts did we fire?” to “Which alerts were worth waking somebody up for?” For more on how operational teams route and interpret these signals, the Sift AI piece on anomaly detection in social ops is a good comparison point even though the domain is different.
Wiring Database Anomaly Detection Into Your Observability Stack
Anomaly signals shouldn't live on a lonely dashboard. Treat them as telemetry, tag them with table, schema, and run_id, and push them into the same observability path as application and infrastructure metrics. That way, a broken load, a deploy, and a spike in infra errors sit in the same incident timeline instead of three different tools.
Connect The Warehouse To The Incident Feed
Warehouse-native schedulers are usually the cleanest place to run the feature queries. Snowflake tasks, BigQuery scheduled queries, dbt tests, and Airflow sensors all fit the pattern, as long as the cadence matches the freshness expectations of the data. The anomaly event can then flow through OpenTelemetry or a native exporter into PagerDuty, Slack, or whatever canonical alerting gateway the on-call team already trusts.
The trade-off is obvious. Pull-based REST pollers are simple, but they're laggy. Event-based emitters on write completion catch issues faster, but they create coupling between the producer and the monitoring path, which means more engineering discipline is needed around retries, deduplication, and ownership.
A practical rollout order helps keep this sane:
First, compute features in SQL and persist them.
Second, tag every event with the data asset and run metadata.
Third, wire alerts into one canonical incident stream.
Fourth, correlate anomalies with deploys, feature flags, and upstream ETL jobs.
Last, tighten routing so only the highest-signal pages reach humans.

The internal data observability overview is relevant here because it frames anomaly detection as one part of a larger operating system, not a standalone alert generator. That's the right mental model for production warehouses, and it's the one that keeps people from building another noisy dashboard nobody owns.
If you're putting database anomaly detection into production, start with the checks that live closest to the data, then layer context, explainability, and routing on top. digna supports in-database anomaly detection, timeliness monitoring, schema tracking, and observability workflows inside the customer's own environment, so it fits teams that want the detection logic where the data already lives. Visit digna to see how that approach maps to your warehouse, your pipelines, and your alerting stack.


