Data Quality Solutions: The 2026 Buyer's Guide
|
7
min read

You've probably seen this failure already. Friday's dashboard looked clean, Monday morning's numbers don't reconcile, and the BI team is stuck tracing a bad load, a late source table, or a schema change nobody announced. By the time someone trusts the report again, the model has already produced suspect outputs, and the business has stopped acting on the data.
Table of Contents
The Quiet Failure Inside Most Data Platforms
The failure rarely looks dramatic. A warehouse still loads, dashboards still render, and alerts stay quiet. Then an analyst notices a weekend source arrived late, a dimension table changed shape, or a metric drifted just enough that finance and ops no longer agree on the number.
That's where data quality solutions changed from a back-office cleanup utility into an observability layer for production data. Modern coverage now treats the category as a platform class with continuous monitoring, validation, and anomaly detection across analytics and AI pipelines, not just a tool for fixing records after someone complains. Gartner's definition captures that broader scope as a “set of processes and technologies for identifying, understanding, preventing, escalating and correcting issues in data” that support decision making and governance across business processes (Atlan's market framing of data quality solutions).
What breaks first in production
The first thing that fails is usually trust, not the pipeline. A model can keep scoring, but once the inputs drift, the output becomes hard to defend. A BI dashboard can keep refreshing, but if freshness or schema drift changes the meaning of the numbers, teams stop using it even before anyone proves the root cause.
Practical rule: if users ask whether a dashboard is “right” more often than they ask what it means, the platform needs observability, not another batch cleanse.
The older model assumed quality work happened in scheduled cleanup jobs. That doesn't hold in cloud warehouses, mixed batch and streaming estates, or AI workflows where data changes faster than rule sets get maintained. The market shift matters because data quality is now tied to timeliness, schema change detection, and AI-ready governance, which is why buyers are evaluating these platforms as part of the operating fabric of the data stack, not as an afterthought.
What Data Quality Solutions Actually Do
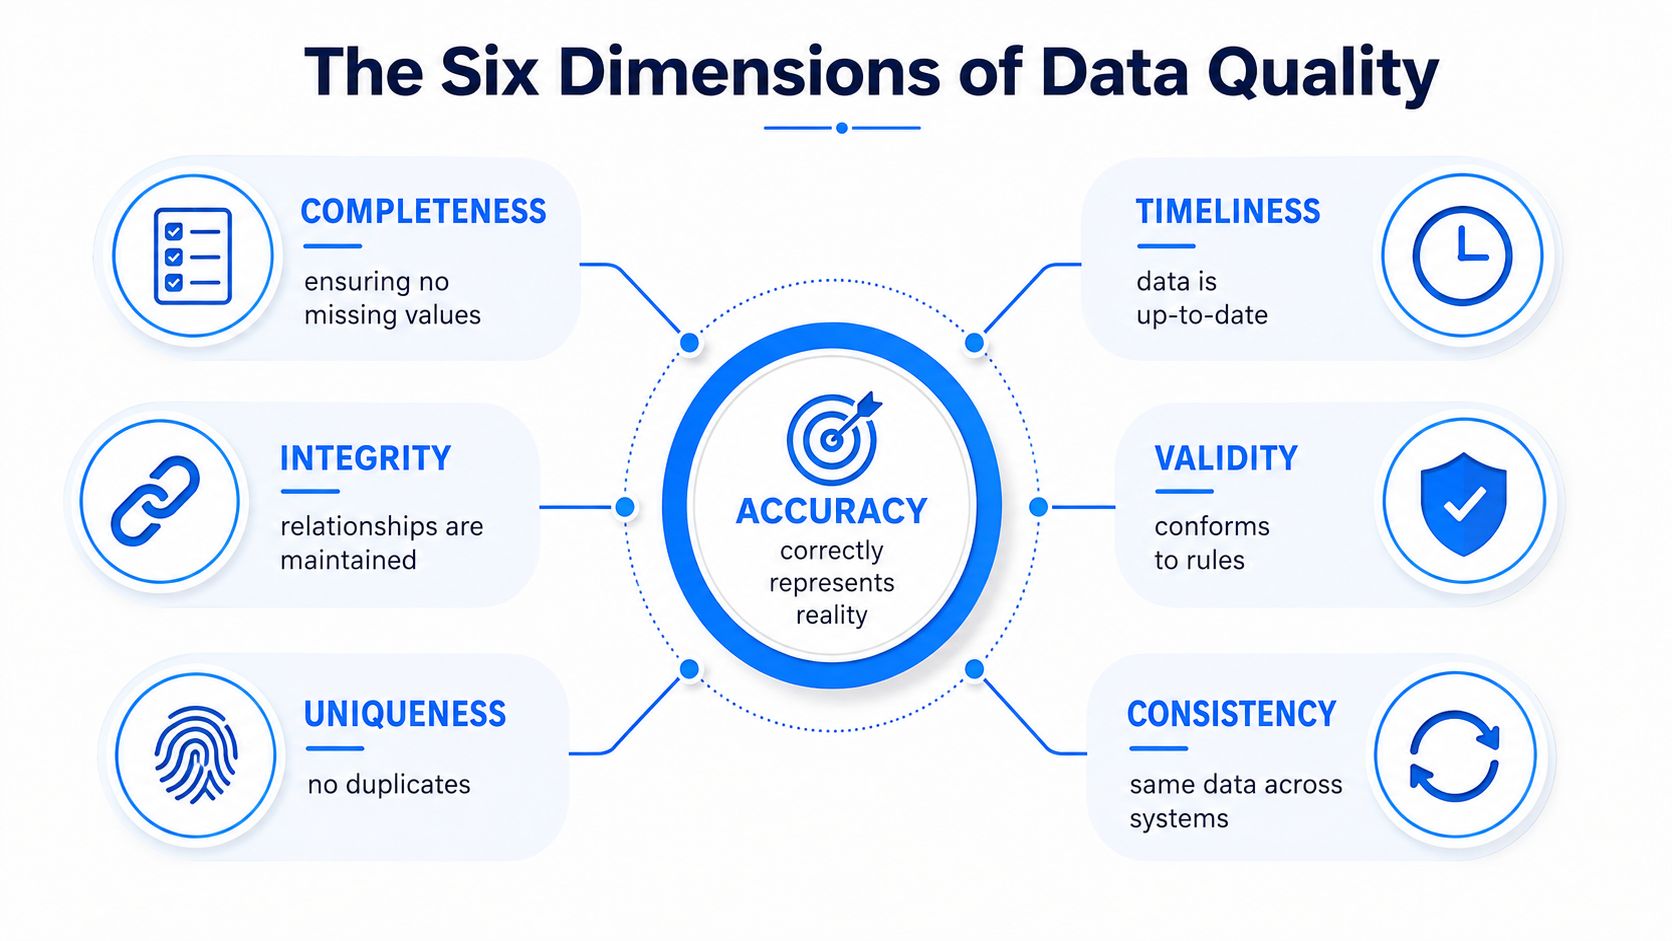
At a technical level, the category became measurable when the field stopped treating quality as a vague judgment call. The Data Quality Assessment Framework organizes quality into completeness, timeliness, validity, integrity, uniqueness, and consistency, while broader guidance often adds accuracy and accessibility as supporting characteristics (Alation's overview of data quality frameworks).
The six dimensions in a live warehouse
A practical platform doesn't just say “this table is bad.” It measures what's wrong.
Completeness checks whether required values are missing.
Timeliness checks whether data arrived when it should have.
Validity checks whether values conform to rules, formats, and allowed ranges.
Integrity checks whether relationships across tables still hold.
Uniqueness checks whether duplicates are appearing where they shouldn't.
Consistency checks whether the same concept matches across systems.
That framework matters because it turned quality into an engineering problem. A data quality score can be built from dimensions like accuracy, completeness, consistency, timeliness, validity, and uniqueness and combined into a weighted percentage, which is how engineering teams and business stakeholders can look at the same signal without reading the same query logic.
The working vocabulary buyers should use
The easiest way to evaluate vendors is to ask which dimensions they measure, how they measure them, and what they do when the metric shifts. If a platform can't express missing values, invalid formats, duplicate rates, or freshness thresholds in a way your team can act on, it's not doing quality work in production.
Use this data quality metrics guide to map dimensions to operational checks before you compare tools.
The reason this became a software category is simple. Once quality becomes a set of metrics with baselines, thresholds, and drift, it can be monitored continuously. That's very different from cleaning data after a report goes wrong.
The Four Technical Components That Matter
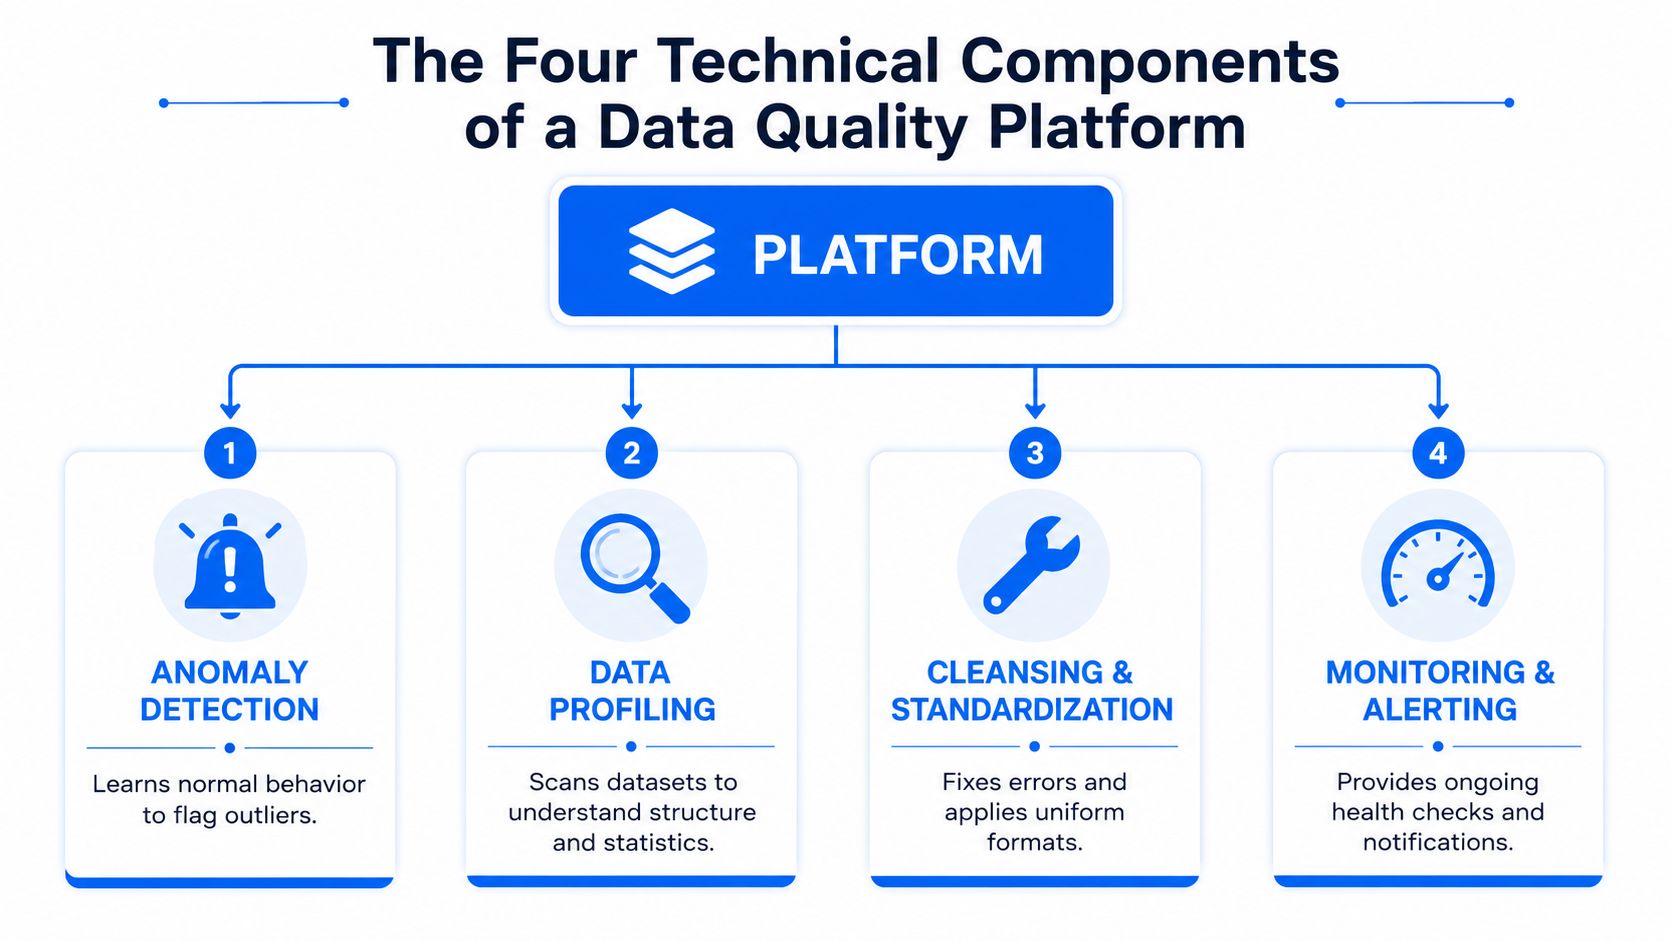
Most production platforms live or die on four capabilities, and they're not all interchangeable. Anomaly detection, timeliness, validation, and schema tracking solve different failure modes, and a good platform knows which one to apply first.
Anomaly detection and validation aren't the same thing
Anomaly detection learns what normal looks like, then flags deviations in volume, distribution, or behavior without forcing a human to write a new rule for every field change. Gartner describes modern augmented data quality solutions as combining profiling and monitoring with AI/ML, graph analysis, and metadata analytics to detect outliers, anomalies, patterns, and drifts across on-premises, cloud, relational, nonrelational, batch, and streaming sources (Gartner on augmented data quality solutions).
Validation is narrower and more explicit. It checks whether a row meets a known business or technical rule, which is ideal when the expectation is stable, such as a code format, a required field, or a bounded value.
A useful split is this, anomaly detection finds the thing you didn't know to look for, validation enforces the thing you already know should be true.
Timeliness and schema tracking catch different outages
Timeliness monitors expected arrival windows and delay detection. If a source load usually lands by a certain time and misses that pattern, the platform should surface it before the stale data reaches a dashboard or ML feature store. Schema tracking watches for added columns, removed columns, and type changes, which are often the reason downstream transforms fail or produce wrong joins.
The big value is not just detection, it's triage. Industry guidance recommends pairing profiling, freshness checks, and lineage-aware root cause analysis so teams can tell whether the issue came from source delay, transformation failure, or downstream drift (lakeFS guidance on data quality tools). That shortens incident response because the alert points to the failure class, not just the symptom.
How the four map back to the quality dimensions
Anomaly detection usually helps with consistency, integrity, and sometimes completeness. Timeliness maps directly to timeliness. Validation covers validity and parts of accuracy. Schema tracking protects consistency and often explains failures in integrity downstream.
That mapping is the mental model worth keeping. A vendor can have strong validation and still miss late data. Another can spot anomalies quickly and still ignore business rules. Production systems need both coverage and placement.
Where the Quality Engine Runs
Architecture is the core buying decision. If the quality engine runs in the wrong place, the platform can be technically capable and still fail security review, create latency, or break residency requirements.
Three execution models behave very differently
In-database execution keeps checks inside the customer's warehouse or database. That usually means less data movement, lower exposure, and faster inspection because the data doesn't leave the system of record. It also fits well when teams want metric computation to stay close to the data and when privacy teams insist on tight control.
Vendor-managed SaaS centralizes processing in the vendor's environment. The upside is simpler managed operations, but the trade-off is obvious, data has to cross a boundary, which raises questions about access, residency, and what exactly is being copied or transformed.
Hybrid deployments split the work. Some checks stay close to the data, while broader orchestration, alerting, or metadata workflows live elsewhere. This can work well, but only if the platform makes the split explicit enough that engineers can reason about latency and security.
The first architecture question is not “what features do you have?” It's “where does the data go, and who can see it?”
Why regulated industries ask different questions
Finance, healthcare, telecom, and the public sector usually care less about a long feature checklist and more about the operational consequences of deployment. Can the vendor process data without exposing production rows? Can the platform run in private cloud or on-prem? Does the model add unnecessary pipeline overhead? Can it keep data resident in the customer environment?
That's the gap in most market pages. They mention monitoring, governance, and lineage, but they rarely force the deployment question up front. For regulated buyers, that omission is costly because the wrong topology can block the purchase long before the technical evaluation finishes.
Questions that surface architectural risk fast
Where does processing happen? If it leaves your cloud boundary, explain why.
What data is copied? Metadata is one thing, production records are another.
Can it run in your environment? Private cloud and on-prem are not optional in many enterprises.
What happens to latency? Extra hops matter when pipelines are already tight.
The right answer depends on the workload, but the architecture should be legible before anyone talks about dashboards.
Choosing by Workload Not by Feature List
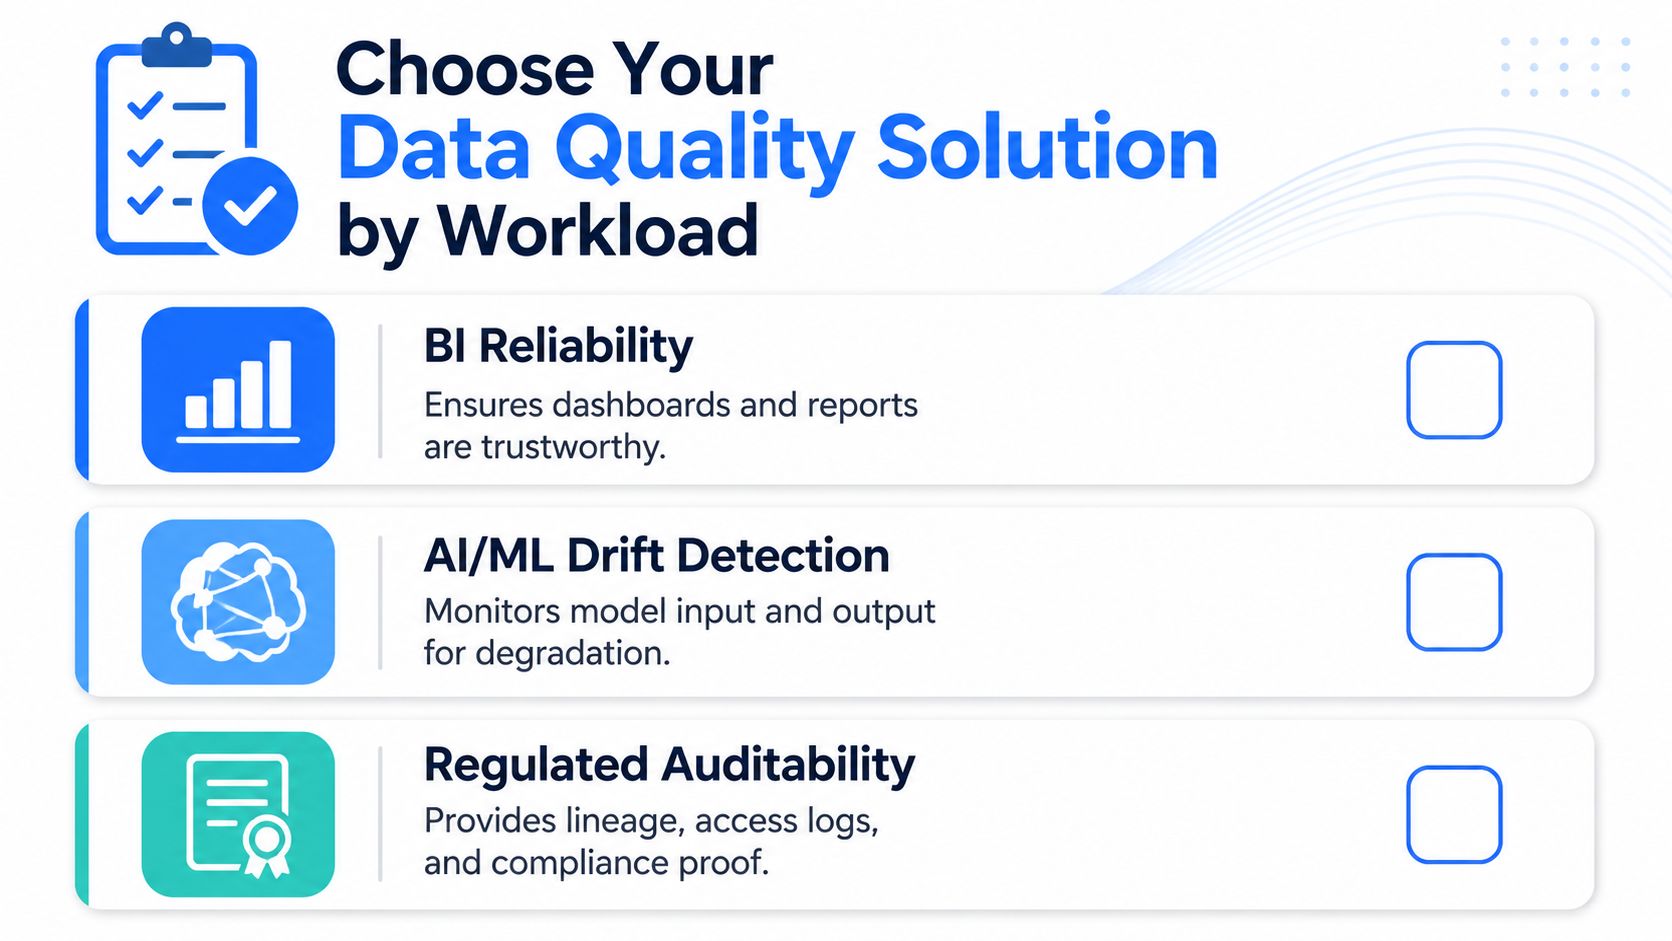
Feature checklists hide the core decision. BI reliability, AI drift detection, and regulated auditability don't need the same mix of controls, and buying the wrong blend usually means one of two outcomes, too many alerts or too little signal.
Match the workload to the control surface
For BI reliability, timeliness and validation matter first. Dashboards break most often when a source is late, a feed is incomplete, or a business rule changes underneath the report. A platform should make stale loads visible early and keep bad rows from reaching executive reporting.
For AI and ML drift detection, anomaly detection and schema tracking carry more weight. Models can tolerate some variation, but they can't tolerate silent distribution shifts forever. When hundreds of tables change over time, static rules don't keep up, and statistical learning becomes the practical option.
For regulated auditability, validation, integrity, lineage context, and audit trails dominate. The goal isn't just to catch a bad record. It's to prove what was checked, when it was checked, and what logic was applied.
The organizational piece decides whether the tool survives
MIT researchers describing data-quality management identified five critical success factors, certifying existing corporate data, standardizing data definitions, certifying external sources, controlling internal generation, and providing data auditability. They also described a five-part operating model built around business-aligned vision, central responsibility in IS, education for project and systems managers, training for the whole IS organization, and continuous improvement (MIT's data-quality management paper).
That's not abstract governance advice. It tells you why some deployments get adopted and others get abandoned. If ownership is unclear or audit trails are weak, the tool becomes another place alerts go to die.
A short shortlist checklist
Name the workload first. BI, AI, or audit use cases demand different signals.
Check the weakest dimension. Late data, bad schema changes, or rule violations usually reveal the gap.
Ask who owns the exceptions. If no one owns follow-up, the platform will age badly.
Confirm auditability. You need the trail, not just the alert.
Verify the operating model. Continuous improvement beats one-time cleanup every time.
From Proof of Value to Production
The fastest proof-of-value demo usually hides the hardest production work. A platform looks great when someone points it at a clean sample table, then stalls when it has to learn baselines, integrate with pipelines, and support the people who own the data.
The implementation sequence that actually works
Start with baseline learning on historical data. That gives the platform normal ranges, expected distributions, and arrival patterns instead of forcing every check to begin as a hard-coded rule. Then configure the datasets and metric tables you want to watch, because production systems need a clear inventory of what is being monitored.
Next comes validation rule setup. Teams encode the business expectations that can't be inferred statistically, such as allowed formats, required values, and cross-field checks. After that, integrate the platform into ingestion and transformation paths so checks run where failures happen, not only after the warehouse is already polluted.
Where teams usually stall
Most stalls happen at handoff. Data engineers own the pipeline, analysts own the dashboard, and the business owns the process, but no one owns the exception queue. When alerting is too noisy or the UI is too technical, people stop opening it. When the system requires separate tools for timeliness, validation, and schema change tracking, routine monitoring becomes a chore instead of a habit.
Practical rule: if the first month requires a specialist for every new table, self-service adoption will struggle.
What the platform should produce along the way
You want learned distributions, scheduled freshness checks, schema snapshots, and a shared view of trends that analysts and engineers can both read. A good rollout also makes incident review easier, because the team can compare yesterday's baseline to today's failure without reconstructing the whole pipeline from memory.
The monitoring workflow matters because production quality is a loop, not a one-time setup. The platform has to keep learning, keep alerting, and keep enough history to explain what changed.
How This Comes Together in digna
The enterprise problem is not hard to name. Reports go stale, models drift, and schema changes slip through because the checks live in too many places. A platform only helps if it ties anomaly detection, timeliness, validation, and schema tracking into one operating model that stays close to the data.
What the platform pieces do together
digna Data Anomalies learns normal behavior and flags unexpected changes without requiring constant rule maintenance. digna Data Analytics examines historical observability metrics so teams can see trends, shifts, and patterns instead of a single point-in-time alert. digna Timeliness monitors arrival against learned patterns and user schedules, which is what catches late or missing loads before the business feels them.
digna Data Validation enforces record-level rules for business logic and audit requirements, while digna Schema Tracker flags added, removed, or type-changed columns. That combination maps cleanly to the quality dimensions discussed earlier, especially completeness, timeliness, validity, integrity, uniqueness, and consistency.
Why the execution model matters here
The architectural choice is what makes the product relevant for regulated environments. In-database metric computation keeps data resident in the customer environment, and deployment in private cloud or on-prem means the vendor doesn't access production datasets. That reduces data movement and makes privacy and residency conversations much easier to have with security teams.
The unified UI also matters in practice. When engineers, analysts, and stakeholders can see the same trend line, alert, and schema history, teams spend less time reconciling tools and more time fixing the pipeline. That's the value of combining observability and quality in one place, fewer seams between detection, explanation, and action.
The One Question That Should Drive Your Shortlist
Most buyer debates start with features and end with architecture concerns that should've come first. The better question is simple, does this solution run where our data lives, fit our security and governance model, and tell us about problems before the business does?
If the answer is yes, then confirm the rest in order. Check the execution location. Check vendor access to production data. Check coverage of anomaly detection, timeliness, validation, and schema tracking. Check fit for the workload that triggered the evaluation. Check that the operating model can support continuous improvement instead of one-time cleanup.
Modern data quality solutions are no longer narrow cleansing tools. They're operational platforms for observability, schema change detection, timely monitoring, and AI-ready governance. If your shortlist can't explain those pieces in the context of your environment, it's not ready for production.
If you want a platform built around in-database quality checks, private deployment, and continuous monitoring of anomalies, timeliness, validation, and schema change, take a look at digna. It's designed for teams that need data quality to stay inside their own environment while still giving engineers and stakeholders one place to inspect what changed and why.


