Data Quality Integration Guide for Enterprise Platforms
|
7
min read

Your warehouse says the load succeeded. The dashboard still looks wrong. Finance has already noticed the stale revenue chart, engineering is chasing a schema change nobody logged, and the data team is staring at alerts that keep coming in long after anyone has the context to act. That is the everyday shape of data quality integration in a modern stack, and it is why bolt-on checks keep breaking down once schemas, sources, and business rules start changing all the time.
Table of Contents
Why Data Quality Integration Matters Now
Teams often don't fail because they lack checks. They fail because the checks live in the wrong place. A separate monitoring layer can catch bad data after it has already landed, replicated, transformed, and reached a dashboard that someone trusts, which is too late for the easy fix and too early for the business to forgive the mistake.
That is why quality now belongs inside the integration layer. The market around integration keeps expanding, with one estimate putting global data integration at $14.33 billion in 2026 and $22.17 billion by 2031, while another projects $17.58 billion in 2025 to $33.24 billion by 2030, which signals that integration is becoming the place where validation, timeliness checks, and schema tracking live rather than where raw movement happens alone (Peliqan data integration stats). In the same source, 64% of organizations say data quality is their top data integrity challenge, which explains why teams are folding controls into pipelines instead of asking analysts to catch defects downstream.
Why bolt-on monitoring keeps failing
Alert fatigue is usually the first warning sign. When operators are already buried under too many notifications, another rule engine just adds noise, especially if the system can't tell the difference between a real breakage and a harmless deviation in business activity. The deeper problem is that static rules age badly when sources, schemas, and load patterns shift together.
The better pattern is to compute controls where the data moves, not where people later inspect it. That makes incident handling faster because lineage, freshness, and validation signals point to the same pipeline stage instead of sending teams on a scavenger hunt across tools. It also reduces the cleanup gap, since integration failures are easier to isolate before they fan out into BI, ML, and operational exports.
Practical rule: if the defect can be detected before the data leaves the pipeline, check it there first.
Core Architecture and Quality Dimensions
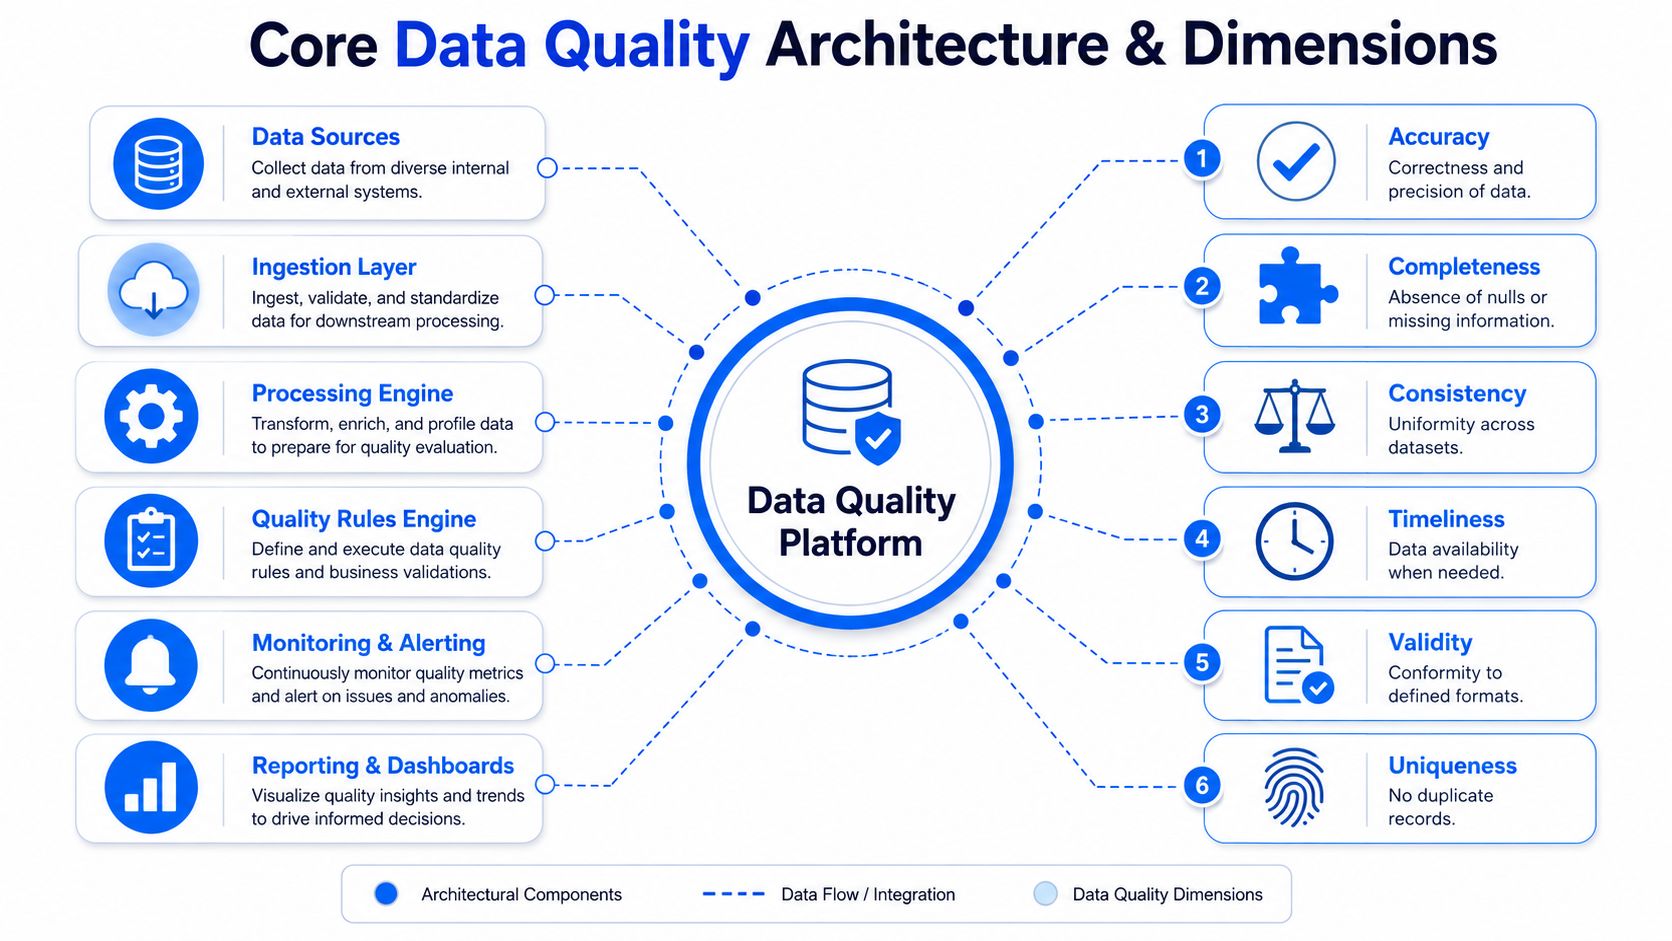
The right architecture depends on what you need to catch, how quickly you need to catch it, and how much control you need to preserve. Modern data quality integration usually lands in one of three patterns, in-database metric computation, external scanner services, or pipeline-embedded checks, with hybrid designs becoming the most practical option for enterprise stacks.
The common evaluation lens is still the same six dimensions, accuracy, completeness, consistency, timeliness, validity, and uniqueness (academic review of integration workflows; widely used data quality framework). Those dimensions give you a clean way to compare architectures without getting lost in vendor language or dashboards full of vanity metrics. They also keep the conversation anchored in what the business feels, missing records, late arrivals, duplicate keys, and incompatible values across systems.
Where each architecture fits
In-database checks work well when you want data to stay resident in the customer environment and avoid moving sensitive records into another service. That pattern is strong for privacy-sensitive stacks, regulated environments, and environments where low-latency anomaly detection matters more than UI polish.
External scanner services make sense when you need broad scanning across many sources and don't mind shipping metadata or extracts to a separate service. They're often easier to roll out quickly, but they can become a second operational surface if every schema change or rule update has to be mirrored outside the warehouse.
Pipeline-embedded checks are the most direct for validating records at ingestion or transformation time. They're useful when the failure mode is obvious, such as rejecting malformed payloads, but they can get brittle if every new business rule becomes a hard-coded gate.
A hybrid model is usually the least painful in production. Statistical baselines and anomaly detection handle shifting patterns, while explicit validation rules cover business logic that auditors care about. That's also where adaptive baselining matters more than a pile of static rules, because a warehouse does not stay still long enough for old thresholds to remain trustworthy forever.
This guide to data quality dimensions and measurement is a useful companion if you want to map the six dimensions to concrete KPIs without over-instrumenting every table.
Key takeaway: use static rules for things that must never change, and use baselines for the patterns that naturally drift.
Integration Points Across Warehouses Lakes and Pipelines
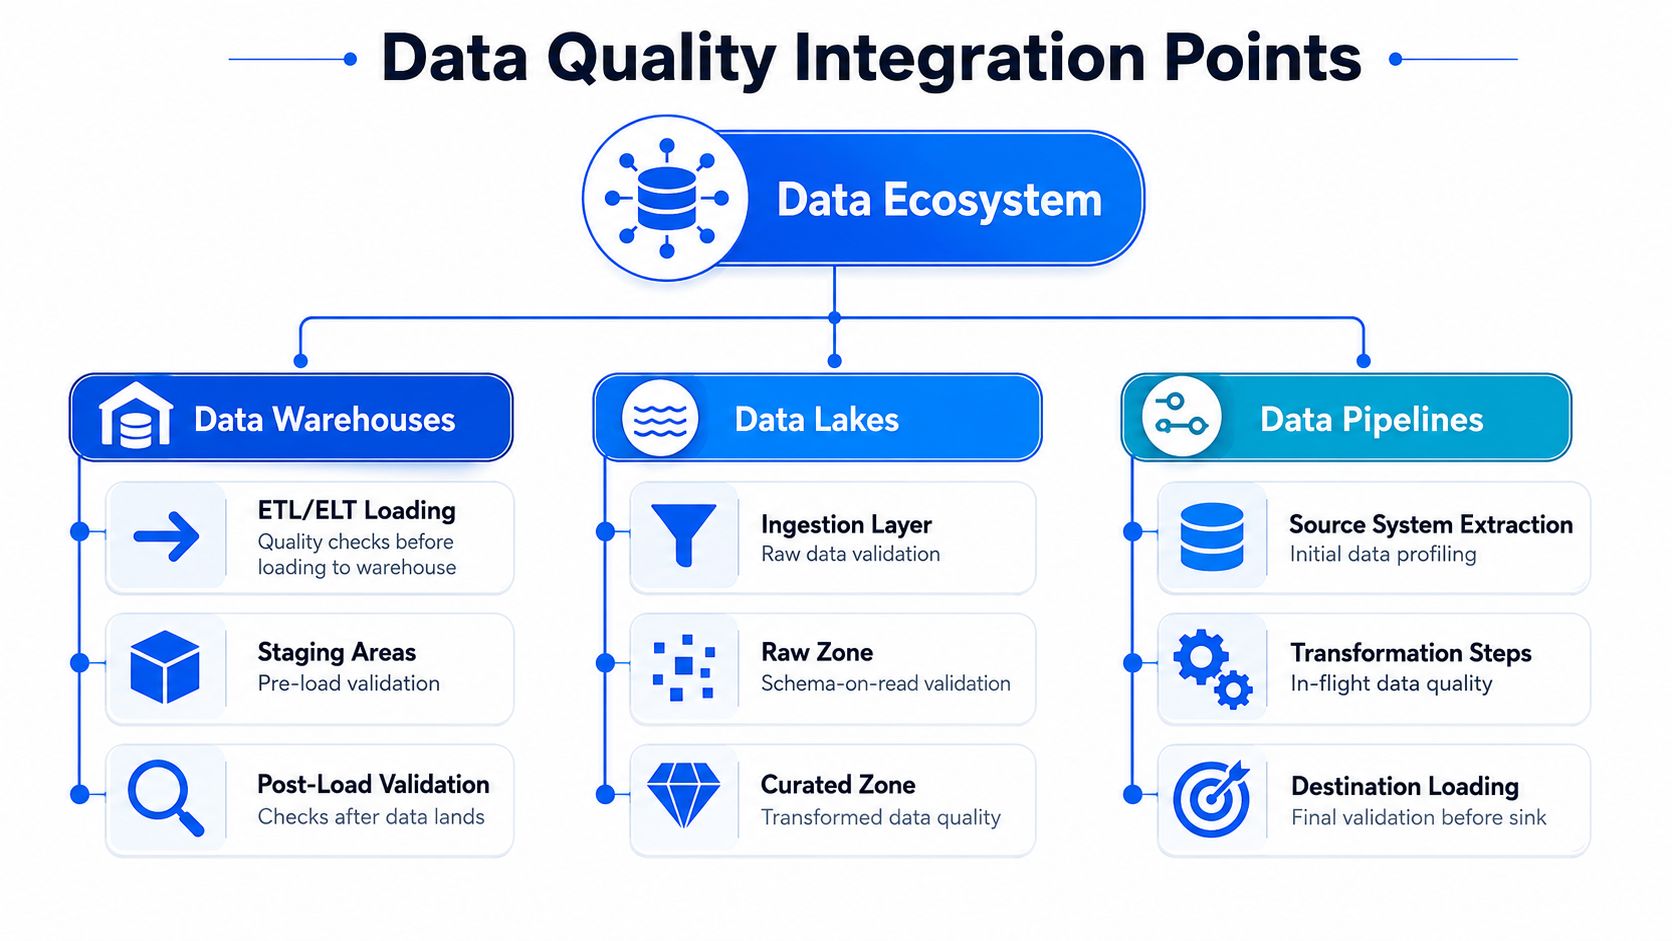
Design work begins when quality checks touch a live stack. Warehouses, lakes, and orchestrated pipelines each expose different seams, and the best teams attach controls at the seam that already exists instead of inventing another review layer around it. That usually means validation at ingestion, targeted checks during transformation, and another pass before semantic models or BI consumption.
Where to attach controls
In warehouses, the best pressure points are ETL or ELT loading, staging areas, and post-load validation. In lakes, the useful split is ingestion, raw zone, and curated zone, because schema-on-read problems rarely show up until a query asks for a field that no longer behaves like the rest of the payload. In pipelines, source extraction, transformation steps, and destination loading each give you a different chance to catch defects before they compound.
Integration Point | Primary Quality Controls | Execution Mode |
|---|---|---|
ETL or ELT loading | Schema checks, null checks, record counts | Batch or near-real-time |
Staging areas | Type validation, duplicate detection, referential checks | Batch |
Post-load validation | Freshness checks, aggregate anomaly checks | Batch plus scheduled monitoring |
Ingestion layer | Raw payload validation, completeness checks | Streaming or batch |
Raw zone | Schema drift detection, basic profiling | Batch |
Curated zone | Cross-system consistency, value standardization | Batch |
Source system extraction | Initial profiling, extraction completeness | Scheduled |
Transformation steps | Join inflation checks, rule validation | In-flight |
Destination loading | Final validation before sink | Batch or near-real-time |
If you're comparing ELT and ETL choices, optimizing data pipeline choices is a solid reference for how pipeline shape changes where the control point should live. The architecture decision matters because the more work you push downstream, the harder it gets to explain a failure once business users are already consuming the output.
In practice, in-database execution keeps the data resident in the customer environment while still feeding a unified dashboard. That matters for enterprises that don't want another copy of sensitive data floating around just to validate a load. It also fits schema tracking better, since warehouse metadata can be used to flag added or removed columns without re-exporting the data itself.
For a warehouse-specific view of this design, data warehouse integration patterns help frame how the same control logic behaves differently in staging, transformation, and serving layers.
Sample Validation Checks You Can Run Today
The quickest wins are boring, and that's a good thing. Start with checks that catch breakages people feel, then wire the results into whatever your team already uses for incident review. A validation check is only useful if it points to a defect someone can act on before the bad data spreads.
The checks that catch real failures
Null and completeness checks should flag missing required fields before downstream joins fail or compliance extracts go blank. The trigger is simple, a field crosses its acceptable missing-value boundary, and the output should say which table, column, and load window drifted. This catches source system regressions, failed enrichments, and broken handoffs from upstream teams.
Freshness checks matter when the business assumes a feed is current. The best version compares actual arrival against the learned arrival pattern or schedule, then reports delay as a data issue, not just a job issue. That catches late loads, stalled connectors, and orchestration problems that would otherwise show up as stale dashboards.
Uniqueness and duplicate checks belong on join keys, natural keys, and business identifiers. If the same entity starts appearing more than once, you want the output to show the key space that inflated, not just a generic duplicate count. That catches replayed messages, merge mistakes, and source-side dedup failures.
Schema drift checks should fire when a column type changes, a field disappears, or a new column appears in a place where downstream models expect stability. The output needs to include the exact structural change so the right owner can decide whether to accept it, map it, or block it. This is the check that saves teams from spending half a sprint debugging a silent parsing issue.
Practical rule: if a check can't tell you what changed, it isn't ready for production.
The checklist below is the one I'd lift into a runbook first:
Schema Validation: confirm the incoming structure still matches the contract.
Null Value Checks: count missing essential fields before they hit downstream logic.
Duplicate Record Detection: flag repeated identifiers before they distort aggregates.
Range and Format Checks: stop impossible values and malformed strings early.
Referential Integrity: confirm related records still point to valid parents.
Cross-System Consistency: compare the same business entity across source systems.
Freshness and Latency: monitor whether the data arrived when it was supposed to.

Deployment Testing and Continuous Monitoring
The cleanest rollout I've seen started with one high-impact domain and a small set of metrics tied to business pain. The team profiled the source tables first, captured baseline statistics on missing values, data types, lengths, and recurring patterns, then turned those into machine-readable rules before enabling alerts. That sequence worked because it gave operators a benchmark before they started judging change as good or bad.
Rollout before scale
A good deployment arc usually follows audit, metric definition, profiling, cleansing or validation, then monitoring, which matches the practical guidance in steps to improved data quality. The key is to keep the scope narrow enough that every alert can be traced and every false positive can be explained. Broad rollout plans often fail because nobody has a clean baseline for what normal looked like before the rules were turned on.
CI-style validation gates help once the rules are ready. Canary checks against a production mirror catch transformation defects before they reach the active sink, and shadow-mode anomaly detection gives the team time to tune thresholds without interrupting delivery. That's the point where lineage becomes a first-class requirement, because if a defect appears, the team needs to know where it entered and which downstream assets inherited it.
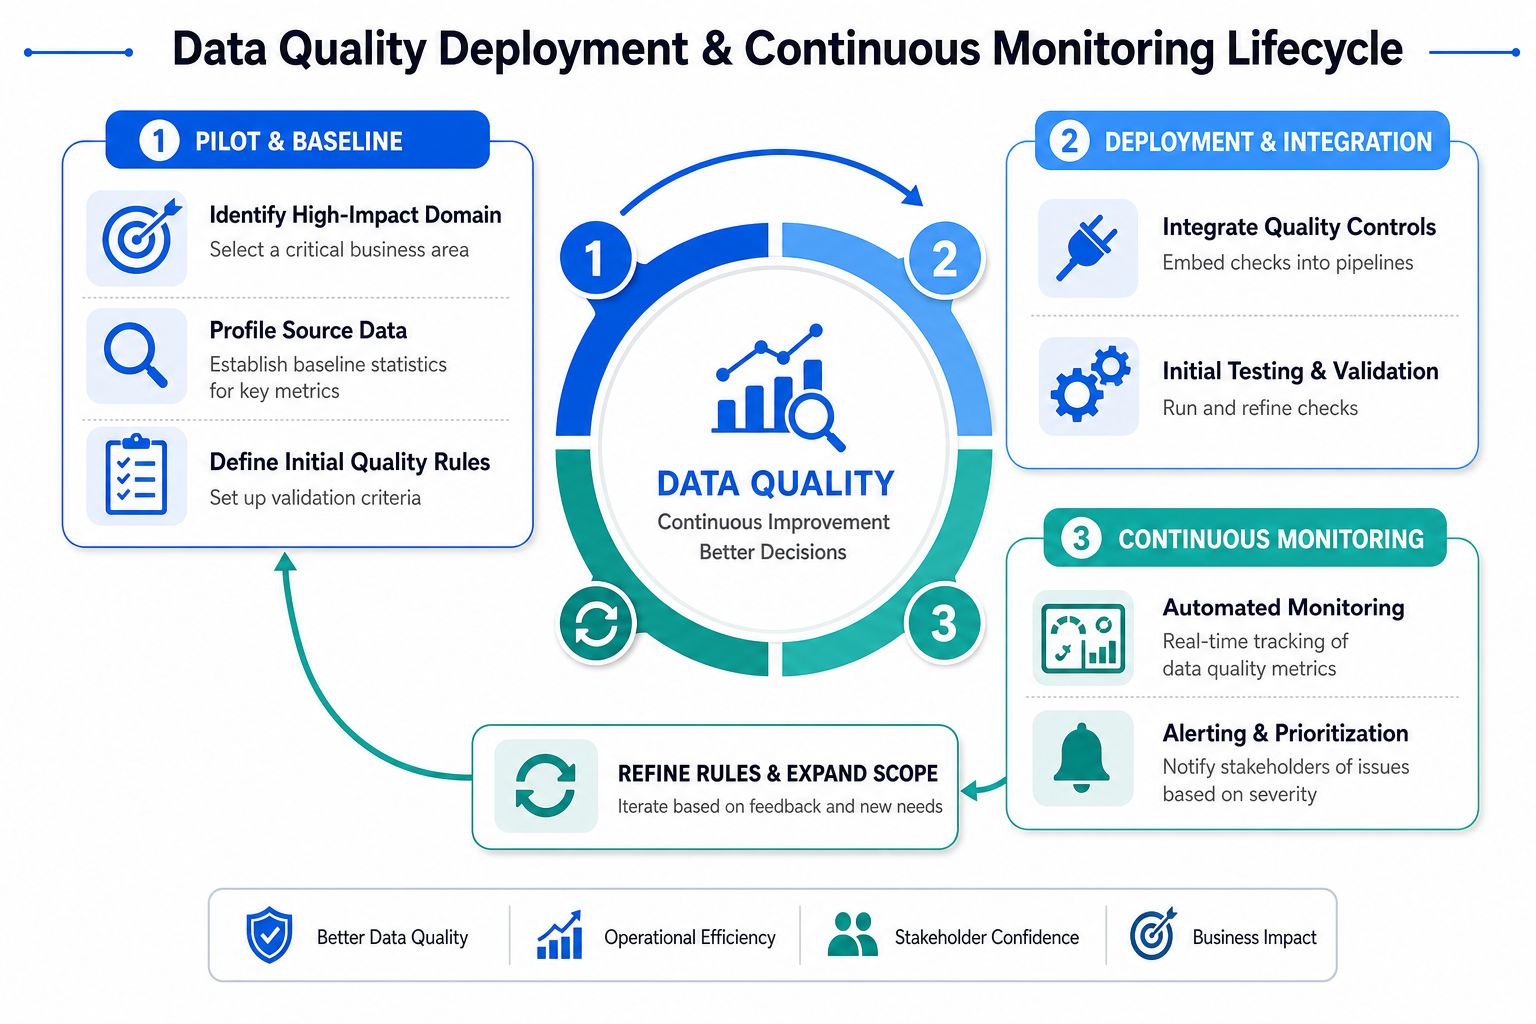
A practical sequence looks like this.
Profile first. Measure the current state and capture the baseline.
Instrument the pipeline. Put the checks into the ingestion and transformation path.
Watch the first weeks closely. Compare anomalies, rule failures, and transformation errors against the baseline.
Refine the rules. Keep what catches real defects, remove what only adds noise.
If you want a platform example, digna runs analyses inside customer-controlled databases and combines anomaly detection, timeliness checks, schema tracking, and record-level validation without moving data into a separate execution environment. That design fits well when the rollout needs both operational monitoring and audit-friendly execution.
Alerting Prioritization and Reducing Noise
Detection is cheap. Prioritization is where teams either build trust or burn it. If every null spike, minor delay, and harmless schema note becomes a page, the on-call group stops treating data quality as operationally real and starts treating it like background chatter.
Severity routing that people will actually use
The simplest alert model has three tiers, data-down, degraded, and informational. Data-down means the business process is broken or the downstream consumer should stop trusting the feed. Degraded means the pipeline still runs, but the quality signal has crossed a threshold that affects interpretation. Informational should be routed to dashboards or digest channels, not live pages.
Ownership routing matters just as much as severity. Send the alert to the team that owns the source, transformation, or consumer layer where the defect entered, and include the table or field boundary in the message. Suppression windows help too, especially when a known upstream incident creates the same symptom across multiple downstream checks.
Don't page for every symptom. Page for the first root cause, then dedupe the rest.
Anomaly detection plus timeliness monitoring usually cuts noise better than a rule-per-condition setup because it reduces the number of hard-coded exceptions that need constant maintenance. It also handles the cases static logic misses, like a feed arriving on time but with an unusual distribution, or a feed changing shape while still landing inside the normal job window.
For a practical threshold, I'd page only when a defect blocks a consumer, breaks a contract, or corrupts a regulated output. I'd use Slack or Teams for degradations that need attention but don't require an immediate response, and I'd keep informational signals in the dashboard unless they repeatedly cluster into a real pattern. That kind of routing keeps the alert stream readable, which is the difference between a monitoring system and a notification firehose.
Governance Best Practices for Sustainable Quality
A durable program needs more than checks. It needs a governance loop that keeps the checks aligned with the business, the auditors, and the engineering teams that have to live with the result. The backbone is still straightforward, catalog the data, profile it, define the business rules, engage the stakeholders, and monitor the KPIs continuously so the program doesn't decay after the first launch cycle.
That's where the trade-off gets real. Maximum automation speeds delivery, but it can erode auditability if controls are hidden inside opaque tooling. Maximum control satisfies auditors, but it slows analytics teams when every schema change becomes a manual review. The better answer is a hybrid model where validation happens close to the data, inside customer-controlled environments, with explicit support for data contracts, schema governance, and version governance.
If you're evaluating broader control frameworks, top GRC solutions for businesses is useful context for how governance programs connect risk, compliance, and operating discipline. That broader lens matters because data quality is not just a technical hygiene task, it is part of how the enterprise proves trustworthiness over time.
The operating model that holds up is simple. Keep the controls near the source, keep the audit trail visible, and keep the business owner involved when the rule set changes. That combination gives you enough automation to move quickly without giving up the evidence trail that regulated teams need.
If you're trying to stop stale dashboards, schema drift, and noisy alerts from becoming normal, digna is built to run checks inside your databases and watch timeliness, schema changes, anomalies, and validation rules without moving data into a separate execution layer. Visit digna to see how that approach fits your warehouse, lake, or pipeline stack, then map one critical domain and start with the checks that will save your team the most time next week.